3D Printing Construction

Geographic reference: World
Year: 2020 and 2028
Market size: $7.08 million and $1.03 billion, respectively

3D printers have come a long way since they were invented by Charles W. Hull in the mid-1980s. 3D printing, also known as additive manufacturing, involves laying down material, layer by layer, to form three-dimensional objects. The instructions to do this come from digital files created using computer-aided design or computer-aided manufacturing software. The files can also be created using a 3D scanner. While much of 3D printing is used to create product models and prototypes, final products are also being made, from toys to auto parts to prosthetic devices. And, more recently, houses and other infrastructure. In January 2021, the first neighborhood of 3D printed houses was being built in California. In April 2021, a couple in the Netherlands became Europe’s first tenants of a fully 3D printed house. Venice is home to the first 3D printed concrete footbridge and Amsterdam is home to the first 3D printed steel footbridge.

The advantages of 3D printing in the building sector include high accuracy, increased efficiency, reduced labor cost, and greater speed in construction. Some houses can be built in two or three weeks at a 40% lower cost. 3D printing also allows builders to construct complex building structures that would be difficult or impossible the traditional way. In addition, 3D printing construction is more eco-friendly than traditional building methods. According to the World Green Building Council, the building and construction sector produces 39% of all carbon emissions. However, 3D printing methods can prevent up to 2,000 kg of carbon dioxide from entering the atmosphere per house built. It also produces up to 10 times fewer waste products than traditional building methods.1 Major disadvantages hindering adoption of this technology on a wider scale are the high cost of investment in both equipment and materials,2 lack of skilled labor, limitation of the machinery, and concerns about the intellectual property rights of the structural designs.

Two of the most used methods of 3D printing construction are extrusion and powder bonding. Extrusion accounted for a greater than 61% revenue share in 2020. This method is mostly used for on-site construction. It uses traditional construction materials such as geopolymers, concrete, cement, clay, and plaster. Powder bonding is expected to see significant growth through 2028 as demand for faster, simpler, and more accurate methods for creating complex formwork increases. 

Concrete had the highest revenue share in 2020, 32%. 3D concrete printing is used as an alternative to traditional concrete construction to reduce cost, labor, and time. Metal is expected to experience substantial growth through 2028. Metal 3D printing is used primarily for designing facade nodes and other connectors. It’s also used for bridge construction. 

The construction of commercial, residential, and industrial buildings accounted for more than 73% of revenue in 2020; the other 27% was from infrastructure. The Asia-Pacific region held a 38% revenue share in 2020, the highest in the world. Major companies in this market include COBOD International A/S, Yingchuang Building Technique Co. Ltd., XtreeE, Apis Cor, WASP S.r.l., CyBe Construction, Sika AG, MX3D, Contour Crafting Corp., ICON Technology Inc., and Constructions -3D. Some developers and construction companies are partnering with 3D printing companies to strengthen their market share and increase their offerings. For example, 3Strands, a Kansas City developer, partnered with ICON to build 2- and 3-bedroom homes in Texas. Other companies are focusing on innovative product offerings to attract clients. Yingchuang Building Technique built the first 3D printed bus stop in Jinshan Garden, China. It was made using recycled waste material.

The 3D printing construction sector is a minuscule part of the overall $11.5 trillion global construction market and is expected to still be a tiny part of the overall market in the future, despite anticipated growth of more than 14,500% from 2020 to 2028. But, as the demand for green affordable housing and environmentally-friendly business practices grows and the supply of construction workers shrinks, 3D printing construction may take up an increasingly larger share of the overall construction market. 

1 According to Mighty Buildings, a builder of modern 3D printed prefabricated buildings.
2 Industrial scale 3D printers used in construction, some measuring 20 feet high, 140 feet wide, and 120 feet long, cost more than half a million dollars. Materials used for these printers cost considerably more than traditional building materials.

Sources: “3D Printing Construction Market Size, Share & Trends Analysis Report by Construction Method (Extrusion, Powder Bonding), by Material Type, by End User (Building, Infrastructure), by Region, and Segment Forecasts, 2021 – 2028,” Grand View Research Report Overview, July 2021 available online here; “3D Printing Construction Market Size Worth $1,034,096.7 Thousand by 2028: Grand View Research, Inc.,” CISION PR Newswire, July 22, 2021 available online here; “Global Construction Market Expected to Reach $16.6 Trillion by 2025, Growing at a CAGR of 7% – ResearchAndMarkets.com,” Business Wire, March 9, 2021 available online here; Rosie Frost, “These 3D Printed Net-Zero Buildings Could Be the ‘Future of Housing’,” euronews.green, April 1, 2021 available online here; Sam Lubell, “3D-Printing Is Speeding Up the Automation of Construction,” Metropolis, February 15, 2021 available online here; Matt Hickman, “World’s First 3D-printed Steel Bridge Debuts in Amsterdam’s Red Light District,” The Architect’s Newspaper, July 21, 2021 available online here; Tony Hoffman, “3D Printing: What You Need to Know,” PC Mag, July 1, 2020 available online here; Daniel Boffey, “Dutch Couple Become Europe’s First Inhabitants of a 3D-printed House,” The Guardian, April 30, 2021 available online here.
Image source: Mebner1, “printer-3d-pressure-3d-printing-1455166,” Pixabay, June 15, 2016 available online here.

Geosynthetics

Geosynthetics
Click photo to enlarge
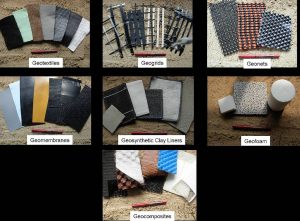
Geosynthetics are products used to separate, reinforce, filter, drain and contain terrain. They are made of synthetic polymers and come in the following forms: geotextiles, geogrids, geonets, geomembranes, geosynthetic clay liners, geofoam, geocells, and geocomposites. Because they do not biodegrade as easily as natural materials do, they are more stable and longer-lasting when used underground.

Geotextiles are flexible porous fabric made of synthetic fibers such as polypropylene or polyester. They are used for erosion control and to strengthen the soil on slopes. In combination with steel fencing, they can contain construction debris during demolition. Geotextiles can also be used to filter pollutants from stormwater run-off.

Geogrids and geonets, as their names imply, are grid- and net-like structures formed from polymers. Geogrids can be made from polyester, polyvinyl alcohol, polyethylene, or polypropylene. Geonets are made from polyethylene resin and are often laminated with geotextiles. Geogrids are used as reinforcement materials and geonets are used for drainage of liquids and gases.

A geomembrane can be made from one of several types of polymers. It’s a low permeability synthetic liner or barrier used to contain liquids or gases. Since the 1980s, this type of geosynthetic has been used to line solid-waste landfills. Geomembranes are also used as liners for secondary containment of underground storage tanks, golf course water holes and sand bunkers, water and waste conveyance canals, heap leach pads, and fish and shrimp ponds in the aquaculture industry.

Geosynthetic clay liners consist of thin layers of factory-fabricated bentonite clay in between two layers of geotextiles or bonded to a geomembrane. They’re used to retain seepage within a landfill.

Geofoam consists of processed polystyrene. The foam has many closed cells filled with air. Geofoam is 98% air by volume. It’s formed into large, lightweight blocks used as filler below a highway, bridge approach, embankment or parking lot. Geofoam can minimize settlement and reduce the weight on underground utility lines thereby minimizing the chance of collapse. Because of its insulating properties, installing it under pavement can minimize or eliminate the damage caused by frost heave. Geofoam is also used for retaining structures and slope stabilization to minimize the likelihood of landslides.

Geocells, also known as Cellular Confinement Systems, are honeycomb-shaped structures. The cells can be filled with sand, soil, rock, gravel or concrete depending on the project. Geocells limit the movement of the material while maintaining its compaction. This structure allows for the distribution of loads over a wider area. They’re used for reinforcing soft or uneven soil foundations and for stabilizing steep slopes. Because the cells allow for the passage of water, nutrients, and organisms through the soil, plant growth is possible. The plants’ roots then provide even more stability to the soil.

Geocomposites are combinations of geotextiles, geogrids, geonets, and/or geomembranes fabricated into a single unit. What materials are combined will depend on the purpose for which the end product will be used. For example, geotextile-geogrid composites provide separation and filtration functions, and drainage is improved in comparison to using geotextiles alone. One use for this type of geocomposite is to intercept and convey leachate in landfill liner and cover systems.

Today’s market size shows the worldwide revenues for geosynthetics in 2018 and projected for 2026.1 Geotextiles commanded the highest market share in 2018, more than 30%, followed by geogrids and geomembranes. Over this time period, growth will come from the construction and mining industries. Increased infrastructure spending on roads, bridges, railways, airports, and harbors in the United States, Germany, Poland, the United Kingdom, Russia, Australia, and India will increase demand for geosynthetics. In the mining industry, geosynthetic materials are used for creating waste barriers for mining by-products. Around 40% of global geomembrane production is used in the mining industry.

North America, whose revenues totaled $10.27 billion in 2018, is expected to continue to have the largest market share over this time period due to increased mining operations in the United States as well as ongoing infrastructure projects. Europe is expected to be the second-largest market as a result of the growing demand for residential buildings. Also, strict regulations relating to industrial waste management in Germany are expected to increase demand for geomembranes. The Asia-Pacific region is expected to see substantial growth as disposable incomes rise and the government invests more in industrial and commercial construction projects. Some leading global manufacturers of geosynthetics include Solmax, TenCate Geosynthetics Asia Sdn Bhd, TENAX SPA, Fibertex Nonwovens A/S, Tensar International Corp., HUESKER, Strata Systems Inc., ASRU AMERICA Inc., Global Synthetics, and Terram Geosynthetics Pvt. Ltd.

1 Due to the COVID-19 pandemic, many industries across the world ceased operations, at least temporarily. The source’s projections were compiled before this disruption. Because of this, the data may be revised in the future.

Geographic reference: World
Year: 2018 and 2026
Market size: $27.16 billion and $45.25 billion
Sources: “Geosynthetics Market Size, Share and Industry Analysis, by Product (Geotextile Geogrid, Geonets, Geocells, Geofoam, Geosynthetic Clay Liner, Geocomposites), by Application and Regional Forecast 2019-2026,” Fortune Business Insights Summary, March 2020 available online here; “Geosynthetics,” Wikipedia, November 24, 2019 available online here; “Geotextile,” Wikipedia, December 19, 2019 available online here; “Geogrid,” Wikipedia, March 1, 2020 available online here; “Geonets,” Wikipedia, November 27, 2019 available online here; “Geomembrane,” Wikipedia, November 24, 2019 available online here; “Geosynthetic Clay Liner,” Wikipedia, March 1, 2020 available online here; “Geofoam,” Wikipedia, March 1, 2020 available online here; “Cellular Confinement,” Wikipedia, January 16, 2020 available online here; “Geocomposite,” Wikipedia, November 27, 2019 available online here; “Solmax-GSE Becomes Solmax,” Solmax Press Release, February 11, 2019 available online here.
Image source: Geosynthetic Institute, “File:Geosynthetics1.jpg,” Wikimedia Commons, April 12, 2009 available online here.

Seismic Reinforcement Materials

rebar seismic reinforcement material

The planet we live on is seismically active. According to the United States Geologic Survey, 500,000 earthquakes are detected annually worldwide. Of those, about 100,000 can be felt and a mere fraction of that, about 100, cause damage. While the number of earthquakes that cause damage is comparatively small, the amount of damage caused can be large, totaling into the tens or hundreds of billions of dollars. Losses from the magnitude 9.0 earthquake in Tohoku, Japan in 2011 totaled $220 billion; the 2008 Wenchuan, China earthquake, $90 billion; and the 1994 Northridge, California earthquake, $20 billion. As of 2017, the Northridge earthquake was the third costliest disaster in U.S. history.

Beyond the monetary costs is the toll they take on the residents affected. From 1990 to 2015,1 worldwide more than 916,000 people died as a result of earthquakes, many more thousands were injured and still more displaced.

While the number of earthquakes remains fairly steady from year to year, damages and losses have been rising. Several factors contribute to this. More people are living in earthquake-prone urban areas where the population is denser. Older buildings are not designed to withstand the movement caused by earthquakes. And globalization, the supply and demand interdependency of businesses around the world, causes disruptions far and wide when businesses cannot operate due to damages caused by an earthquake in one region of the world.

To prevent future damages, both monetary and humanitarian, some governments in earthquake-prone areas have implemented stricter building codes for new construction and regulations for retrofitting older structures. Today’s market size shows the total revenues from seismic reinforcement materials in 2018 and projected for 2026. Seismic reinforcement materials include steel, concrete, wood, and composites such as carbon-fiber-reinforced polymers and glass-fiber-reinforced polymers. Revenues from steel were the highest of the four materials. Steel is expected to account for nearly half of all revenues by 2026 due to its extensive use in rebars, columns, beams, and the like. The Asia Pacific region, with its earthquake-prone countries of China, India, Indonesia, Thailand, and the Philippines and its increasingly urbanized population, is expected to claim 60% of the market by 2025. Leading companies in this industry include Hyundai Steel Company, Simpson Strong-Tie Company Inc., Toray Industries Inc., ArcelorMittal, and LafargeHolcim Ltd., among others.

1 2015 is the last year for which data are available.

Geographic reference: World
Year: 2018 and 2026
Market size: $33.6 billion and $42.01 billion, respectively
Sources: “Seismic Reinforcement Materials Market Forecasts | 40 Billion-Dollar Mark by 2025, 570 Pages Report,” Reuters Plus Press Release, July 29, 2019 available online here; “Seismic Reinforcement Materials Market Size Worth Around USD 42.01 Bn by 2026,” GlobeNewswire Press Release, June 12, 2019 available online here; Hazus® Estimated Annualized Earthquake Losses for the United States, FEMA-366, April 2017 available online here; “Is Earthquake Activity Increasing?” British Geological Survey available online here; “Earthquake Statistics,” United States Geological Survey available online here.
Original sources: Global Market Insights and Acumen Research and Consulting.
Image source: horndesign, “iron-rebar-housebuilding-iron-rods-2326791,” Pixabay, May 21, 2017 available online here.

Soft Veneer and Plywood

Today’s market size is the value of soft veneer and plywood consumed in the United States in 2007 and 2011. This figure is referred to as apparent consumption as it is the result of the following calculation: the value of U.S. made product shipments, less exports, plus imports. In the case of soft veneer and plywood, as in the case of all construction materials, the years since 2007 have been very difficult as the industry works through the collapse of the housing market and… builds back very slowly. Production fell over this period by 23% while exports grew by the same percentage and imports dropped by 42%.

Geographic reference: United States
Year: 2007 and 2011
Market size: $4.28 billion and $3.09 billion respectively
Sources: (1) “Value of Exports, General Imports, and Imports by Country and by 6-digit NAICS,” U.S. International Trade Statistics, a data set kept by the U.S. Census Bureau and made available online here. (2) “Manufacturing: Subject Series: Industry-Product Analysis: Industry Shipments by Products, 2007,” 2007 Economic Census, data on NAICS 321212, available online with all the Economic Census reports from the Census Bureau’s American FactFinder web site here. (3) “Value of Product Shipments: Value of Products for Product Classes, 2010 and 2011,” Annual Survey of Manufactures, available online through the American FactFinder site but more specifically, here
Original source: U.S. Department of Commerce, Bureau of the Census
Posted on February 11, 2014

Silica Sand for Hydraulic Fracturing

Sand

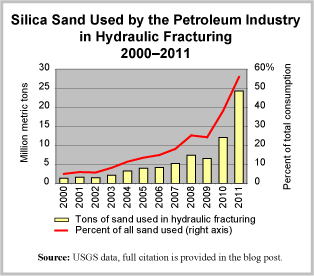
Yesterday’s post on the size of the world market for silica sand got us to thinking. So, we dug around in the U.S. Geological Survey’s Minerals Yearbook, to see if we could clearly see any trends in the use of silica sand in the United States. What we found was clear indeed and we present it here in a graph.

Overall, silica sand consumption has increased 62% from 2000 to 2011. The use of silica sand by the petroleum industry, for hydraulic fracturing, has grown 1,674%. The use of silica sand in oil and gas fracking operations was a relatively steady 5% of the overall demand for decades and began to rise in the mid-2000s. By 2011, it reached 56% of total demand for silica sand in the United States. Final data on 2012 are not yet available but all signs show that the trend seen in the graph has continued apace.

Today’s market size is the value of silica sand used in oil and gas hydraulic fracturing operations in the United States in 2001 and in 2011.

Geographic reference: United States
Year: 2001 and 2011
Market size: $47.5 million and $1.33 billion respectively
Source: Thomas P. Dolley, “Silica [Advanced Release]” Tables 1 and 6, 2011 Minerals Yearbook, March 2013, pages 66.1-66.10, USGS, available in PDF format here. Data from Tables 1 and 6 of the Silica chapter of each annual Minerals Yearbook from 2000 through 2010 were used and may be accessed at the USGS web site here.
Original source: U.S. Department of the Interior, U.S. Geological Survey (USGS)
Posted on January 31, 2014

Silica Sand

Sand is made up, primarily, of very small quartz (silicon dioxide, or SiO2) crystals. Quartz is one of the most common minerals found on the Earth’s surface, so it is both an easily found mineral and one we use in many, many ways. Sand is used in water filtration, in glass manufacturing, in industrial casting, as an abrasive in many applications, in producing concrete, in adding texture to slick roads, and as a filler in children’s sand boxes. Silica sand, however, has a higher price than the sand usually used to help on deicing roads and making concrete. This is because it is a purer sand, having the composition and grain-size distribution required for industrial applications. Silica sand has well-rounded, consistently sized granules of almost pure quartz grains.

The demand for silica sand has been rising steadily for years now. Globalization—if you will forgive such a sweeping generalization—is one of the main reasons, as is the increased demand worldwide for glass (think HD TVs, tablets and cell phones), and the significant increase in the use of hydraulic fracturing in the oil and gas industry. The hydraulic fracturing process for oil and gas extraction takes a mixture of silica sand (often called frac sand), water and chemicals and injects this mixture into a well under very high pressures. Small cracks form in the bedrock and the sand in the mixture helps to prop open these tiny fissures. From the fissures, conduits form that increase the flow of fluids and gas within the well.

Today’s market size is the value of silica sand sold worldwide in 2011 and a forecast for its value in 2016.

Geographic reference: Worldwide
Year: 2011 and a forecast for 2016
Market size: $6 billion and $9.2 billion respectively
Sources: (1) World Industrial Silica Sand, a brochure to promote an industrial study produced by The Freedonia Group and published in October 2012. The brochure is available online here. (2) “Industrial Silica Sand FAQs,” Minnesota Department of Natural Resources, last updated on October 31, 2012 and available here.
Posted on January 29, 2014

Elevators & Escalators

Elevators and escalators are an almost invisible part of the infrastructure of large buildings, invisible only in that they are taken for granted by most of their users. For the industry involved in making and servicing these complex machines, invisibility may well be just fine, after all, when attention is drawn to them it is often for all the wrong reasons—slowness, jerkiness, and/or safety problems.

Leaders in this industry include Otis, Schindler, ThyssenKrupp and KONE, each representing around 20% of the world market. The areas of greatest growth in new installations are areas of the world that are seeing the largest increase in both urbanization and high-rise construction. Maintenance of existing machinery is a part of the business that is strongest in the well-established industrialized world and is an important part of this industry.

Today’s market size is the estimated number of new elevator and escalator installations around the world during 2012 as well as the installed base that year.

Geographic reference: World
Year: 2012
Market size: 670,000 new units added to a base of slightly over 11 million
Source: “Elevator and Escalator Market,” published in 2013 by KONE and available here with geographical breakdowns of the global market.
Original source: KONE
Posted on July 1, 2013

World Cement Market

Cement production in the world is dominated by China, whose production in 2011 accounted for 53.7% of all cement made globally. The third largest cement company in the world is China National Building Materials Company Limited often seen abbreviated as CNBM. Chinese companies also account for 7 additional companies on the 2011 list of the top 20 cement companies globally. The top two companies on that list are Lafarge (from France) and Holcim (from Switzerland).

Today’s market size is the total number of metric tons of cement produced worldwide in 2011, a number which represents a 9% increase on the 2010 figure.

Geographic reference: Worldwide
Year: 2011
Market size: 3.6 billion metric tons
Source: “Top 20 Global Cement Companies,” Global Cement Magazine, December 2012, page 14.
Original source: European Cement Association
Posted on December 13, 2012

Cement in the United States

U.S. Apparent Consumption

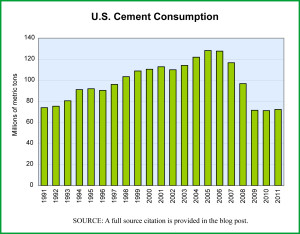
The recession of 2007-2009 was deep and hit many sectors hard. The construction sector was one of the hardest hit and all the suppliers to it have been struggling to find enough stability to weather the downturn which has yet to turn around. But even knowing these facts, we were surprised by the stunningly severe downturns seen in the Spanish cement industry since 2007—as reported in the last post. It made us wonder how the U.S. cement industry has fared during the same period. The graph here charts U.S. cement consumption for a similar time period as the one in our last post on Spain.

The differences in these charts are very interesting and very telling. In the United States, the build up in consumption during the housing boom was strong but not nearly as sharp as the build up in Spain. The declines in both countries were sharp and abrupt as the housing bubble burst and the banking crisis began. However, in Spain, the post-2007 decline was sharper, more like a fall from a cliff and it has continued to fall sharply since whereas in the United States the decline leveled off in 2009 and 2010 and actually showed signs in 2011 of possibly beginning to recover, if only slightly.

Today’s market size post shows the overall value of cement sales—portland and masonry cement—in the United States in 2006 and 2011.

Geographic reference: United States
Year: 2006 and 2011
Market size: $12.6 billion and $6.6 billion respectively
Source: “Cement – Statistics and Information,” Mineral Industry Survey, a series of reports produced by the U.S. Geological Survey, made available online and last updated on May 25, 2011. Here is a link to the USGS site.
Original source: U.S. Department of the Interior
Posted on May 29, 2012

Cement in Spain

Spanish Cement Consumption

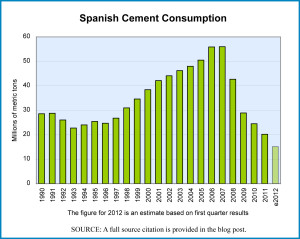
We hear much these days about Europe and the economic struggles it is having. Watching from afar—or at least as far as one can be in our very intertwined, economically globalized world—we tend to see primarily the outlines of the big, macro picture. A quick glance at Spanish cement demand since 2007 reminds one of how the overall downturn is hitting some sectors with special ferocity.

While many industrialized nations experienced a construction boom during the 2001-2007 period, Spain’s was one of the larger. Consequently, its cement industry grew at a robust rate for a decade. Since peaking in 2007 it has shrunk dramatically and significant declines in early 2012, on a year-over-year basis, suggest that the shrinking is far from complete. In fact, rates of consumption when measured on a per capita basis have not been as low in Spain since 1966.

Today’s market size post shows the demand for cement in Spain in 2007 and 2011. The graph shows Spanish cement consumption over a two decade period.

Geographic reference: Spain
Year: 2007 and 2011
Market size: 56.0 and 20.2 million metric tons respectively
Source: “Holcim Spain to Cut 35% of Workforce,” Global Cement, May 23, 2012, available online here. and updates from the Monthly Retail Trade Reports from the same reporting series, U.S. Census Bureau, available online here. The graph was created from data provided by Oficemen, the Spanish Cement industry association, Agrupación de Fabricantes de Cemento de España, available online here.
Original source: Global Cement and Oficemen
Posted on May 25, 2012

Floor Covering Stores

Today’s market size is based on sales through retail outlets dedicated to floor coverings, from carpets to tile, wood to laminates. Two years of estimated sales by these retail outlets in the United States are provided. Leading retailers in this category include ABC Carpet and Home, Empire Home Services, Floor and Decor, Lumber Liquidators, and Seagull Enterprises.

Geographic reference: United States
Year: 1998 and 2009
Market size: $17,013 million and $15,734 million respectively
Source: “Estimated Annual Sales of U.S. Retail and Food Service Firms by Kind of Business: 1998 Through 2009,” Annual Retail Trade Survey—2009, available in a PDF format here. For links to these data as well as earlier U.S. Annual Trade Survey data, check this Census Bureau site.
Original source: U.S. Bureau of the Census
Posted on October 21, 2011

Windows

Window manufacturers have been hit hard by the decline in new home construction. Today’s market size is the total number of windows shipped by manufacturers in the United States for use in new construction in 2005 and an estimate of what that number will be for 2011. Leading manufacturers of window include Anderson Corp.; Atrium Windows and Doors; Jeld-Wen, Inc.; Marvin Windows and Doors; and Pella Corp.

Geographic reference: United States
Year: 2005 and 2011
Market size: 34.1 million and 11.9 million units respectively
Source: Andrew Martin, “In Company Town, Cuts but No Layoffs,” The New York Times, September 25, 2011, page B1 and B10, available online by a different title here.
Posted on October 19, 2011

Czech Cement

Cement production in the Czech Republic has shown signs of a recovery in the first half of 2011. Today’s market size is the estimated total production of cement in Czechoslovakia in 2011.

Geographic reference: Czech Republic
Year: 2011
Market size: 3.3 million metric tons
Source: “Production Rise is Not the End of Czech Tunnel,” Global Cement Weekly, August 24, 2011, page 2, available online here.
Original source: Jan Hrozek, Chairman of the Ceskomoravsky Cement Company
Posted on August 25, 2011

Crushed Stone

Crushed Stone Sales Stats

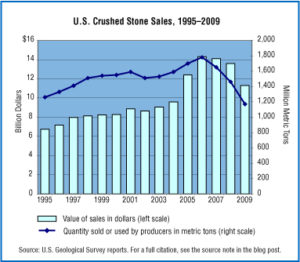
The market for crushed stone grew steadily through the first half of the last decade peaking in 2006 and then falling sharply as the housing market bubble imploded. The pattern can be seen clearly in the graphic which presents crushed stone sales, or use by producers, measured in quantity as well as value for the years 1995 through 2009.

Today’s market size is the value of crushed stone sales by producers in 2009. The data do not include American Samoa, Guam, Puerto Rico, or the U.S. Virgin Islands.

Geographic reference: United States
Year: 2009
Market size: $11.3 billion
Source: “Table 1: Salient Crushed Stone Statistics,” 2009 Mineral Yearbook, April 2011, page 71.5, available online here. The graphic was produced with data from this report as well as earlier editions of the same report.
Original source: U.S. Department of the Interior, USGS

Cement in China

The rise of China as an economic powerhouse has been a significant development in this century so far. Building an economic powerhouse requires building and building requires building materials, one of the oldest of which is cement. China has invested heavily in its cement production capacity, nearly tripling its clinker production capacity between 2000 and 2010 according to the U.S. Geological Survey. Clinker is, in the most basic sense, a coarse form of cement which has yet to be ground down into the fine powdery substance that is cement, the glue that binds all the ingredients of concrete together.

Today’s market size is the size of cement production capacity in China in 2010.

Geographic reference: China
Year: 2010
Market size: 2.41 billion tons
Source: “Chinese Production Statistics for 2010,” Global Cement Weekly, July 6, 2011, page 1.
Original source: OneStone Research

Copper

Copper mining history in the U.S.

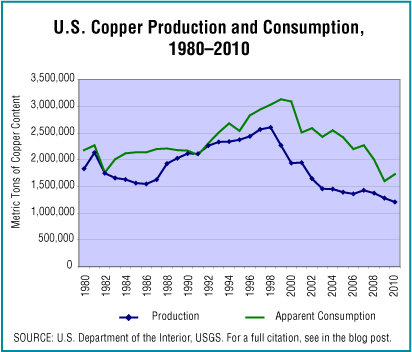
The price of copper has been rising for a few years now so a 5% decline in the quantity of copper mined in the United States between 2009 and 2010 did not result in a loss of value of the total copper mined. Today’s market size is the quantity and value of copper mined in the United States in 2010. The graphic shows production and apparent consumption figures for a period of 30 years, from 1980 to 2010. Apparent consumption is a calculated figure based on production, plus imports, minus exports plus or minus change in stock.

Geographic reference: United States
Year: 2010
Market size: 1.12 million metric tons valued at $8.4 billion
Source: “Copper,” Mineral Commodity Summary 2011, January 2011, page 48, available online here.
Original source: U.S. Department of the Interior, USGS

Cement

Cement Production Graph

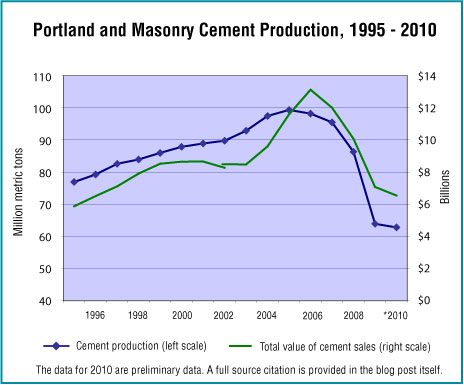
A decade plus worth of production data on the cement industry shows a pattern with which we are familiar, the build-up and crash of the housing market. Most of the construction materials industries have seen similar patterns of growth and decline in the 2000s. Early data on 2010 show that sales of cement in that year reached a 27 year low, falling 45% (59 million metric tons) off the high reached in 2005.

The market size presented below is the number of metric tons of portland and masonry cement produced in the United States in 2010 and the approximate value of that cement if shipped from the mill the same year.

Geographic reference: United States
Year: 2010
Market size: 62.8 million metric tons with an approximate value of $5.7 billion
Source: “Cement,” part of an annual series titled Mineral Commodities Summaries, published by the U.S. Geographical Survey and available online here.
Original source: U.S. Department of the Interior, USGS

Steel Production

The production of crude steel around the world rebounded in 2010, rising 15% over the 2009 production levels. In terms of crude steel production by nation, China led the world in 2010 with 44.32% of world production, followed by Japan with 7.75%, the United States with 5.70% and Russia with 4.47%.

Geographic reference: World
Year: 2010
Market size: 1,414 million metric tons
Source: “World Crude Steel Output Increases by 15% in 2010,” January 21, 2011, available online here.
Original source: World Steel Association

Bricks

Today we look at the market size of another construction materials industry that has been hard hit by the housing crisis in the United States. The market size being presented here, for two different years, is the number of standard brick equivalents or SBEs shipped by the industry per year. It is worth noting that the interim years, between 1995 and 2009, saw strong sales and shipments—in the range of 8 to 9 billion SBEs—but did not skyrocket quite as much as some other construction material sectors.

Geographic reference: United States
Year: 1995 and 2009
Market size: 7.0 billion and 3.7 billion SBEs respectively.
Source: “Boral USA, Analyst Visit,” a presenation, table 60, September 2009.
Original source: Boral Ltd. and Brick Industry Association

Market for Cement in Brazil

Many nations in Latin America have recovered far more quickly from the global downturn that began in 2008 than has the United States. As a basic building material, the demand for cement serves as an indicator of how the construction industry is faring from country to country. Brazil’s construction industry is doing quite well and is forecast to grow sharply over the next five years. The market sizes presented here are based on demand for cement. The figure for 2015 is a forecast by the source.

Geographic reference: Brazil
Year: 2010 and 2015
Market size: 58 million and 75 million metric tons respectively
Source: “News North and South America: Brazil Forecast to Experience Big Growth,” Global Cement Magazine, November 2010, page 41.