3D Printing Construction

Geographic reference: World
Year: 2020 and 2028
Market size: $7.08 million and $1.03 billion, respectively

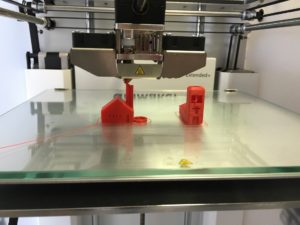
3D printers have come a long way since they were invented by Charles W. Hull in the mid-1980s. 3D printing, also known as additive manufacturing, involves laying down material, layer by layer, to form three-dimensional objects. The instructions to do this come from digital files created using computer-aided design or computer-aided manufacturing software. The files can also be created using a 3D scanner. While much of 3D printing is used to create product models and prototypes, final products are also being made, from toys to auto parts to prosthetic devices. And, more recently, houses and other infrastructure. In January 2021, the first neighborhood of 3D printed houses was being built in California. In April 2021, a couple in the Netherlands became Europe’s first tenants of a fully 3D printed house. Venice is home to the first 3D printed concrete footbridge and Amsterdam is home to the first 3D printed steel footbridge.

The advantages of 3D printing in the building sector include high accuracy, increased efficiency, reduced labor cost, and greater speed in construction. Some houses can be built in two or three weeks at a 40% lower cost. 3D printing also allows builders to construct complex building structures that would be difficult or impossible the traditional way. In addition, 3D printing construction is more eco-friendly than traditional building methods. According to the World Green Building Council, the building and construction sector produces 39% of all carbon emissions. However, 3D printing methods can prevent up to 2,000 kg of carbon dioxide from entering the atmosphere per house built. It also produces up to 10 times fewer waste products than traditional building methods.1 Major disadvantages hindering adoption of this technology on a wider scale are the high cost of investment in both equipment and materials,2 lack of skilled labor, limitation of the machinery, and concerns about the intellectual property rights of the structural designs.

Two of the most used methods of 3D printing construction are extrusion and powder bonding. Extrusion accounted for a greater than 61% revenue share in 2020. This method is mostly used for on-site construction. It uses traditional construction materials such as geopolymers, concrete, cement, clay, and plaster. Powder bonding is expected to see significant growth through 2028 as demand for faster, simpler, and more accurate methods for creating complex formwork increases. 

Concrete had the highest revenue share in 2020, 32%. 3D concrete printing is used as an alternative to traditional concrete construction to reduce cost, labor, and time. Metal is expected to experience substantial growth through 2028. Metal 3D printing is used primarily for designing facade nodes and other connectors. It’s also used for bridge construction. 

The construction of commercial, residential, and industrial buildings accounted for more than 73% of revenue in 2020; the other 27% was from infrastructure. The Asia-Pacific region held a 38% revenue share in 2020, the highest in the world. Major companies in this market include COBOD International A/S, Yingchuang Building Technique Co. Ltd., XtreeE, Apis Cor, WASP S.r.l., CyBe Construction, Sika AG, MX3D, Contour Crafting Corp., ICON Technology Inc., and Constructions -3D. Some developers and construction companies are partnering with 3D printing companies to strengthen their market share and increase their offerings. For example, 3Strands, a Kansas City developer, partnered with ICON to build 2- and 3-bedroom homes in Texas. Other companies are focusing on innovative product offerings to attract clients. Yingchuang Building Technique built the first 3D printed bus stop in Jinshan Garden, China. It was made using recycled waste material.

The 3D printing construction sector is a minuscule part of the overall $11.5 trillion global construction market and is expected to still be a tiny part of the overall market in the future, despite anticipated growth of more than 14,500% from 2020 to 2028. But, as the demand for green affordable housing and environmentally-friendly business practices grows and the supply of construction workers shrinks, 3D printing construction may take up an increasingly larger share of the overall construction market. 

1 According to Mighty Buildings, a builder of modern 3D printed prefabricated buildings.
2 Industrial scale 3D printers used in construction, some measuring 20 feet high, 140 feet wide, and 120 feet long, cost more than half a million dollars. Materials used for these printers cost considerably more than traditional building materials.

Sources: “3D Printing Construction Market Size, Share & Trends Analysis Report by Construction Method (Extrusion, Powder Bonding), by Material Type, by End User (Building, Infrastructure), by Region, and Segment Forecasts, 2021 – 2028,” Grand View Research Report Overview, July 2021 available online here; “3D Printing Construction Market Size Worth $1,034,096.7 Thousand by 2028: Grand View Research, Inc.,” CISION PR Newswire, July 22, 2021 available online here; “Global Construction Market Expected to Reach $16.6 Trillion by 2025, Growing at a CAGR of 7% – ResearchAndMarkets.com,” Business Wire, March 9, 2021 available online here; Rosie Frost, “These 3D Printed Net-Zero Buildings Could Be the ‘Future of Housing’,” euronews.green, April 1, 2021 available online here; Sam Lubell, “3D-Printing Is Speeding Up the Automation of Construction,” Metropolis, February 15, 2021 available online here; Matt Hickman, “World’s First 3D-printed Steel Bridge Debuts in Amsterdam’s Red Light District,” The Architect’s Newspaper, July 21, 2021 available online here; Tony Hoffman, “3D Printing: What You Need to Know,” PC Mag, July 1, 2020 available online here; Daniel Boffey, “Dutch Couple Become Europe’s First Inhabitants of a 3D-printed House,” The Guardian, April 30, 2021 available online here.
Image source: Mebner1, “printer-3d-pressure-3d-printing-1455166,” Pixabay, June 15, 2016 available online here.

Unified Endpoint Management

Unified Endpoint Management consists of software tools that provide a single management interface for a variety of devices on multiple platforms.
Geographic reference: World
Year: 2019 and 2027
Market size: $2.75 billion and $23.98 billion, respectively

Today’s market size shows total global revenues for unified endpoint management (UEM) in 2019 and projected for 2027. UEM consists of software tools that provide a single management interface for a variety of devices (endpoints) such as desktop computers, tablets, smartphones, printers, Internet of Things devices, and wearables. UEM tools allow IT departments to configure, control, and manage devices on multiple platforms: Windows 10, macOS, Android, iOS, Chrome OS, Linux, among others. These tools also allow for simplified migration from legacy platforms to newer ones. 

In 2019 there were 1,506 data breaches in the United States alone, exposing more than 164 million records. In 2018, more than 471 million records were compromised. With more people working from home, especially during the pandemic, the need for organizations to remotely manage and secure a variety of devices on third-party networks in addition to their own networks is critical. More and more employees are accessing corporate networks and data from their personal devices; the devices themselves, and the software on them, aren’t sanctioned by the companies’ IT departments. Also, employees may be working while using unsecured home or public Wi-Fi hotspots. In the past most security breaches happened within a corporate network, now breaches are increasingly coming from unsecured endpoints. Some UEM tools use zero-trust security that blocks users whenever they try to access a different part of an organization’s network. Users are not automatically granted access because they have previously been granted access. Therefore, if a breach takes place, only part of the network is compromised.

UEM evolved from mobile device management and enterprise mobility management. Mobile device management allowed IT departments to manage mobile devices remotely, but these devices were dedicated to certain limited uses. Enterprise mobility management incorporates both mobile device management as well as mobile content management — document and data security and device-specific app management. These solutions, however, take a piecemeal approach to provide security and management features for legacy, desktop, mobile, and IoT devices. UEM provides users with “a comprehensive solution that requires organization through a single pane of glass, making the management process simpler overall.”1 This unified approach also helps organizations comply with government regulations such as GDPR by allowing administrators to encrypt multiple databases and their contents while maintaining compliance regulations. UEM tools provide auditing and reporting functionality to meet these requirements.

Large organizations held a 74% revenue share in 2019. This segment is expected to continue to hold the majority share through 2027. Growth is expected as more large organizations adopt a variety of endpoint solutions, complicating IT management. The increasing risk of cyber threats against large firms is also expected to spur growth. The fastest revenue growth, however, is expected to come from small and medium-sized businesses (SMEs) as they adopt more cloud-based solutions and increasingly need to secure company-owned as well as employees’ personal devices. The need to manage compliance requirements is also spurring SMEs to adopt UEM solutions. 

Businesses in the telecommunications and IT sectors held the highest market share in 2019, followed by the banking, financial services, and insurance sector, and government and defense. UEM in the healthcare sector is expected to experience the highest growth as more healthcare institutions adopt mobile and other IoT devices to remotely communicate, collaborate, and share critical information. Increased adoption of blood pressure monitors, wearable devices, and other cloud-based devices will also contribute to the growing adoption of UEM solutions.

North America claimed 42% of the market in 2019 and is expected to continue to hold the largest share through 2027 as companies continue to invest in advanced technologies to simplify their business operations. The Asia Pacific region is expected to experience the fastest growth over this time period. Organizations in this region are increasingly adopting mobile devices and IoT applications as well as cloud-based solutions and “bring your own device” policies. 

The market is fragmented with both large and emerging companies offering a range of UEM solutions. In some cases, UEM vendors are forming partnerships and collaborations in addition to acquiring companies to maintain their market share. Some major companies offering UEM solutions include 42Gears Mobility Systems Pvt. Ltd., BlackBerry Ltd., Citrix Systems Inc., IBM, Matrix42 AG, Microsoft, MobileIron Inc., Sophos Ltd., SOTI Inc., Zoho Corp., Ivanti, and VMWare Inc.

1 Source: Tess Hanna, “UEM or EMM: What’s Better for Endpoint Management? Mobility Management Solutions Review, October 26, 2018 available online here.

Sources: “Unified Endpoint Management Market Size $23.98 Billion by 2027: Grand View Research, Inc. – Press Release – Digital Journal,” Journal of Cyber Policy, October 8, 2020 available online here; “Unified Endpoint Management Market Size $23.98 Billion by 2027: Grand View Research, Inc.,” Digital Journal Press Release available online here; “Unified Endpoint Management Market Size, Share & Trends Analysis Report by Component (Solution, Services), by Organization Size (SMEs, Large Enterprises), by Vertical, by Region, and Segment Forecasts, 2020 – 2027,” Grand View Research Report Summary, September 2020 available online here; “What is Unified Endpoint Management?” VMware Glossary available online here; Tess Hanna, “UEM or EMM: What’s Better for Endpoint Management? Mobility Management Solutions Review, October 26, 2018 available online here; J. Clement, “Cyber Crime: Number of Data Breaches and Records Exposed 2005-2020,” Statista, October 1, 2020 available online here.
Image source: Gerd Altmann, “binary-one-cyborg-cybernetics-2302728,” Pixabay, May 11, 2017 available online here.

Out of Band Authentication

Have you logged into your bank or investment accounts recently? If so, perhaps you entered your username and password, clicked a button, and then you were asked to enter a PIN or password that was emailed or texted to you. Do you work with sensitive information? Logging into the database from your desktop computer or laptop might involve not only your username and password but also a separate app on your smartphone or tablet. You enter your username and password; then a push notification appears in the authentication app asking you to accept or deny access. These scenarios are examples of out of band authentication.

Out of band authentication is a process that uses a different communication channel for authentication than the primary communication channel that the user is trying to access, making it more difficult for hackers to compromise the authentication process. However, this process is not foolproof. The 2018 Reddit.com data breach exposed internal data as well as employee and user email addresses and passwords. Reddit.com used 2-factor authentication via text message. According to Verizon’s 2018 Data Breach Investigations Report, worldwide, more than 43,000 data breaches involving stolen customer credentials occurred in 2017, 91% targeted banking institutions.

Today’s market size shows the amount spent on out of band authentication software and services for 2018 and projected for 2023. Because of the growing threat of ever more sophisticated cyber attacks and increasingly stringent information security regulations, this market is expected to grow at a compound annual growth rate of 23.5%. The demand for cloud-based out of band authentication solutions is expected to grow at an even higher rate. Several companies comprise this market including Gemalto, CA Technologies, Symantec, Ping Identity, and RSA Security, to name a few.

Geographic reference: World
Year: 2018 and 2023
Market size: $533 million and $1.53 billion, respectively
Sources: “The OOBA Market Size is Expected to Grow From USD 533 Million in 2018 to USD 1,532 Million by 2023, at a Compound Annual Growth Rate (CAGR) of 23.5%,” PRNewswire, March 12, 2019 available online here; “Out of Band Authentication (OOB),” The Secret Security Wiki available online here; “Reddit Breach Highlights Limits of SMS-Based Authentication,” Krebs on Security, August 1, 2018 available online here; 2018 Data Breach Investigations Report, 11th Edition, Verizon, April 2018 available online here.
Image source: William Iven, “office-business-accountant-620822,” Pixabay, February 3, 2015 available online here.

Firewall as a Service

cloud computing security firewallA firewall prevents unauthorized access to a network based on a defined set of security rules. For more than two decades firewalls have been used to provide network security. Firewalls can be hardware-based or software-based or both.

Firewall as a Service (FWaaS) is a cloud-based service in which an organization’s firewall is centralized to monitor traffic coming from multiple locations within the organization, from mobile users and the internet. Without using FWaaS, employees in a company’s IT department may spend time maintaining multiple firewalls in multiple locations. Besides responding to cyber threats, this includes updating hardware and software to thwart new threats or to comply with new government regulations and verifying that security rules are consistent throughout the network. FWaaS creates a centralized point of access for network traffic with the ability to automatically scale the service depending upon need, adding more network locations or adding bandwidth capabilities. The provider of these services is responsible for maintaining the firewall infrastructure. FWaaS providers have dedicated security teams that monitor systems, provide necessary updates and respond to network security threats.

Today’s market size shows the amount spent globally on FWaaS in 2017 and 2022. Data for 2022 are projected. The market is expected to grow at a compound annual growth rate of 24.9% from 2017 to 2022. An increasing need for more sophisticated network security, the ability to rapidly upgrade firewall protocols, and reduced operating costs are some reasons the demand for FWaaS is expected to increase over the next 5 years. Major vendors of FWaaS are Barracuda Networks, Cato Networks, Check Point Software Technologies, Cisco Systems, Forcepoint, Fortinet, Juniper Networks, Palo Alto Networks, WatchGuard, and Zscaler.

Geographic reference: World
Year: 2017 and 2022
Market size: $0.56 billion and $1.70 billion respectively
Sources: “Firewall as a Service Market Worth 1.70 Billion USD by 2022,” Cision PR Newswire, March 2, 2018 available online here; Dave Greenfield, “What is Firewall as a Service and Why Do You Need It?” Cato Networks, April 16, 2018 available online here; Alan Zeichick, “Understanding Cloud-Based Firewalls,” enterprise.nxt, February 20, 2017 available online here; “What is a Firewall?” Cisco, available online here.
Original source: MarketsandMarkets
Image source: wynpnt, “cloud-computing-network-internet-2001090,” Pixabay, January 23, 2017 available online here.

Web Application Firewalls

CybersecurityA web application is a computer program that uses an internet browser as a client interface. Some examples of web applications are email clients such as Gmail; productivity applications such as G Suite and Microsoft 365, which include word processors and spreadsheets; and multi-player online gaming applications. Online banking and investing websites that allow users to access their accounts and perform transactions are also examples of web applications. As these applications have gotten more complex and the storage of sensitive data has gotten more prevalent, the need for sophisticated security has increased.

One type of security measure is a firewall. A firewall prevents unauthorized access to a network based on a defined set of security rules. For more than two decades firewalls have been used to provide network security. Some types of firewalls include packet-filtering, state-inspection, unified threat management, and next-generation. Early firewalls examined the packets that came through the network, but they couldn’t distinguish between valid application layer protocol requests, data, and malicious code disguised as valid traffic or data. The need for application layer protection became necessary as attacks against web servers became more frequent. Benefits of application layer firewall protection include being able to block specific content or websites, control the execution of files and control the handling of data by specific applications.

Today’s market size shows the amount spent on web application firewalls globally in 2017 and projected for 2023. Governmental organizations and e-commerce companies are the top two targets of cyber attacks. The organizations themselves are not the only ones vulnerable to attack. The malware that infects the web application can infect the users’ computers also.

Geographic reference: World
Year: 2017 and 2023
Market size: $2.37 billion and $5.92 billion respectively
Sources: “Global Web Application Firewall Market 2018-2023 – Segmented by Component, Organization Size, Industry Vertical, and Region – ResearchAndMarkets.com,” Business Wire Press Release, May 14, 2018 available online here; Margaret Rouse, Casey Clark and Michael Cobb, “Firewall,” TechTarget, February 2018 available online here; “What is a Firewall?” available online here; Daniel Nations, “What Exactly Is a Web Application?” Lifewire, February 22, 2018, updated by Elise Moreau available online here.
Image source: JanBaby, “security-secure-locked-technology-2168233,” Pixabay, March 23, 2017 available online here.

Bitcoin Ransomware Payments

RansomwareAccording to the 2018 Data Breach Investigations Report, in 2017 there were 53,308 cybersecurity incidents worldwide with more than 2,200 data breaches. As a percentage of all malware incidents, ransomware incidents have risen dramatically since 2013. More than 40% of malware incidents involved ransomware in 2017. Ransomware is a type of malicious software that prevents a user from accessing their computer or mobile device, either by disabling the operating system or encrypting files, until a ransom is paid. The ransom usually totals a few hundred dollars per infected computer. Ransomware can infect servers as well as individual devices. People clicking on an infected email attachment, visiting infected websites or clicking on ads that contain malware are some ways that computers can get infected. Ransomware targets vulnerabilities in software. Updates to software attempt to remove these vulnerabilities so that cybercriminals can’t exploit them.

According to the FBI, ransomware infects more than 100,000 computers worldwide per day and payments to cybercriminals total nearly $1 billion per year. However, the cost of a ransomware attack goes beyond the payment to the attacker. Even after paying the ransom about 20% of companies do not get their data back. The costs associated with business downtime, recovery of files and increased spending on cybersecurity are many times greater. According to Kaspersky Lab, in 2016 the average ransom demand was $300, but the average cost to a small to medium-sized company due to a ransomware attack was $99,000. Globally, the cost of cybercrime is expected to reach $6 trillion by 2021, up from $3 trillion in 2015. Today’s market size shows the minimum amount of ransom paid to cybercriminals in Bitcoin from 2013 to mid-2017 based on analysis of 35 ransomware families. As of May 2018, there were more than 500 known families of ransomware that demand Bitcoin as payment.

Geographic reference: World
Year: 2013 to mid-2017
Market size: $12.8 million
Sources: Alex Lielacher, “Size of Bitcoin Ransomware Market ‘Overhyped’ in the Media,” Brave NewCoin, April 23, 2018 available online here; “Deputy Attorney General Rod J. Rosenstein Delivers Remarks at the Cambridge Cyber Summit,” The United States Department of Justice, October 4, 2017, updated October 6, 2017 available online here; Masara Paquet-Clouston, et. al., Ransomware Payments in the Bitcoin Ecosystem, May 2018 available online here; 2018 Data Breach Investigations Report, 11th Edition, Verizon, April 2018 available online here; “The Cost of Cryptomalware: SMBs at Gunpoint,” Kaspersky Lab Daily, September 7, 2016 avalable online here; Tamara Chuang, “Inside the Profitable Underworld of Ransomware,” Government Technology, March 5, 2018 available online here.
Image source: TheDigitalArtist, “ransomware-cyber-crime-malware-2320941,” Pixabay, May 18, 2017 available online here.

Database Security

database security
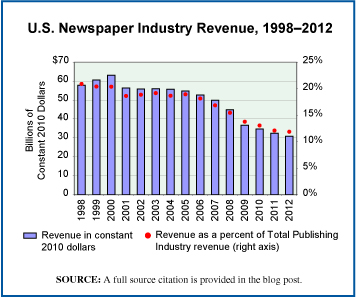
Globally the number of cyber security incidents increased 1,637% from 3.4 million incidents in 2009 to more than 59 million incidents in 2015. In the United States the number of data breaches alone increased from 446 in 2007 to 1,579 in 2017. According to Steve Langan, chief executive at Hiscox Insurance, cybercrime cost the global economy more than $450 billion dollars in 2016.

As a result of the growing threats from viruses, worms, Denial of Service attacks and other malware the need for increasingly sophisticated cyber security solutions grows year by year. In 2017 the business sector was the most vulnerable to data breaches in the United States followed by the medical/healthcare sector, accounting for 55% and 23.7% of all data breaches respectively.

Today’s market size shows the amount industries around the world spent on database security in 2017 and the amount they are projected to spend in 2022. The market is expected to grow at a compounded annual growth rate of 18.9% due to the increase in the amount of data that needs protecting, the increase in malware threats, and the increase in regulations protecting the privacy and security of customers’ health and financial data.

Geographic reference: World
Year: 2017 and 2022
Market size: $2.95 billion and $7.01 billion respectively
Sources: “Database Security Market by Software, Service, Business Function, Deployment, Organization Size, and Vertical Global Forecast to 2022 – Research and Markets,” Business Wire Press Release, January 2, 2018 available online here; “Global Number of Cyber Security Incidents From 2009 to 2015 (in Millions),” Statista, October 2015 available online here; Luke Graham, “Cybercrime Costs the Global Economy $450 Billion: CEO,” CNBC, February 7, 2017 available online here; “Data Breaches: The Insanity Continues,” Identity Theft Resource Center, 2015 available online here; “2017 Annual Data Breach Year-End Review: Executive Summary,” Identity Theft Resource Center, 2017 available online here.
Image source: Geralt, “Binary-hands-keyboard-tap-enter-2372131,” Pixabay, June 2017 available online here.

Collaborative Robots

Global Sales of Collaborative Robots
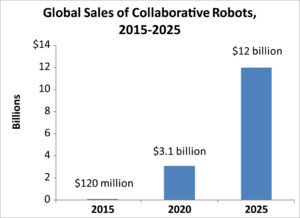
Collaborative robots, or co-bots, are robots that work alongside human workers. Many workers are wary of the increased use of robots in general, fearing the loss of their jobs. M.I.T. and Boston University estimated that up to six people lose their jobs for each robot per 1,000 workers a company adds. Employers, however, cite increased productivity, cost savings, and healthier work environments when robots are used in the workplace. Robots can work in hazardous jobs or do repetitive tasks thereby reducing worker injuries.

Today’s market size shows the total global sales of collaborative robots in 2015, 2020, and 2025. Figures for 2020 and 2025 are projections. According to the Robotic Industries Association, the United States is third behind Japan and China in the total number of industrial robots in use—250,000 in 2017. According to the Brookings Institution, metro Detroit has more than 15,000 industrial robots in place, almost five times the number of any other major city in the U.S.

Geographic reference: World
Year: 2015, 2020 and 2025
Market size: $120 million, $3.1 billion (projected) and $12 billion (projected).
Source: Dolan, Matthew, “Rise of the Robots,” Lansing State Journal, October 30, 2017, page 8A.
Original source: Barclays Equity Research analysts

International Data Flow

The World Wide Web. A decentralized network of data stored on servers all around the world. But many countries—China, Russia, Germany, and Belgium, to name a few—are enacting laws requiring multinational companies to store and process country-specific data on local servers. According to the source, relaxing such restrictions has become a priority of President Donald Trump’s administration as they negotiate trade agreements, including the upcoming renegotiation of NAFTA.

Proponents of these laws say that having their users’ data stored locally aids in cyber security. Opponents say that storing data on local servers is more expensive, especially for small to medium sized companies. High tech companies worry about having their source codes stolen. Some companies worry that governments or political groups will use the data stored on these servers for illegitimate reasons. And many argue that limiting data flow also limits job growth and innovation. According to Nigel Cory, a trade policy analyst at the Information Technology and Innovation Foundation, “data needs to flow to create value.”

Today’s market size is the estimated value of data flowing through international borders in 2014, according to a report by the McKinsey Global Institute.

Geographic reference: World
Year: 2014
Market size: $2.8 trillion
Sources: Yu, Roger, “More Firms Push Back on Foreign Data Rule,” USA TODAY for the Lansing State Journal, August 13, 2017, page 4B
Original source: Manyika, James, et. al., Digital Globalization: The New Era of Global Flows, McKinsey Global Insitute, February 2016 available online here.
Image source: Geralt, “Binary-hands-keyboard-tap-enter-2372131,” Pixabay, June 2017 available online here.

Smart Wearable Healthcare Market

fitbit-imgThe market for smart wearable healthcare devices is one part of the larger smart wearables market as a whole. The term wearables is used to refer to any electronic device, usually small, that can be worn relatively easily during the normal activities of life. Examples include wristbands such as the Fitbit, smart watches, clip on devices like pedometers and even clothing into which sensors have been sewn.

Smart wearable healthcare devices are those that are specifically designed to help a person monitor his or her own health—activity level, hours of sleep, heart rate, temperature, blood pressure, etc.—as well as devices designed to communicate remotely with medical providers so that they may monitor a patient from afar.

Geographic reference: United States
Year: 2014 and forecasted for 2020
Market size: $2 billion and $41 billion respectively
Source: “Healthy Beats — With Health Being the ‘Great Motivator,’ Wearables Are Gaining Popularity,” Corp! Sept./Oct. 2016, pages 36-39.
Original source: Soreon Research

Library Spending

Library-interior

Today’s market size is the dollar amount spent, worldwide, by libraries on content. “Content” in this context refers to all material, physical or digital, purchased by libraries to become a part of their offerings.

Geographic reference: World
Year: 2011 and estimates for 2013
Market size: $23.78 billion and $24.79 billion respectively
Source: Andrew Neilson, “Content Spending by Library Type and Geography, 2011,” The Rise of eBooks: Global eBooks Trends, Elsevier, June 23, 2013, available online here. The photo comes from this website and is an interior shot of the Washington State Library.
Original source: Outsell, Inc.
Posted on February 27, 2014

Spending on Internet Access

Today’s market size is the amount that was spent in the United States on Internet access in 2005 and in 2012. The increased spending from 2005 to 2012, after inflation, was 154% while the increased penetration of Internet access as a percent of the U.S. population grew by only 19% (from approximately 68% to 81%). Clearly, something other than a rising rate of Internet connectivity in the population is behind the rapidly rising national expenditure on Internet connectivity. The increased expenditure is most likely related to the changing infrastructure used to access the Internet. Users are shifting from dial-up connections to more costly, higher speed connections such as DSL (Digital Subscriber Line), Cable Internet access, Satellite Internet access and mobile broadband via cell phone service.

Geographic reference: United States
Year: 2005 and 2012
Market size: $29.7 billion and $80.7 billion respectively
Sources: (1) “Table 2.4.5 Personal Consumption Expenditures by Type of Product,” National Income and Product Accounts Tables, (NIPA), U.S. Bureau of Economic Analysis, August 7, 2013, available from the BEA web site here. (2) “Percent of Individuals Using the Internet 2000–2012,” ITU, available here.
Original source: U.S. Department of Commerce, Bureau of Economic Analysis, International Telecommunications Union (ITU), Federal Communications Commission (FCC)
Posted on January 14, 2014

Libraries

Anyone who is truly interested in knowledge will be a friend of the library. Even in an age which defines itself as the “information age,” libraries play an essential role in society. In fact, based on U.S. library usage data from this century, that role is growing.

Today’s market size is the estimated total number of libraries in the United States. The largest category of library is the school library, which accounts for slightly over 80% of all libraries and does not include the academic library which is associated with higher education. The second largest category of library is the public library with a 7.5% share of the total.

Geographic reference: United States
Year: 2010
Market size: 119,987
Source: “Number of Libraries in the United States — ALA Library Fact Sheet 1,” American Library Association, August 2013, available online here.
Original source: The ALA web site provides a long list of sources upon which the organization drew in order to reach the total count.
Posted on September 23, 2013

Wireless Systems in Cars

Nearly all automakers offer some sort of wireless network in their cars, such as General Motors’ OnStar and Ford’s SYNC. Data show the estimated revenue from wireless devices in cars in 2013. This figure is projected to increase tenfold by 2025.

Geographic reference: United States
Year: 2013
Market size: $2.5 billion
Source: Andy Greenberg, “Digital Carjackers,” Forbes, August 12, 2013, pages 44-46
Original source: GSMA, a mobile industry trade group
Posted on August, 15, 2013

Map Apps

According to IHS Automotive, one in four U.S. cars now comes with a navigation system. Globally, installations of dashboard navigation systems are estimated to reach 13.8 million by the end of 2013. Typically, automakers charge between $500 to more than $2,000 for these systems. Even standalone GPS systems tend to cost hundreds of dollars. In addition to high cost, these systems come preloaded with maps and are not connected to the internet, thereby making them more difficult to update. In some cases, a trip to the dealership is necessary.

In contrast, smartphone and tablet map apps are internet-connected, easy to update, often give real-time traffic information and in some cases can be downloaded for free. In 2012, 47% of car owners said that they used a smartphone map app while driving, up from 37% in 2011. Makers of dashboard navigation systems have taken notice. General Motors’ OnStar, Garmin, and TomTom all have created map apps of their own, ranging in price from $36 to $150. In some cases, these apps run both on mobile devices and on a car’s dashboard.

Today’s market size is the number of map app downloads in the U.S. in May 2013, an 11% increase from the total downloaded in May 2012.

Geographic reference: United States
Year: May 2013
Market size: 79.1 million
Source: Keith Naughton, “OnStar, Garmin Try to Keep Pace with Waze, Other Free Navigation Apps,” Bloomberg Businessweek, July 25, 2013, available online here.
Original source: ComScore
Posted on August 13, 2013

Newspapers

Newspapers

The news this week about The Washington Post being purchased for $250 million by Amazon founder Jeff Bezos made us want to update an earlier post about the newspaper industry, here. And so, we present today’s market size post, including a chart that shows U.S. newspaper industry revenues, annually, since 1998. Clearly, an industry going through significant change.

Geographic reference: United States
Year: 2000 and 2012
Market size: $50.29 billion and $32.04 billion respectively
Source: “Table 3.0.1 Information Sector Services (NAICS 51) — Estimated Revenue for Employer Firms: 1998 Through 2004,” Service Annual Survey, April 2006, page 24, available online here, and annual updates of the same which are available on the Census Bureau’s site here.
Original source: U.S. Census Bureau
Posted on August 9, 2013

Cloud Computing Services

In recent years more and more companies have been putting their data “in the cloud.” There are 625 million subscribers to cloud document storage services. That number is expected to reach 1.3 billion in 2017. Cloud computing service companies allow users to store data on the service provider’s remote servers from which users can access that data from anywhere using Internet-based software and a computer or mobile device. While this can be a cost-saving measure for companies, securing the data on public servers is still a concern. After recent high-profile security breaches at such companies as Nasdaq, LinkedIn, and Twitter, many cloud service companies have invested in tighter security systems for their servers.

Today’s market size data show the amount of revenue from public clouds in 2011 and projected revenue for 2016. Currently, 25% of all business information globally is held on servers that are part of what is referred to as the cloud.

Geographic reference: World
Year: 2011 and a projection for 2016
Market size: $19.4 billion and $206.6 billion respectively
Source: Steve Johnson and Scott Davis, “In the Cloud,” Lansing State Journal, March 24, 2013, pages 1E, 4E.
Posted on April 8, 2013

3D Printing

The arrival on the market of consumer level 3D printers in 2012 has brought a great deal of attention to the subject of 3D printing. In essence, 3D printing may be defined as follows: A way of making objects using a computer-driven, additive process, one layer at a time. A computer-aided design (CAD) system is used by a printer-like machine which creates thousands of cross sections of the designed object and then produces that object, in plastic or metal, layer by layer. Although the name is relatively new, the technology behind 3D printing emerged in the 1980s for use, primarily, in the manufacturing sector.

There are two distinct branches of 3D printing: (1) small-scale 3D printing, where individuals or small groups with comparatively cheap machines print plastic objects in their homes or small shops, and (2) industrial 3D printing, which is usually called additive manufacturing (AM). The current industrial applications of 3D printing (primarily the creation of models, molds and dies) are seen by many as having the potential to have a revolutionary impact on manufacturing as a whole, in part because of its replacement of more traditional machine tooling tasks.

Today’s market size is an estimated value of the 3D printer market in 2012 and a forecast as to its value within a decade. This forecast comes from a gentleman who is a founding member of a company selling 3D printers to the public, 3D Systems. His forecast may refer only to 3D printers sold for nonindustrial applications, in other words, the first of the two branches of this market, as described above.

Geographic reference: World
Year: 2012 and 2022
Market size: $500 million and $35 billion respectively.
Source: Abe Reichental in a video interview with the Financial Times, “3D Printing ‘Bigger than Internet,'” June 21, 2012, available online here. “How Will 3D Printing Impact The Manufacturing Industry?” Seeking Alpha, March 18, 2013, available online here.
Original source: 3D Systems
Posted on April 2, 2013

Instructional Technology

There is a lot of churn going on in the publishing world and the textbook segment of that industry is no different. In fact, it may be experiencing more upheaval and change than is the industry as a whole, though that would be very hard to quantify. Everyone in the publishing trade is adapting to the digital world in one way or another.

Today’s market size focuses on an industry in which eTextbooks are but a small part. The market size comes from a press release about a new market study. The elaborate title of that study is “Global Smart Education & Learning Market Advanced Technologies, Digital Models, Adoption Trends & Worldwide Market Forecast (2012—2017),” a title whose very complexity says a lot about the market being studied. That market, as defined by the study authors, includes far more than eTextbooks. It includes software applications, electronic libraries, curriculum systems, and much more. This market “caters to the needs of national governments and international standard bodies, educators from all streams and from different levels, stakeholders for training and workforce skills.”

Geographic reference: World
Year: 2011
Market size: $73.8 billion, of which, the North American market accounted for approximately 60% of this total revenue.
Source: “Global Smart Education and Learning Market Is Expected to Reach a Value of $220 Billion by 2017, New Report Says,” San Francisco Chronicle, February 13, 2013, available online here.
Original source: Research And Markets
Posted on March 7, 2013

Bioinformatics

Over the last decade bioinformatics has been characterized by the mapping of many genomes. This has fueled explosive growth in the field generally, growth which is anticipated to continue into the future.

Bioinformatics, in the most basic sense, is the application of information technology to the life sciences to increase the understanding of biological and chemical processes. It is the study of the methods for storing, retrieving and analyzing biological data, a wealth of which is growing rapidly and thus feeding demand for more bioinformatics. Fields that benefit from the output of bioinformatics are many, including especially agricultural biotechnology, pharmaceutical research and development, and medical and clinical diagnostics.

Today’s market size is the estimated value of this hybrid industry in 2012 and a projected value for 2018.

Geographic reference: World
Year: 2012 and 2018
Market size: $2.3 billion and $9.1 billion respectively
Source: “Global Bioinformatics Market is Expected to Reach USD 9.1 Billion in 2018: Transparency Market Research,” The Herald, November 28, 2012, a link to which is here.
Original source: Transparency Market Research, whose study on this industry may be purchased on their website here.
Posted on November 28, 2012