Landline Phones

For more information about the telephone industry over time, see Market Share Reporter: Trends Over Time
Geographic reference: United States
Year: 2020 and 2025
Market size: $1.03 billion and $1.10 billion, respectively

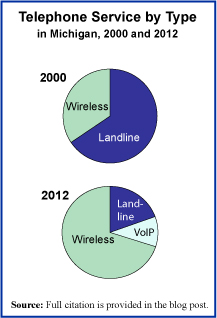
In the United States, March 10th marks National Landline Telephone Day. So, in the spirit of the “holiday,” this week’s post is dedicated to this aging and slowly disappearing technology. Today’s market size shows landline telephone revenues in 2020 and projected for 2025.1 While it may seem to many that almost everyone has “cut the cord” and gotten rid of their landline phones in favor of cell phones, this is far from the case. In 2019, 39.7% of U.S. adults were living in a household with a working landline. Of course, this is considerably less than the 92.7% in 2004. The percentage of adults living in cell phone only households rose from 5.0% in 2004 to 59.2% in 2019.

Despite predictions that landlines would be obsolete by 2020, they are still being used in millions of households and businesses across the U.S. Why? While younger adults may be more comfortable using smartphones, many older adults prefer landlines — a simple phone without all the bells and whistles they may not need, want, or understand how to use. As of June 2019, 11.4% of people 65 years old and older relied on a landline. People who have a lower income may find that keeping a single landline is less expensive than paying for cell phone service. Some people and businesses keep landlines because their security systems rely on them. Older elevators may require landlines for their emergency phones. Some people retain their landline in case of emergencies. Since a landline is linked to a specific address, when someone calls 911 the dispatcher will know exactly where the caller is calling from even if that person cannot communicate. A cell phone’s GPS cannot do that. Landline, corded phones will not become inoperable when there is a power or internet outage as cellular, fiber optic, and VoIP phones can.2 It is for these reasons the National Emergency Number Association recommends people with disabilities and those with medical conditions have a traditional landline phone. Some people keep landlines because they offer better call quality than cell phones. In rural areas where cell phone service is nonexistent or spotty, landlines provide reliable phone service.

With more and more customers “cutting the cord,” maintaining landline phone infrastructure for fewer and fewer customers scattered throughout the U.S. is getting increasingly more expensive for telecommunications companies. In 2017, it was estimated that companies spent $13.5 billion to maintain this infrastructure. While some companies still offer traditional, wired landline services, some companies are charging much higher prices than they did in the past for this service. According to the U.S. Bureau of Labor Statistics, in urban areas, landline service costs rose 26% from July 2010 to July 2020 while cell phone services decreased 23%. Other companies offer customers landline service only if it’s bundled with cell phone, internet, and TV services. Others still only offer fiber optic or VoIP phone service, providing phone service over the same lines that provide customers with internet service. For at least a decade, telecommunications companies have set dates for when they would discontinue all traditional, wired landline services in the United States. In 2017, legislatures in 20 states voted to allow AT&T to discontinue landline service in their states completely. In Illinois alone, this would’ve affected 1.2 million customers. Until reliable cell phone or internet phone service can be obtained in every home and business in the country, any discontinuation of service will have detrimental effects on individuals and businesses. They’ll not only be losing a way to communicate with friends, family, and customers but they’ll also be losing a reliable way to call for help in an emergency. 

1 The U.S. Centers for Disease Control considers VoIP phones landline phones.
2 In some cases, companies offer battery back-up options for power outages or options to switch internet-based phones to cellular service if there is an internet outage.

Sources: “Landline Phones,” Statista available online here; “March Holidays,” National Today available online here; Felix Richter, “Landline Phones are a Dying Breed,” Statista, June 15, 2020 available online here; Krystal Steinmetz, “Landline Phones Disappearing in These 20 States,” MoneyTalksNews, June 5, 2017 available online here; Robert Channick, “AT&T Ready to Hang Up on Traditional Landline Phone Service in Illinois,” Chicago Tribune, May 4, 2017 available online here; Dennis Peng, “Are Copper Phone Lines Going Away?” Ooma Blog, February 14, 2019 available online here; John R. Quain, “Is It Safe to Get Rid of Your Landline?” AARP, August 25, 2020 available online here; “Why Nearly 46 Percent of Households Still Have Landlines,” New York Post, May 4, 2017 available online here; “Landlines Predicted Obsolete by 2020; ULTATEL Explains What This Means for Businesses,” Markets Insider, July 16, 2018 available online here; “POTS (Plain Old Telephone Service) is Going Away. What’s Your Plan for the Future?” Broad Sky Networks, December 23, 2019 available online here; “Find Home Phone Services,” allconnect available online here.
Image source: Katrin Hauf, “Old Style Telephone,” Unsplash, March 25, 2020 available online here.

Information Sector

Info. SectorToday we’re looking at one sector of the U.S. economy, the Information Sector. This sector includes industries such as publishing, movie making, telecommunications, broadcasting, data processing, web hosting and all sorts of Internet activities associated with the dissemination of information. The sector is identified in the North American Industrial Coding System (NAICS) as sector 51 and includes the activities of 78 industries.

Total revenue for this sector grew by 26% from 2007 to 2014, making it one of the better-performing sectors within the larger Service Sector. Yet a closer look at the main groups in the Information Sector shows that their paths vary greatly over this period. The broadcasting industries and those related to the Internet saw real growth while the others saw little if any growth, considering that the cumulative inflation rate over this period was 14%.

The chart above shows the growth each of the industrial sectors within the Information Sector has had over the period at which we’re looking and includes a red line showing the cumulative rate of inflation over the period. Real growth only happened in the industries whose growth rate exceeded the cumulative rate of inflation.

Geographic reference: United States
Year: 2007 and 2014
Market size: $1.08 and $1.37 trillion respectively
Source: “Table 1: Estimated Revenue for Employer and Nonemployer Firms: 2007 through 2014,” 2014 Services Annual Survey, U.S. Census Bureau, January 28, 2016, available online here.
Original source: U.S. Department of Commerce, Bureau of the Census
Posted on May 24, 2016

Telephone Service: Landline versus Wireless

PhoneServiceMI

The past decade has been one of great changes in the telephone service landscape. As investment has been made in the wireless infrastructure, cell phone coverage has become much more reliable. With growing reliability of cell phones has come the option for many to do away with one’s landline phone service. The pie chart on the right shows this clearly. In the State of Michigan, the decline of landline accounts and the rise of wireless accounts has been significant since the turn of the century. For the year 2012, the graph includes a count of the users of a system called VoIP, which stands for Voice over Internet Protocol and is a telephone-like service offered to those with access to high-speed Internet connections.

There is now legislation pending in the State of Michigan to allow landline telephone service providers to begin discontinuing service to customers, after a 90-day notice, starting in 2017. This legislation would, in essence, do away with the legal right to have access to landline phone service at almost any address in the United States, a right that dates back to the early 1910s and was updated most recently in the FCC Telecommunications Act of 1996.

Michigan would not be the first state to pass such legislation. Similar laws have already passed in other states like Texas, Florida, and North Carolina. As the landscape for telephone service changes, one can not help but worry about those in areas not well covered by alternate phone service options. While wireless coverage has improved significantly over the years it is not yet near universally accessible and many people still depend upon landline service for dependable telephone connectivity.

Today’s market size is the number of phone service accounts, regardless of type—landline, wireless cell service, and/or VoIP—in the State of Michigan in 2000 and 2012. Worth noting is the population of the State in Michigan in those two years; 9.94 million and 9.88 million respectively (yes, Michigan did actually lose population over this period). Thus, the number of telephone service accounts per capita has risen over this period from 1.03 to 1.35.

Geographic reference: Michigan
Year: 2000 and 2012
Market size: 10.2 million (66% of which were landline accounts) and 13.3 million (20% landline accounts) respectively
Sources: (1) Kathleen Gray, “Still Have a Landline? Proposed Michigan Legislation Could Spell The End by 2017,” Detroit Free Press, November 18, 2013, available online here. (2) David Cay Johnson, “Phone Service for All, No Matter What Kind,” Reuters, March 28, 2012, available online here. (3) “State & County QuickFacts—Michigan,” an extract of Census Bureau data on population statistics made available on the Census web site here.
Original source: U.S. Federal Communications Commission and the U.S. Census Bureau
Posted on November 18, 2013

Wireless Systems in Cars

Nearly all automakers offer some sort of wireless network in their cars, such as General Motors’ OnStar and Ford’s SYNC. Data show the estimated revenue from wireless devices in cars in 2013. This figure is projected to increase tenfold by 2025.

Geographic reference: United States
Year: 2013
Market size: $2.5 billion
Source: Andy Greenberg, “Digital Carjackers,” Forbes, August 12, 2013, pages 44-46
Original source: GSMA, a mobile industry trade group
Posted on August, 15, 2013

Electronics Stores

Our graph from Census Bureau data

While working on an analysis of the retail and wholesale sectors of the U.S. economy, a somewhat surprising thing emerged. The four fastest growing categories of brick-and-mortar stores, based on annual growth rates from 1992–2010 were: (1) Used Car Dealerships, (2) Health and Personal Care Stores, (3) Pharmacies and, (4) Radio, TV, and Other Electronics Stores. The last of these surprised us a bit, given the fact that such a large portion of the sale of electronics has moved online and the fact that the demise of a prominent player in the sector, Circuit City, seems pretty fresh in the mind.

As it turns out, the important trend behind the strength of this retail sector is the rise of cell phones and all the new cell phone stores that one sees in shopping centers and strip malls across the United States. Cell phone stores are part of the category “Radio, Television and Other Electronics Stores” (NAICS 443112), the fastest growing sector in the overall Electronics and Appliance Retail industry (NAICS 443).

The graph shows annual sales from Radio, TV, and Cell Phone Stores in the United States from 1992–2011 and cell phone subscription figures for the period 1992–2010.

Geographic reference: United States
Year: 1992 and 2011
Market size: $20.5 billion and $58.3 billion respectively
Source: Annual Retail Trade Survey 2010, with updates from the Monthly Retail Trade Report series, available online here. The cell phone subscriber data are from the Statistical Abstract of the United States 2012, Table 1149, available from here.
Original source: U.S. Department of Commerce, Bureau of the Census
Posted on August 21, 2012

Ham Radio Operators

Amateur radio, also known as ham radio, uses a designated “radio frequency spectrum for purposes of private recreation, non-commercial exchange of messages, wireless experimentation, self-training, and emergency communication,” according to Wikipedia. Ham radio operations are coordinated by the International Telecommunication Union. Ham radio operators must demonstrate knowledge in electronics and regulations in order to obtain a license for their radio station. Once licensed, the ham radio operator can communicate with people throughout the world.

Amateur radio began in the late 19th Century. By the late 20th Century, the hobby’s
popularity was waning; however, in the early 21st Century, ham radio saw a surge in the number of enthusiasts. By 2010, the number of ham radio licenses in the United States had increased 60 percent since 1981. In 2007, the United States Federal Communications Commission stopped requiring knowledge of Morse Code in order to obtain a license. The increase in ham radio licenses has been attributed to this. In 2010 alone, there were 30,000 new applications for ham radio licenses.

Today’s market size is the total number of people that have ham radio licenses in the United States.

Geographic reference: United States
Year: 2010
Market Size: 700,000
Source: Matt Sepic, “Ham Radio Growing in the Age of Twitter,” NPR, April 5, 2010, available online here and “Amateur Radio,” Wikipedia, available online here.
Posted on December 9, 2011

Home Entertainment Market

Home Entertainment Spending, 2000-2010

Today’s market size is the value of spending on the home entertainment segment related to films and all forms of videos that are rented and purchased, on DVD, CD, and downloaded electronically. The graph shows how this market has fared for the first decade of this century and shows that even the strong home entertainment segment has seen declines during the recession that started in December 2007. Actually, spending in this market peaked in 2004 and 2005 and has declined slightly every year since then.

Geographic reference: United States
Year: 2010
Market size: $18.8 billion
Source: “DEG Year-End 2010 Home Entertainment Report,” a report produced by the industry-funded nonprofit corporation Digital Entertainment Group. The report is available online here.

VOIP Providers

Today’s market size is based on the revenues earned by Voice Over Internet Protocol (VOIP) providers in 2010. VOIP saw a tremendous 194 percent growth from 2000 to 2010. This industry is expected to grow another 17.4 percent from 2010 to 2016.

Geographic reference: United States
Year: 2010
Market size:: $12.5 billion
Source: Phil Izzo, “Top 10 Thriving Industries,” The Wall Street Journal, May 16, 2011, available online here
Original source: IBIS World

App Store Sales

We hear a lot about “apps” these days, or application programs. But what are they, really. These are computer programs designed as standalone software to run on a variety of devices, usually mobile devices. These apps are sold through online stores and usually have a well defined and somewhat limited purpose. They usually have a filename extension “.app” for use on mobile operating systems such as Android; iOS (Apple); Linux; MeeGo; Microsoft Mobile; RIM (BlackBerry); and Symbian.

Apps are a class of products whose market is based on volume. The average price of an app is around $2.50, (reached with a lot sold for 99¢ and a few sold for $9.00 plus) so a whole lot of apps had to sell in order to reach the market size presented below. There are 5 billion mobile device subscribers worldwide, according the the International Telecommunications Union (ITU). Now, all mobile devices are not “smart” devices and thus are not equipped to run apps. Nonetheless, based on the fact that an estimated 10% of these 5 billion devices are smart we can calculate, very generally, that each one of these smart device owners bought just under two apps in 2010. There seems room for growth here…

As a side note, that figure of 5 billion mobile device subscribers is rather noteworthy given that the world population in 2010 was just shy of 7 billion. Food for thought.

Geographic reference: World
Year: 2010
Market size: $2.15 billion
Source: Whitney, Lance, “Report: Apple Remains King of App Store Market,” CNET News, February 15, 2011, available online here. Also, press release from the ITU which is available online here.
Original source: IHS Screen Digest, February 2011

Mobile Phones Worldwide

The market size listed here is the number of mobile phones sold worldwide in the third quarter of 2010, of which, 19.3% were smartphones, as we saw in our last market size entry.

Geographic reference: World
Year: 3rd Quarter 2010
Market size: 417 million units
Source: “Gartner Says Worldwide Mobile Phone Sales Grew 35 Percent in Third Quarter 2010; Smartphone Sales Increased 96 Percent,” Gartner Newsroom press release dated November 10, 2010 and available online here.
Original source: Gartner Inc.

Smartphones

The definition of a smartphone, according to PC Magazine, is as follows: “A cellular telephone with built-in applications and Internet access. Smartphones provide digital voice service as well as text messaging, e-mail, Web browsing, still and video cameras, MP3 player and video and TV viewing.” In addition to their built-in functions smartphones can run a variety of computer applications which makes them true computing devices. All of this functionality varies from smartphone to smartphone and to a large degree depends on the operating systems that run these devices. The leading smartphone operating systems, based on units currently in use, are (1) Apple’s iPhone OS, (2) RIM Blackberry OS, and (3) Google’s Android OS.

The market size listed here shows the number of smartphones sold worldwide in the third quarter of 2010. Smartphone sales in this quarter represented 19.3% of all mobile phone sales.

Geographic reference: World
Year: 3rd Quarter 2010
Market size: 80.5 million units
Source: “Gartner Says Worldwide Mobile Phone Sales Grew 35 Percent in Third Quarter 2010; Smartphone Sales Increased 96 Percent,” Gartner Newsroom press release dated November 10, 2010 and available online here.
Original source: Gartner Inc.

Mobile Advertising Market

Mobile advertising is promotional activity designed to be delivered to cell phone, smartphone and other handheld device users. The market size presented here also includes Web-based search and display ads. As more consumers use smartphones and other handheld devices to access the Web, advertisers have devoted more money to mobile advertising. According to IDC, the mobile advertising market may double to $2 billion in 2011. Google had a 59 percent share of the market; Apple had less than a 10 percent share in 2010.

Geographic reference: United States
Year: 2009 and 2010
Market size: $368 million and $877 million respectively
Source: Olga Kharif, “Google Gains Market Share in U.S. Mobile Ads,” Bloomberg Businessweek, December 3, 2010 and available online here.
Original source: IDC

Internet Users Worldwide

The source for this market size is a poster offering a variety of interesting statistics about “our connected world.” Covered on the poster—a link to which is provided below—are statistics on the number of Internet users by country, broadband subscription rates by country, and numbers of people who have mobile only phone access by country. The data are presented graphically and we found it to be an interesting and useful presentation of the material.

Geographic reference: World
Year: 2010
Market size: 1.734 billion users, 20.8% of whom are in China.
Source: “Our Connected World,” made available online by buzzhunt.co.uk here.
Original source: GigaOM, Cisco, and Internet World Stats.

Size of the iPhone Market

The number of iPhones reported here is a much rounded number. The iPhone represented only 2.2% of the worldwide cell phone market in 2009. Nonetheless, profits from iPhones represent a much higher percentage of total profits from cell phones. According to the source, Nokia had nearly twenty times Apple’s market share, but profits from the iPhone were nearly the same as profits from all of Nokia’s phones combined.

Geographic reference: World
Year: 2009
Market size: 25,000,000 units
Source: James Surowiecki, “The Financial Page: Soft in the Middle,” The New Yorker, March 29, 2010, page 45