
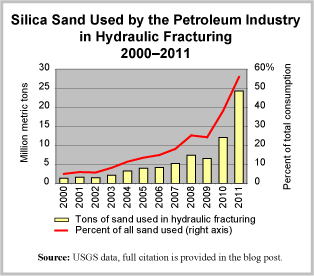
Yesterday’s post on the size of the world market for silica sand got us to thinking. So, we dug around in the U.S. Geological Survey’s Minerals Yearbook, to see if we could clearly see any trends in the use of silica sand in the United States. What we found was clear indeed and we present it here in a graph.
Overall, silica sand consumption has increased 62% from 2000 to 2011. The use of silica sand by the petroleum industry, for hydraulic fracturing, has grown 1,674%. The use of silica sand in oil and gas fracking operations was a relatively steady 5% of the overall demand for decades and began to rise in the mid-2000s. By 2011, it reached 56% of total demand for silica sand in the United States. Final data on 2012 are not yet available but all signs show that the trend seen in the graph has continued apace.
Today’s market size is the value of silica sand used in oil and gas hydraulic fracturing operations in the United States in 2001 and in 2011.
Geographic reference: United States
Year: 2001 and 2011
Market size: $47.5 million and $1.33 billion respectively
Source: Thomas P. Dolley, “Silica [Advanced Release]” Tables 1 and 6, 2011 Minerals Yearbook, March 2013, pages 66.1-66.10, USGS, available in PDF format here. Data from Tables 1 and 6 of the Silica chapter of each annual Minerals Yearbook from 2000 through 2010 were used and may be accessed at the USGS web site here.
Original source: U.S. Department of the Interior, U.S. Geological Survey (USGS)
Posted on January 31, 2014