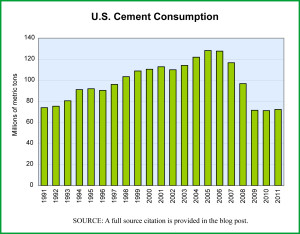
The recession of 2007-2009 was deep and hit many sectors hard. The construction sector was one of the hardest hit and all the suppliers to it have been struggling to find enough stability to weather the downturn which has yet to turn around. But even knowing these facts, we were surprised by the stunningly severe downturns seen in the Spanish cement industry since 2007—as reported in the last post. It made us wonder how the U.S. cement industry has fared during the same period. The graph here charts U.S. cement consumption for a similar time period as the one in our last post on Spain.
The differences in these charts are very interesting and very telling. In the United States, the build up in consumption during the housing boom was strong but not nearly as sharp as the build up in Spain. The declines in both countries were sharp and abrupt as the housing bubble burst and the banking crisis began. However, in Spain, the post-2007 decline was sharper, more like a fall from a cliff and it has continued to fall sharply since whereas in the United States the decline leveled off in 2009 and 2010 and actually showed signs in 2011 of possibly beginning to recover, if only slightly.
Today’s market size post shows the overall value of cement sales—portland and masonry cement—in the United States in 2006 and 2011.
Geographic reference: United States
Year: 2006 and 2011
Market size: $12.6 billion and $6.6 billion respectively
Source: “Cement – Statistics and Information,” Mineral Industry Survey, a series of reports produced by the U.S. Geological Survey, made available online and last updated on May 25, 2011. Here is a link to the USGS site.
Original source: U.S. Department of the Interior
Posted on May 29, 2012

