Boat Dealers

Boat dealers
Source: County Business Patterns
Geographic reference: United States
Year: 1998, 2008, 2018
Market size: 5,219, 5,500, and 4,178, respectively

Each year approximately 141 million people in the United States go boating. With summer winding down and Labor Day past, many may be getting ready to put their boats in storage for the winter, while others may be dreaming of next summer and being out on the water in a newly-purchased watercraft of their own. Today’s market size shows the number of boat dealers in the United States in 1998, 2008, and 2018.1 Dealers sell new and used boats, boat motors, and trailers. Some dealers also offer replacement parts and repair services. 

Sales of boats, marine products, and services totaled $42 billion in 2019. This same year, 11,878,542 recreational vessels were registered in the United States, up slightly from 2018. These numbers are expected to be significantly higher in 2020 as sales of new boats increased by 75% from the previous year. With many people canceling their summer vacations and children’s summer camps staying closed due to COVID-19, some chose to spend the money they would’ve spent on these activities on a boat instead. According to Ellen Bradley of the National Marine Manufacturers Association, “people are realizing it is a safe environment for social distancing. [They] are in an environment where [they] can control what [they] encounter, who [they] go boating with.” In some cases, however, demand was outpacing production, as several boat manufacturers shut down either temporarily or permanently in March as a result of the effects of the stay-at-home orders imposed by many state governments. Ninety-five percent of boats sold in the United States are made in the U.S. According to Boating Industry, the top 10 dealers in the United States for 2019 were Quality Boats of Clearwater Inc., M & P Mercury Sales Ltd., Marine Connection, Regal & Nautique of Orlando, BMC Boats, Irwin Marine – NH, Marine Sales Group Inc., Futrell Marine, Hampton Watercraft & Marine, and Buckeye Sports Center.

1 According to a report by Dun & Bradstreet First Research, the number of boat dealers totaled about 4,300 in 2020.

Sources: County Business Patterns, U.S. Census Bureau, various years available online here; “U.S. Boat Sales Reached Second Highest Volume in 12 Years in 2019, Expected to Remain Strong in 2020,” Business Wire, January 7, 2020 available online here; “Exerpt from Boat Dealers Industry Profile,” Dun & Bradstreet First Research, June 22, 2020 available online here; “Recreational Boating: An American Pastime & Economic Engine,” National Marine Manufacturers Association available online here; “Boat Sales Have Increased by 75 Percent in 2020 as Consumers Seek Ways to Enjoy Summer,” WJLA, July 3, 2020 available online here; “Top 100 Dealers,” Boating Industry, December 2019 available online here; 2019 Recreational Boating Statistics, U.S. Department of Homeland Security, U.S. Coast Guard, Office of Auxiliary and Boating Safety, June 4, 2020 available online here; Ed Killer, “Coronavirus: One of Florida’s Largest Boat Builders Shutters as Sales Plunge Amid COVID-19; 500 Out of Work,” TCPalm, April 2, 2020 available online here.
Image source: Created in house from County Business Pattern data.

Shared Micromobility

micromobility e-scooters

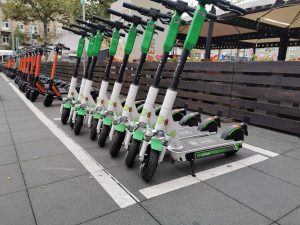
Shared micromobility systems are fleets of rentable lightweight one-passenger vehicles used mostly for utilitarian purposes. Riders use a smartphone app to unlock and rent vehicles. In cities where shared micromobility systems exist electric scooters (e-scooters), bicycles, and electric pedal-assisted bicycles (e-bikes) are the primary vehicles in use. When micromobility services were first offered, vehicles were docked. There were dedicated places where the vehicles were to be picked up or dropped off. More recently, companies have implemented a dockless model. Vehicles can be left anywhere or anywhere within a geofenced area as long as they do not impede pedestrian and motor vehicle traffic.

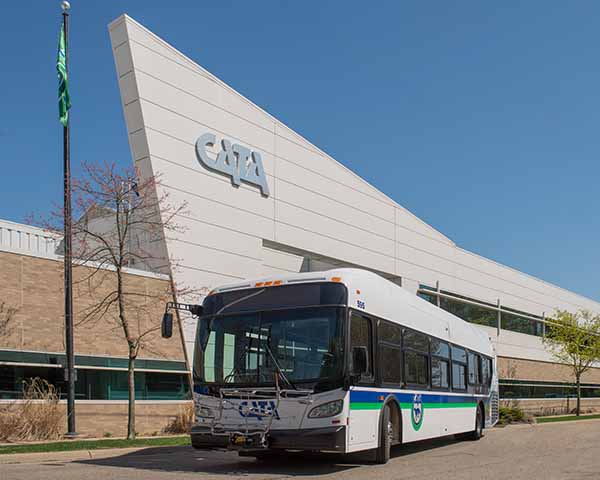
While some cities have embraced micromobility services as part of their overall transportation plan others have banned such services outright. For those that have allowed e-scooters and bicycle sharing systems in their city, these services are seen as a way to reduce traffic congestion and vehicle emissions. More than half the car trips in the United States are 5 miles or less. According to a study by the Portland Bureau of Transportation, had e-scooters not been available in Portland, Oregon, 34% of residents and 48% of tourists who have used this mode of transportation said that they would’ve taken a car, taxi or ride-haling service to their destination. For those who do not have a car and who may not live near public transportation, shared micromobility services allow them to get to and from their home, shopping and workplace easier by using these modes of transportation as a way to get to and from public transportation stops. But, these services may also be a replacement for public transportation for some riders. The average trip lengths for rail, bus and streetcar transportation are 4.9, 3.8 and 2.0 miles, respectively.1 Distances that can easily be traversed with a bicycle or e-scooter. And, while lower ridership on public transportation is a concern for some cities that have banned or strictly regulated shared micromobility solutions, especially e-scooters, the bigger concern is with public safety.2 Where bike lanes are unavailable, riders are more likely to share sidewalks with pedestrians. This presents a possible danger for pedestrians as well as e-scooter riders as these vehicles can travel up to 15 miles per hour. The danger for the e-scooter rider or e-bike rider if sharing the road with cars and trucks is even greater. Injuries due to inexperienced riders, uneven riding surfaces, nighttime use, and malfunctioning equipment are also concerning to city administrators. According to Consumer Reports, from the fall of 2017 to June 2019, there were 1,500 injuries3 to riders of rentable e-scooters and 8 deaths. 

Today’s market size shows the number of trips taken on shared micromobility vehicles in 2010, 2014 and 2018 in the United States. From 2017 to 2018 the total number of trips taken more than doubled from 35 million in 2017 to 84 million in 2018. Nearly all of this increase was due to e-scooter use. In fact, the number of e-scooter trips surpassed the number of station-based bike-share trips that year. Trips taken on shared e-scooters totaled 38.5 million, followed by station-based shared bicycles (36.5 million), e-bikes (6.5 million) and dockless shared bicycles (3 million). By the end of 2018, there were 85,000 e-scooters in use in 100 cities around the U.S. Station-based bikes numbered 57,000. Meanwhile, dockless bicycle-sharing all but disappeared. Seattle was the only city to still offer this service at the end of 2018. Despite the popularity of e-scooters overall, in 2019 both Lyft and Uber (JUMP brand) took their e-scooters off the streets of several cities due to lack of profitability and tightening regulations. Lyft reported they would refocus their e-scooter sharing operations in markets where population density is the greatest. Other leading e-scooter rental companies operating in the United States include Lime, Bird, Skip, Spin, and Scoot. Leading station-based bike-share systems by ridership include Citi Bike NYC (New York, NY), Capital Bike Share (Washington, D.C.), Divvy (Chicago, Ilinois), Ford GoBike (Bay Area, California), Bluebikes (Greater Boston area, Massachusetts), and Biki (Honolulu, Hawaii). In 2018, 84% of all station-based bike-share rides in the United States were concentrated in these 6 cities. That same year, 40% of all e-scooter rides were concentrated in Los Angeles, California; San Diego, California; and Austin, Texas.

1 Includes both heavy rail and light rail but not commuter rail.
2 Other concerns involve the dockless e-scooters and bikes being left on city sidewalks impeding pedestrians and the disabled. Some cities have imposed restrictions on the use of these vehicles in order to address the concerns.
3 Injuries in which the rider went to the hospital. Data from 110 hospitals in 47 cities.

Geographic reference: United States
Year: 2010, 2014 and 2018
Market size: 0.3 million, 18 million and 84 million, respectively
Sources: George Paul, “Lyft Will End E-Scooter Operations in 6 Cities and Lay Off Around 20 Staff Members,” Business Insider, November 18, 2019 available online here; Rasheq Zarif, Derek Pankratz, and Ben Kelman, “Small is Beautiful,” Deloitte Insights, April 15, 2019 available online here; “Micromobility,” Wikipedia, December 17, 2019 available online here; “Shared Micromobility in the U.S.: 2018,” National Association of City Transportation Officials, April 2019 available online here; Greg Gardner, “Nashville Mayor Proposed E-Scooter Ban; Then Council Changed the Rules,” Forbes, September 16, 2019 available online here; 2019 Public Transportation Factbook, American Public Transportation Association, April 2019 available online here; 2018 E-Scooter Findings Report, Portland Bureau of Transportation, January 15, 2019 available online here; Megan Rose Dickey, “JUMP Pulled Its Bikes From a Number of Markets in the Last Few Months,” Tech Crunch, September 13, 2019 available online here; Megan Rose Dickey, “Lyft is Ceasing Scooter Operations in Six Cities and Laying Off 20 Employees,” Tech Crunch, November 14, 2019 available online here; Adeyemi Ajao, “Electric Scooters and Micromobility: Here’s Everything You Need to Know,” Forbes, February 1, 2019 available online here.
Original source: National Association of City Transportation Officials.
Image source: Christian Bueltemann, “e-scooter-escooter-electric-scooter-4496668,” Pixabay, October 2019 available online here. Use of image does not constitute an endorsement.

Livery Cabs in New York City

taxicab

In New York, mobility options for people who do not own a car include the subway, busses, Yellow taxis, Green taxis,1 ride-hailing services, and livery cabs. Unlike other taxicabs, livery cabs are not authorized to pick up customers who hail them in the street. Customers must call a livery cab base station to book a ride. Many of the base stations are in the outer-boroughs and low-income areas of New York where public transportation options are sparse. Many stations are owned by Latino immigrants and owners and drivers live in the neighborhoods they serve. Dispatchers in some cases are multilingual. Many customers feel more comfortable calling for a ride from these services, from people they have known for years and who speak their native language. According to Cira Angeles, spokesperson for the Livery Base Owners Association, livery cabs continue to be an integral part of Latino neighborhoods.

However, in recent years, fewer livery cab bases are able to stay in business. Today’s market size shows the number of livery cabs in New York City in 2015 and 2019. More than 100 livery cab bases have gone out of business since 2015; 46 in 2019 alone. According to owners of these types of businesses, caps on the number of licenses, while meant to reduce traffic congestion and keep salaries high by limiting competition, make it harder for them to replace retiring drivers and drivers whose licenses cannot be renewed due to outstanding tickets. Also, more bookings through ride-hailing apps coincide with fewer calls to livery cab bases. Livery cabs are not the only types of transportation services to see fewer riders as a result of ride-hailing services, however.2 From October 2015 to August 2019,3 rides per day increased by nearly 300% for ride-hailing services but dropped 75.5% for Green taxis, 57.6% for livery cabs, and 51% for Yellow taxis. In October 2015, Yellow taxis completed more than 397,000 trips per day; ride-hailing services, 163,168; livery cabs, 91,496; and Green taxis, 52,598. By August 2019, ride-hailing services topped 648,000 trips per day. Yellow taxis completed 194,798 trips per day; livery cabs, 38,815; and Green taxis, 12,866.

1 Green taxis, also known as boro taxis, are types of livery cabs that operate in northern Manhattan and the boroughs outside of Manhattan. They are authorized to pick up customers who hail them in the street. Customers may also call their livery cab base to arrange a ride over the phone. In addition, as part of a two year pilot program that started in 2018, customers can use an app to book a ride.
2 Ride-hailing companies include Uber, Lyft, Juno and Via.
3 August 2019 was the most recent month in which livery cab data were reported by the New York City Taxi and Limousine Commission.

Geographic reference: New York, New York
Year: 2015 and 2019
Market size: 22,000 and 9,600
Sources: Claudia Torrens, “In Ride-Hail Boom, Livery Cabs Feel Squeezed,” The Denver Post, December 29, 2019, p. 2K; “Taxi and Ridehailing Usage in New York City,” available online here; “Aggregated Reports,” New York City Taxi and Limousine Commission available online here; “Taxicabs of New York City,” Wikipedia, January 1, 2020 available online here; “You Can Hail NYC Green Cabs With an App,” Fox 5 New York, September 25, 2018 available online here.
Original Source: New York City Taxi and Limousine Commission
Image source: Pexels, “automobile-automotive-blur-car-1845650,” Pixabay, November 21, 2016 available online here

Moving Services

Have you moved to a new residence in the past year? If you have, you’re not alone. According to the U.S. Census Bureau, nearly 32.4 million people changed residences from 2017 to 2018. While this might seem like a high number, as a percentage of the total population, it’s the lowest it has been in at least 70 years. From 1948 through the mid-1960s, the percentage of the population who moved during the year stayed steady around 20%, then declined from the mid-1960s to the 1980s, spiking briefly to 20.2% in 1984-1985. Since then the percentage of movers has trended downward, reaching 10.1% in 2017-2018. Most were interstate moves, 60.51%, but this was down from 65.51% a year earlier. According to the U.S. Census Bureau’s Current Population Survey, most people move to establish a new household or for other family reasons.1 Moving due to a new job or job transfer ranked third.

Today’s market size shows the total revenues for moving services in the United States. Companies in this industry transport used household, institutional, or commercial furniture and equipment via local or long-distance truck, as well as provide related packing and storage services. Various sources provide a wide range of total revenue figures. The American Moving and Storage Association states that annual revenues in this industry total $12.6 billion. IBISWorld reports revenues of $17.9 billion in 2019. The figure stated below is from Dun & Bradstreet. Nearly 70% of the revenue results from local and long-distance transportation services, followed by warehousing and storage services (20.2%). Packing and packaging services account for 7.5% of the total. Leading companies in this industry include UniGroup, which owns United Van Lines and Mayflower Transit; SIRVA, which owns Allied Van Lines and northAmerican Moving Services; and Atlas Van Lines. However, nearly 50% of companies in this industry are small businesses, employing fewer than 5 people. Only 8.5% of companies employ 100 people or more.

1 Other family reasons unrelated to establishing a new household or change in marital status. Change in marital status ranked fifth after moving to be closer to a job.

Geographic reference: United States
Year: 2019
Market size: $15 billion
Sources: “Moving Services Industry Profile,” Dun & Bradstreet First Research, June 3, 2019 available online here; “CPS Historical Migration/Geographic Mobility Tables,” U.S. Census Bureau, November 27, 2018 available online here; “About Our Industry,” American Moving and Storage Association available online here; Michael C., “Moving Trends & Relocation Industry Analysis,” Movers Development, May 10, 2019 available online here; “Moving Services Industry Insights From D&B Hoovers,” D&B Hoovers available online here; “Moving Services Industry in the US – Market Research Report,” IBISWorld, July 2019 available online here.
Image source: Clker-Free-Vector-Images, “movers-packing-box-light-vase-24403,” Pixabay, April 3, 2012 available online here.

Recreational Vehicles

Recreational vehicle

With Spring right around the corner and summer not far behind, have you been thinking about taking a vacation? Do your daydreams of a relaxing getaway include camping? If so, you are not alone. More than 77 million households in the United States include someone who enjoys this activity.

Most campers use tents but nearly one-quarter prefer the safety and comfort of a recreational vehicle, or RV. While a large percentage either borrow or rent their motorhome or towable camper, 56% own theirs. Just a few years ago, in 2014, a majority of people who camped using RVs were baby boomers or older. By 2017, 70% of RV campers were Millenials and Generation Xers. RV manufacturers are taking notice. The recreational vehicles of today are not the rustic accommodations of yesteryear. Newer models are equipped with solar panels, USB ports, entertainment systems, and wi-fi signal boosters.

Today’s market size shows the total wholesale shipments of RVs in the United States in 1998, 2008, and 2018. Leading manufacturers include Thor Industries, Forest River, and Winnebago Industries. Ford Motor Co. makes the chassis, engines, and transmissions for most of the motorhomes in the United States. By state, the highest percentage of recreational vehicles were shipped to Texas, followed by California and Florida. Ohio and Michigan tied for fourth.

Shipments for 2018 were down from a high of 504,600 in 2017. They are forecast to drop farther in 2019. According to Frank Hugelmeyer, President of the RV Industry Association, “slowing sales were inevitable due in part to the fact that so many Americans have bought RVs over the past decade.” Another factor may be RV prices. They are expected to climb due to increases in the cost of raw materials and components, such as microwaves, stoves, and lighting as a result of the tariffs imposed on goods from China and Canada. While 83% of recreational vehicles are manufactured in Indiana, many of the components are imported from other countries.

Geographic reference: United States
Year: 1998, 2008 and 2018
Market size: 292,700, 237,000 and 483,700, respectively
Sources: Trevor Hughes, “Youth Movement Is Driving RVs,” USA Today for the Lansing State Journal, January 28, 2019, pages 1B and 2B; “Addition of 6 Million New North American Campers Since 2014 Showcases Continued Popularity of Camping,” The National RV Dealers Association News Release, April 11, 2018 available online here; The 2018 North American Camping Report, Kampgrounds of America, Inc. available online here; RV Industry Association Staff, “RV Industry Association’s 2017 Profile Now Available,” RV Industry Association, June 6, 2018 available online here; “Historical RV Data,” RV Industry Association available online here; Dale Buss, “RV Sales Boom Is Fueled By Millenials as They Overturn Stereotypes and Enjoy The Itinerant Life,” Forbes, December 29, 2017 available online here; Peter Valdes-Dapena, “RVs Are Back and Bigger Than Ever,” CNN Business July 12, 2017 available online here.
Image source: Airstream Inc., “Airstream Travel Trailer in Nature,” Unsplash, October 2, 2018 available online here. Use of image does not constitute endorsement.

Auto Industry Economic Impact

auto industry camaroGeneral Motors’ announcement of the 2019 closing of assembly plants in North America created uncertainty for 14,000 families in Michigan, Ohio, Maryland and Oshawa, Ontario, Canada. These 14,000, both blue-collar and white-collar workers alike, are direct employees of General Motors. But sadness and uncertainty reverberated throughout many industries. According to the Center for Automotive Research, in the United States, more than 7 million private sector jobs are supported by the auto industry. Steel mills, logistics companies, grocery stores, restaurants, gas stations, and child care centers are just some of the businesses negatively impacted by plant shutdowns and layoffs,1 as automotive companies buy fewer supplies and services and workers cut back on expenses. Businesses in close proximity to auto plants, those that rely on workers spending money in their stores and restaurants, are more heavily impacted than some when plants close.

Today’s market size shows the amount of annual compensation of employees working in industries supported by the auto industry in the United States. In 2014, the last year for which data are available, 570,000 jobs were supported by the auto industry in Michigan, where auto industry employment accounts for more than 11% of the labor force.

1 According to General Motors, some of the workers that will be laid off at General Motors’ plants will be offered jobs at other manufacturing facilities either in Michigan or in another state.

Geographic reference: United States
Year: 2018
Market size: $500 billion
Sources: Eric D. Lawrence, “Pain of GM Closures Is Far-Reaching,” Lansing State Journal, December 3, 2018, page 6A; Jamie L. LaReau, “General Motors to Close Detroit, Ohio, Canada Plants,” Detroit Free Press, November 26, 2018 available online here.
Original source: Center for Automotive Research
Image source: AnSICHThoch3, “auto-chevrolet-camaro-road-1112183,” Pixabay, January 2, 2016 available online here. Use of image does not constitute endorsement.

Public Transportation in the Lansing, Michigan Area

Public TransportationThe Capital Area Transportation Authority (CATA) is the largest public transit provider in the tri-county area around Lansing, Michigan. The tri-county area consists of Ingham, Clinton, and Eaton counties. CATA has been operating public transportation in the mid-Michigan area since 1972 and has been twice named the best transit system of its size in North America by the American Public Transportation Association.

Ridership grew steadily during the 1970s, before leveling off during the 1980s and most of the 1990s. During the 1980s and 1990s, the number of rides fluctuated around 3-4 million annually. In 1999, CATA took over the Michigan State University bus service. Since then ridership has increased nearly 3-fold. In contrast, the population of the tri-county area grew by 22.6% from 1970 to 2010.

In 2013, CATA set a fourth consecutive yearly record for number of rides. By 2014, however, ridership was down overall despite seeing increased ridership on its Michigan State University routes and increased requests for its paratransit services. In the fourth quarter of 2014, gasoline prices fell which could account for the decreased ridership. Bus ridership both nationally and locally continued to decline in 2017. Nationally bus ridership dropped by 4.3 percent in 2017. CATA saw a ridership decline of 6.0 percent overall that same year.

According to the American Public Transportation Association, several factors contributed to the multi-year decline in bus ridership overall. Gas prices remained low and the ability to obtain car loans, including sub-prime car loans for those with poor credit, became easier. More employees are working from home. In 2016, 66% of employers allowed some of their employees to work from home occasionally; 40% allowed some employees to work regularly from home, a drastic change from a decade ago. The use of transportation network companies such as Uber and Lyft along with bike-sharing services and biking, in general, have become more popular. Customers who employ these services may find them more convenient to use, allowing them to get to their destination sooner than if they would take public transportation.

In response to the increased popularity of bike-sharing across the country, CATA partnered with Michigan State University and the cities of Lansing, East Lansing and Meridian Township to study the feasibility of bike-sharing programs in the region in 2018. Bike-sharing is one way of meeting a commuter’s need for transportation to and from a bus stop or transit facility in order to more easily access the public transportation system.

Today’s market size represents the number of rides annually on CATA vehicles in 1972 and 2017.

Geographic reference: Lansing, Michigan area
Year: 1972 and 2017
Market size: Less than 1 million rides and 10.2 million rides respectively
Sources: Pam Latka, “Fiscal 2017 Ridership Closes at 10.2 Million,” CATA Drives: 2018 Community Report, September 2018, page 5; Understanding Recent Ridership Changes, American Public Transportation Association, April 2018 available online here; “National Trend Leaves Its Mark on Ridership,” CATA 2016 Community Report, June 2016, page 3; “Ridership Trends Vary by Service Type,” CATA 2015 Community Report: Where Public Transportation Goes Community Grows, June 2015, page 3; “Passenger Trips Reflect Stable Demand,” CATA 2014 Community Report: Moving You Forward With Pride, June 2014, page 3; “Growth in Ridership Remains Strong,” CATA 2013 Community Report: Moving You Toward Your Dreams, June 2013, page 4; “Riding High with Record Ridership,” CATA 2012 Community Report 40th Anniversary Edition: Greater Lansing on the Move, August 2012; “CATA Demand Grows with Community Need,” CATA 2011 Community Report: Greater Lansing on the Move, August 2011; Tri-County Regional Planning Commission, “Tri-County Regional Growth: Choices for Our Future,” Draft Report, August 2002 available online here; “Ingham County, Michigan” available online here; “Clinton County, Michigan” available online here; and “Eaton County, Michigan” available online here.
Image source: “CATA Administrative Offices,” available online here. No copyright infringement intended.

Train Batteries

train

Steel Rails, chasing sunshine ’round the bend

Winding through the trees like a ribbon in the wind

I don’t mind not knowing what lies down the track

‘Cause I’m looking out ahead

To keep my mind from turning back

— Chorus from the song “Steel Rails” by Louisa Branscomb

Worldwide, passengers traveled a total of 3.7 trillion kilometers by train in 2016. That same year, more than 9.9 trillion tonne kilometers of freight were shipped. The vast majority of passenger kilometers traveled, 80%, were in Asia and Oceania1; the fewest were in America, which includes both the United States and Canada. Two regions were nearly evenly split on the percentage of tonne kilometers of freight shipped by rail: Asia and Oceania with 37% and America with 31%. The Russian Federation followed with 23%. A total of 1.1 million rail lines allow for the transport of passengers and freight worldwide, more than a third of which are in America, followed by Asia and Oceania (28%) and Europe (24%).2

Whether a train is transporting passengers or freight, all use batteries either as backup power, for engine starting, as storage systems to capture energy recovered from braking or to power the trains themselves. Today’s market size shows the estimated sales of train batteries in 2018 and projected for 2025. The market is expected to grow at a compounded annual growth rate of 5.15% during this time period as more people around the world become dependent on rail transport.

Currently, lead-acid batteries are the predominate battery used in rolling stock, but as lithium-ion batteries become more economical and efficient and demand for maintenance-free batteries increases, they are expected to be the type of battery most used by the end of this time period. In the future, demand for environmentally-friendly bullet trains and autonomous trains with advanced features such as automated doors, infotainment systems, and passenger information systems will spur sales of train batteries as these types of trains require significantly more power.

1 Excludes Russia and Turkey
2 Includes Turkey

Geographic reference: World
Year: 2018 and 2025
Market size: $470.5 million and $703.2 million, respectively
Sources: “From a Market Size of USD 470.5 million in 2018, The Train Battery Market is Projected to Reach USD 703.2 Million by 2025, at a CAGR of 5.15%,” Cison PR Newswire, October 18, 2018 available online here; “Rail Transport in the World,” International Union of Railways, September 7, 2018 available online here; Fred Lambert, “Bombardier Unveils a New Battery Powered Train,” Electrek, September 14, 2018 available online here; “Rail,” available online here; and “Wayside Energy Storage Systems,” available online here.
Image source: axiepix, “train-tracks-winter-snow-trees-613386,” Pixabay, January 27, 2015 available online here.

Public Transportation in the Lansing, Michigan Area

The Capital Area Transit Authority (CATA) is the largest public transit provider in the tri-county area around Lansing, Michigan. The tri-county area consists of Ingham, Clinton, and Eaton counties. CATA has been operating public transportation in the mid-Michigan area since 1972 and has been twice named the best transit system of its size in North America by the American Public Transportation Association.

Ridership grew steadily during the 1970s, before leveling off during the 1980s and most of the 1990s. During the 1980s and 1990s, the number of rides fluctuated around 3-4 million annually. In 1999, CATA took over the Michigan State University bus service. Since then ridership has increased nearly 3-fold. In contrast, the population of the tri-county area grew by 22.6% from 1970 to 2010.

In 2013, CATA set a fourth consecutive yearly record for number of rides. By 2014, however, ridership was down overall despite seeing increased ridership on its Michigan State University routes and increased requests for its paratransit services. In the fourth quarter of 2014, gasoline prices fell which could account for the decreased ridership. Gasoline prices remained low in 2016. Bus ridership both nationally and locally continued to decline in 2016. According to the American Public Transporation Association, nationally bus ridership dropped by almost 3 percent in 2016. CATA saw a ridership decline of 4.6 percent overall that same year. However, CATA saw ridership on its Michigan State University and some of its Redi-Ride and paratransit routes increase by double-digits in 2016.

Today’s market size represents the number of rides annually on CATA vehicles in 1972 and 2016.

Geographic reference: Lansing, Michigan area
Year: 1972 and 2016
Market size: Less than 1 million rides and 10.9 million rides respectively
Sources: “Ridership Mirrors National Trend”, CATA 2017 Community Report, June 2017, page 4; “National Trend Leaves Its Mark on Ridership,” CATA 2016 Community Report, June 2016, page 3; “Ridership Trends Vary by Service Type”, CATA 2015 Community Report: Where Public Transportation Goes Community Grows, June 2015, page 3; “Passenger Trips Reflect Stable Demand”, CATA 2014 Community Report: Moving You Forward With Pride, June 2014, page 3; “Growth in Ridership Remains Strong”, CATA 2013 Community Report: Moving You Toward Your Dreams, June 2013, page 4; “Riding High with Record Ridership,” CATA 2012 Community Report 40th Anniversary Edition: Greater Lansing on the Move, August 2012; “CATA Demand Grows with Community Need,” CATA 2011 Community Report: Greater Lansing on the Move, August 2011; Tri-County Regional Planning Commission, “Tri-County Regional Growth: Choices for Our Future,” Draft Report, August 2002 available online here; “Ingham County, Michigan” available online here; “Clinton County, Michigan” available online here; and “Eaton County, Michigan” available online here.

Alternative-Fuel Vehicles

When one thinks of alternative fuels for vehicles, one might think of diesel, ethanol, or even compressed natural gas, but recently vehicles running on propane have entered the market. According to Todd Mouw, vice president of sales and marketing for Roush CleanTech, a manufacturer of engines that run on propane, propane is “… cleaner than gasoline and diesel. We have a lot of it (in the U.S.) and … it’s easy to integrate into a Ford truck or school bus.” In fact, all three major school bus manufacturers in the United States offer propane-powered school buses to school districts.

Today’s market size is the number of propane-powered vehicles on the road. In comparison, we also include the number of vehicles on the road powered by compressed natural gas.

Geographic reference: United States
Year: 2016
Market size: More than 143,000 propane-powered vehicles
Market size: Approximately 153,000 compressed natural gas powered vehicles
Source: Snavely, Brent, “Alternative-Fuel Buses Carry Roush,” Lansing State Journal, January 8, 2017, page 18A
Original source: Roush CleanTech and Natural Gas Vehicles for America

Moving Day

Bar Chart

Today we are looking at the number of people who make a residential move in the United States each year. This is a measure of geographical mobility and has been tracked by the U.S. Census Bureau annually for decades. Using their data we produced a graph showing the annual percent of the U.S. population aged one year or more that moved from one place to another each year.

Americans think of themselves as a very mobile people, both in terms of economic mobility as well as actual, physical mobility. And yet, in truth, we are less mobile than we were in the past. As the data in the graph show, we actually move far less often now than in the past. The trend is towards fewer moves and moves of shorter distance.

There are many reasons for this change, from an aging population to less regional diversity in the growing service industries than existed in the manufacturing sector. An increasing use of occupational licensing practices and a declining rate of job changing in the United States also contribute to this change. (Yes, contrary to popular thought, we actually change jobs more infrequently than in the past.)

Some analysts see the declining rate of geographical mobility in the United States as one of the reasons behind a declining rate of productivity growth. Others see it as just another consequence of decreased median income growth. What is clear is the fact that we are staying put at much higher rates now than we did thirty years ago.

For those interested in reading more about this topic, we provide a link to further reading about it under the source note below.

Geographic reference: United States
Year: 1976 and 2016
Market size: 36.8 million (17.7% of the population) and 35.1 million (11.2%)
Source: “Table A-1. Annual Geographical Mobility Rates, By Type of Movement: 1948-2016,” Current Population Survey, Historical Migration/Geographic Mobility Tables, November 15, 2016, available here.
Original source: U.S. Department of Commerce.
Further reading: Tyler Cowen, “The Unseen Threat to America: We Don’t Leave Our Hometowns,” Time, February 22, 2017, available online here.

Bicycle Accessory Market in the United Kingdom

In 2015 there were 15.8 million bicyclists in the United Kingdom. In urban areas cycling has become a convenient and environmentally-friendly alternative to other forms of transportation. Recently more and more professionals are using their bicycles to commute to work. Since 2010 the market for accessories has grown faster than the market for bicycles themselves—28 percent and 23 percent, respectively.

Today’s market size shows the value of the bicycle accessory market, which includes parts, accessories, and clothing, in the United Kingdom for 2014. That same year the market for bicycles was valued at £956 million.

Geographic reference: United Kingdom
Year: 2014
Market size: £1.25 billion
Source: Graham, Luke, “Chain Reaction: Cycling Gets a Luxury Pricetag,” CNBC, July 31, 2015 available online here.
Original source: Mintel

Public Transportation in the Lansing, Michigan Area

The Capital Area Transit Authority (CATA) is the largest public transit provider in the tri-county area around Lansing, Michigan. The tri-county area consists of Ingham, Clinton, and Eaton counties. CATA has been operating public transportation in the mid-Michigan area since 1972 and has been twice named the best transit system of its size in North America by the American Public Transportation Association.

Ridership grew steadily during the 1970s, before leveling off during the 1980s and most of the 1990s. During the 1980s and 1990s, the number of rides fluctuated around 3-4 million annually. In 1999, CATA took over the Michigan State University bus service. Since then ridership has increased nearly 3-fold. In contrast, the population of the tri-county area grew by 22.6% from 1970 to 2010.

In 2013, CATA set a fourth consecutive yearly record for number of rides. By 2014, however, ridership was down overall despite seeing increased ridership on its Michigan State University routes and increased requests for its paratransit services. In the fourth quarter of 2014, gasoline prices fell which could account for the decreased ridership. Gasoline prices remained low in 2015. Nationally, according to the American Public Transportation Association, total passenger trips declined by 3.5 percent from October 2015 to December 2015. CATA reported a 1 percent decline in ridership in 2015 relative to the close of 2014.

Today’s market size represents the number of rides annually on CATA vehicles in 1972 and 2015.

Geographic reference: Lansing, Michigan area
Year: 1972 and 2015
Market size: Less than 1 million rides and 11.43 million rides respectively
Sources: “National Trend Leaves Its Mark on Ridership,” CATA 2016 Community Report, June 2016, page 3; “Ridership Trends Vary by Service Type”, CATA 2015 Community Report: Where Public Transportation Goes Community Grows, June 2015, page 3; “Passenger Trips Reflect Stable Demand”, CATA 2014 Community Report: Moving You Forward With Pride, June 2014, page 3; “Growth in Ridership Remains Strong”, CATA 2013 Community Report: Moving You Toward Your Dreams, June 2013, page 4; “Riding High with Record Ridership,” CATA 2012 Community Report 40th Anniversary Edition: Greater Lansing on the Move, August 2012; “CATA Demand Grows with Community Need,” CATA 2011 Community Report: Greater Lansing on the Move, August 2011; Tri-County Regional Planning Commission, “Tri-County Regional Growth: Choices for Our Future,” Draft Report, August 2002 available online here; “Ingham County, Michigan” available online here; “Clinton County, Michigan” available online here; and “Eaton County, Michigan” available online here.

Used Cars in China

The auto market in China, like most markets, is growing rapidly. Demand for cars has been growing annually as the purchasing power of millions of Chinese people increases as that country becomes an economic powerhouse. But because the mass market for automobiles in China is relatively new—having taken off in earnest starting four or five years ago, according to the first source listed below—a used car market is an even newer thing in China. It takes, on average, four years for a new car to be traded in for an “upgrade” and thus become available for resale as a used car.

Today’s market size is the estimated number of used cars sold in China in 2012 as well as a forecast for the number of used cars that will be sold in 2016 and 2020. For comparison purposes, let us point out that in the United States in 2012, used car sales were nearly three times greater than new car sales whereas in China, used car sales were only one-third the number of new car sales. The used car market in China is very young, with lots of room to grow.

Geographic reference: China
Year: 2012 and forecasts for 2016 and 2020
Market size: 4.8, 10.0 and 20.0 million respectively
Sources: (1) Kelvin Chan, “Auto Sales Boom Spawns a Growing Used Car Market in China,” Detroit Free Press, November 27, 2013, available online here. (2) Cliff Atiyeh, Used-car Sales Climb as Americans Hold Onto Older Vehicles,” MSN.com, February 4, 2013, available online here.
Original source: Changan Ford, the U.S. company’s China joint venture
Posted on December 11, 2013

Roundabouts

Roundabout

Roundabouts are a road design used to replace a traditional four or six-way intersection, referred to as a crossroads intersection, with a circular path around which traffic flows, continuously, in one direction. The graphic provides an overview of such a roundabout.

For a driver not accustomed to this sort of intersection, a roundabout may be disconcerting at first. However, study after study shows that in the right locations roundabouts are an improvement over more traditional crossroad intersections in two ways: by increasing the flow of traffic and by reducing (by 76%) the number of injury-producing accidents. The reduction in accidents leading to fatalities in a roundabout versus a crossroad intersection is even greater since speeds are reduced throughout the intersection. According to the U.S. Department of Transportation, there are 90% fewer fatal accidents in crossroads intersections that have been replaced by roundabouts.

Today’s market size is the estimated number of roundabout intersections worldwide, in 1997 and in 2012.

Geographic reference: World
Year: 1997 and 2012
Market size: 35,000 and 60,000 respectively
Source: “The Widening Gyre,” The Economist, October 5, 2013, page 16. The graphic comes from a Michigan Department of Transportation website, here.
Original source: U.S. Department of Transportation
Posted on November 25, 2013

Bikes in Europe

EuroBikes

Bicycles outnumber automobiles in the world and always have. While bike commuting dominates in most of the developing world, it lags far behind in the industrialized centers of the world. But, this is changing, slowly. The industrial world is experiencing a rise in bicycle ridership—in Europe motivated in part by the severity of the recession and financial crisis that started in 2008—and spending on infrastructure supportive of bike commuting is on the rise.

The graph shows the number of bicycles and number of passenger cars sold annually in the 27 countries of the European Community between 2001 and 2012. While the sale of cars has fallen, the sale of bikes has been reasonably steady—despite a very serious recession—and ended the period higher than it began, with sales of 19.7 million units in 2012 versus 18.9 million in 2001.

Geographic reference: European Community
Year: 2012
Market size: 19.72 million bicycles (850,000 of these bikes were electric-assist bicycles, the segment of the market growing most quickly)
Sources: (1) European Bicycle Market, 2013 edition, Industry & Market Profile, October 2013, Association of the European Two-Wheeler Parts’ & Accessories’ Industry, page 18, available online here. (2) Martin Campestrini and Peter Mock, European Vehicle Market Statistics, Pocketbooks, 2011 Edition, ICCT, pages 39-48.
Original source: COLIBI, the Association of the European Bicycle Industry, COLIPED, the Association of the European Two-Wheeler Parts’ & Accessories’ Industry and the International Council on Clean Transportation (ICCT)
Posted on November 6, 2013

Commercial Airline Baggage Fees

One of the ways airlines have found to raise revenue, while remaining competitive in the electronic marketplace for airline fares, is to charge separately for some services that were traditionally covered in the ticket price, such as meals, seat selection, and baggage handling. While U.S. airline revenue from baggage fees went up at a rate of 17.23% per year from 2007 through 2012 overall operating income rose over the same period at a rate of 2.14% annually.

Today’s market size is the total amount charged by all U.S. commercial airlines, annually, for fees associated with the handling of baggage.

Geographic reference: United States
Year: 2007 and 2012
Market size: $464 million and $3.486 billion respectively
Source: Martha C. White, “Airlines Cash In on Every Inch, Even the Jammed Bins Overhead,” The New York Times, October 11, 2013, page 1, available online here.
Original source: U.S. Department of Transportation, Bureau of Transportation Statistics
Posted on October 14, 2013

Elevators & Escalators

Elevators and escalators are an almost invisible part of the infrastructure of large buildings, invisible only in that they are taken for granted by most of their users. For the industry involved in making and servicing these complex machines, invisibility may well be just fine, after all, when attention is drawn to them it is often for all the wrong reasons—slowness, jerkiness, and/or safety problems.

Leaders in this industry include Otis, Schindler, ThyssenKrupp and KONE, each representing around 20% of the world market. The areas of greatest growth in new installations are areas of the world that are seeing the largest increase in both urbanization and high-rise construction. Maintenance of existing machinery is a part of the business that is strongest in the well-established industrialized world and is an important part of this industry.

Today’s market size is the estimated number of new elevator and escalator installations around the world during 2012 as well as the installed base that year.

Geographic reference: World
Year: 2012
Market size: 670,000 new units added to a base of slightly over 11 million
Source: “Elevator and Escalator Market,” published in 2013 by KONE and available here with geographical breakdowns of the global market.
Original source: KONE
Posted on July 1, 2013

Public Transportation—Lansing, Michigan Area

The Capital Area Transit Authority (CATA), in Lansing, Michigan, is the largest public transit provider in the tri-county area near the State Capitol, which includes Ingham, Clinton, and Eaton counties. CATA has been operating public transportation in the mid-Michigan area since 1972 and has been twice named the best transit system of its size in North America by the American Public Transportation Association.

Ridership grew steadily during the 1970s, before leveling off during the 1980s and most of the 1990s. During the 1980s and 1990s, the number of rides fluctuated around 3 to 4 million annually. In 1999, CATA took over the Michigan State University bus service. Since then ridership has increased nearly 3-fold. In contrast, the population of the tri-county area grew by 22.6% from 1970 to 2010. In 2012, CATA set a third consecutive yearly record for number of rides. Data represent the number of rides annually on CATA vehicles in 1972 and 2012.

Geographic reference: Lansing, Michigan
Year: 1972 and 2012
Market size: Fewer than 1 million rides and 11.86 million rides respectively
Sources: “Growth in Ridership Remains Strong”, CATA 2013 Community Report: Moving You Toward Your Dreams, June 2013, p. 4; “Riding High with Record Ridership,” CATA 2012 Community Report 40th Anniversary Edition: Greater Lansing on the Move, August 2012; “CATA Demand Grows with Community Need,” CATA 2011 Community Report: Greater Lansing on the Move, August 2011; Tri-County Regional Planning Commission, “Tri-County Regional Growth: Choices for Our Future,” Draft Report, August 2002 available online here; “Ingham County, Michigan” available online here; “Clinton County, Michigan” available online here; and “Eaton County, Michigan” available online here;
Posted on June 26, 2013

Trucking Industry

Freight Transport by Mode Pie Chart

In the United States, trucks move more freight than do all the other forms of transportation combined and this is true when measured in terms of tons moved (68.2% in 2010) as well as in terms of the value of that freight (65.5%). The pie chart shows the percentage of total freight moved by each type of transportation vehicle, both in terms of weight and value. What is clear and quite logical is that the value of items moved by air is quite high but those items don’t weigh much. To move heavier freight, such as construction materials, heavy machinery, agricultural commodities, coal and the like, the nation’s highways, waterways and railways are the economical answer, and for the heaviest items, the latter two networks are the more economical.

Today’s market size is the weight of domestic freight moved by trucks in the United States last year and the revenue those movements produced for the trucking industry.

Geographic reference: United States
Year: 2012
Market size: 9.4 billion tons moved, generating $643 billion in revenue for the trucking industry
Source: Benjamin Preston, “Wheelies: The Stingray’s Stinger Edition,” Wheels.blogs.nytimes, May 30, 2013, available here. The data used to produce the graphic are from Freight Facts and Figures 2011, “Tables 2-1, 2-1M and 2-2.
Original Source: American Trucking Association and the U.S. Department of Transportation, Federal Highway Administration.
Posted on June 5, 2013