Electronics Stores

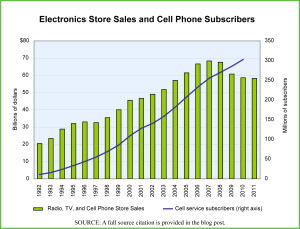
Our graph from Census Bureau data

While working on an analysis of the retail and wholesale sectors of the U.S. economy, a somewhat surprising thing emerged. The four fastest growing categories of brick-and-mortar stores, based on annual growth rates from 1992–2010 were: (1) Used Car Dealerships, (2) Health and Personal Care Stores, (3) Pharmacies and, (4) Radio, TV, and Other Electronics Stores. The last of these surprised us a bit, given the fact that such a large portion of the sale of electronics has moved online and the fact that the demise of a prominent player in the sector, Circuit City, seems pretty fresh in the mind.

As it turns out, the important trend behind the strength of this retail sector is the rise of cell phones and all the new cell phone stores that one sees in shopping centers and strip malls across the United States. Cell phone stores are part of the category “Radio, Television and Other Electronics Stores” (NAICS 443112), the fastest growing sector in the overall Electronics and Appliance Retail industry (NAICS 443).

The graph shows annual sales from Radio, TV, and Cell Phone Stores in the United States from 1992–2011 and cell phone subscription figures for the period 1992–2010.

Geographic reference: United States
Year: 1992 and 2011
Market size: $20.5 billion and $58.3 billion respectively
Source: Annual Retail Trade Survey 2010, with updates from the Monthly Retail Trade Report series, available online here. The cell phone subscriber data are from the Statistical Abstract of the United States 2012, Table 1149, available from here.
Original source: U.S. Department of Commerce, Bureau of the Census
Posted on August 21, 2012

Vitamin Sales

Today’s market size comes from a report about U.S. vitamin purchases published by a consumer analytics firm. The report goes into some detail about where people make purchases of vitamins and how that has been changing over the past few years.

Geographic reference: United States
Year: 2012
Market size: $12.2 billion
Source: “Vitamin Market Survey Sees Buyer Deficiency,” Progressive Grocer, August 3, 2012, available online here.
Original source: TABS Group
Posted on August 20, 2012

Furniture Stores

Furniture Stores sales, annually, graphed

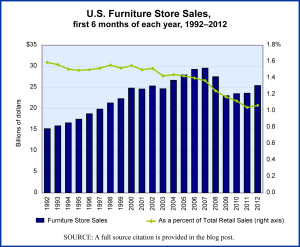
The sale of furniture—through furniture stores—in the United States has begun to recover from the significant hit it took as a result of the housing bubble collapse and the recession of 2007–2009. The graph we present here shows sales receipts for all furniture stores in the United States during the first six months of each year from 1992 through this year. The NAICS code (North American Industrial Classification System code) for furniture stores as measured here is 4421.

Geographic reference: United States
Year: 2007 and 2012 (first 6 months)
Market size: $29.6 billion and $25.4 billion respectively
Source: Annual Retail Trade Survey 2010, and updates from the Monthly Retail Trade Reports from the same reporting series, U.S. Census Bureau, available online here.
Original source: U.S. Department of Commerce, Bureau of the Census
Posted on August 17, 2012

Better Burger Restaurants

The better burger restaurant market is defined as establishments that make burgers to order with fresh ingredients, in particular, fresh meat. Examples of the sorts of restaurants that are counted as better burger restaurants include Red Robin Gourmet Burgers, Five Guys Burgers and Fries, and Bagger Dave’s.

Although the market for better burger restaurants is still minuscule compared to the $200 billion fast-food and fast-casual burger restaurant market, sales growth exceeded growth in the fast-food and fast-casual burger restaurant market in 2010. Sales growth for better burger restaurants was 21% compared to a 3.2% growth rate for fast-food and fast-casual burger restaurants. Better burgers are often made with fresh Angus beef, better-quality buns, premium cheeses, and homemade condiments. Some better burger restaurants also offer turkey burgers and veggie burgers. Data represent restaurant sales in 2011.

Geographic reference: United States
Year: 2011
Market Size: $2.2 billion
Source: Davis, Scott, “Building a Better Burger: Mid-Michigan Opens Wide for ‘Better Burger’ Market,” Lansing State Journal, August 12, 2012, page 1E
Original Source: Technomic
Posted on August 14, 2012

Motorized Bicycles

Ford Motor Company's eBike

Motorized bicycles can be pedaled as standard bicycles or they can be ridden with the use of a gasoline- or electric-powered engine. In 2011, Ford Motor Company introduced the E-Bike at the Frankfurt Motor Show. This bicycle has a lithium-ion battery similar to ones in newer hybrid and electric automobiles. Market share for motorized bicycles is increasing worldwide and expected to grow steadily through the 2010s.

Geographic reference: World
Year: 2010 and forecasted 2018
Market size: 30 million and 47 million units respectively with an estimated total revenue of $11.9 billion by 2018.
Source: Carrie Jones, “A Ford Bicycle,” My Ford, Spring 2012, page 9, and a report by Pike Research, “Annual Sales of Electric Bicycles Will Surpass 47 Million by 2018,” March 27, 2012, available online here. The picture comes from Ford’s media site, here.
Posted on August 7, 2012

Crop Insurance

The drought being experienced this year in most of the United States will have an impact on the cost of food in the not distant future. Farmers will have a difficult year, but how difficult? As it turns out, less than one might expect. Over the last decades there has been a significant increase in the use of crop insurance in the United States and an escalation of the subsidies received from the federal government to cover crop insurance premiums. In 2011, the federal government picked up 60% of crop insurance premiums. In fact, crop and revenue insurance now represents the primary federal support for farm income, paying $5.2 billion in direct payments to farmers and $7.4 billion in insurance premium subsidies.

Today’s market size post lists the number of acres of farmland covered by crop insurance in 1981 and 2011 as well as the total insured liability each year. The level of government subsidies for crop insurance has risen quite substantially over this period. Total premiums paid for crop insurance in 2011 were approximately $12.3 billion, of which the federal government picked up 60%, or $7.4 billion.

Our hope is that all those impacted by this drought are spared serious damage and that starvation in distant places of this ever more connected world does not rise as a result of crop shortfalls in the United States.

Geographic reference: United States
Year: 1981 and 2011
Market size: Acres: 45 million and 262 million respectively
Market size: Insured liability: $6 billion and $113 billion respectively
Source: Keith Collins and Harum Bulut, “Crop Insurance and the Future Farm Safety Net,” February 10, 2012, available online here and Andrew G. Simpson, “Cap on Subsidy of Crop Insurance Premium Would Save $1 Billion: GAO,” April 13, 2012, available online here.
Original source: FarmDocDaily, Insurance Journal, U.S. Department of Agriculture, and the U.S. Government Accounting Office.
Posted on August 1, 2012

Garden Mulch from Cypress

After a summer break, we’re ready to start posting market size entries again.

Garden mulch comes in many forms: leaves, grass clippings, pine needles, wood chips, and tree bark, just to name a few. One popular type of mulch, cypress mulch, is made from harvested trees in the Southern United States. At one time, cypress trees, wildlife-friendly and one of the most hurricane-resistant trees, were plentiful on the Gulf Coast. Many were thousands of years old. After Congress passed the Swampland Act in 1850, deeding millions of acres of wetlands to the states, many of those acres were sold to corporations for 75 cents an acre or less. By 1930, most of the virgin cypress were logged. In the past, cypress was logged for home building and flooring, but more recently, thousands of acres of cypress are being cut down to create garden mulch. Data are on an annual basis.

Geographic reference: United States
Year: 2012
Market Size: $750 million
Source: Selcraig, Bruce, “The Swamp Man,” Sierra, May/June 2012, pages 34-39
Posted on July 31, 2012

Marathon Races

By way of tipping our hat to one of our own who ran a half marathon over the weekend past, today’s market size report is all about marathon races run in the United States. While still an elite group, marathon running has been gaining in popularity over the last two decades and the number of races has been growing steadily.

Congratulations, Bob!

Geographic reference: United States
Year: 2000 and 2011
Market size: Marathon races, 300 and 720 respectively
Market size: Number of runners who finished a marathon: 353,000 and 518,000 respectively
Source: Running USA’s Annual Marathon Report, February 26, 2012, available online here.
Original source: Running USA
Now, how shall we categorize this entry… hmm…?
Posted on June 4, 2012

Plain Glass Eyewear

What was once seen as a sign of nerdishness has become a fashion statement. When basketball stars like LeBron James and Dwayne Wade, Kevin Garnett and Kevin Durant are sporting big, black, chunky eyeglasses for the fun of it—meaning the eyeglasses are not prescription glasses at all but frames containing plain glass lenses—eyeglass frame makers must be pleased. Market analysts point to a number of high-profile persons—Meryl Streep and Demi Moore from the Hollywood scene, Sarah Palin and Rachael Maddow—who wear eyeglasses and whose eyewear styles are seen as part of the motivation behind this growing market for fashion based eyewear. Will it be a passing fad as so many fashion statements are or a longer lasting trend as those wearing plain glass eyewear get older and start needing to put prescription lenses into their statement accessories?

Today’s market size is based on calculations made with survey results from a Vision Council of America survey and U.S. Census Bureau population statistics. It shows the number of U.S. adult residents who report having worn plain glass eyewear as a fashion statement during the period 2008 and 2011.

Geographic reference: United States
Year: 2011
Market size: 16.3 million people aged 18 or over
Source: Adam Tschorn, “A New Essential?” The Republic, Columbus, Indiana, May 7, 2012, available online here. Picture comes thanks to this Warby Parker website.
Original source: Vision Council of America and the U.S. Census Bureau
Posted on June 1, 2012

Cement in the United States

U.S. Apparent Consumption

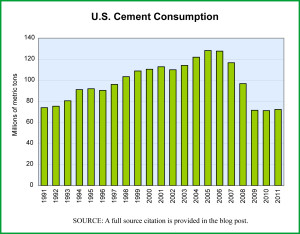
The recession of 2007-2009 was deep and hit many sectors hard. The construction sector was one of the hardest hit and all the suppliers to it have been struggling to find enough stability to weather the downturn which has yet to turn around. But even knowing these facts, we were surprised by the stunningly severe downturns seen in the Spanish cement industry since 2007—as reported in the last post. It made us wonder how the U.S. cement industry has fared during the same period. The graph here charts U.S. cement consumption for a similar time period as the one in our last post on Spain.

The differences in these charts are very interesting and very telling. In the United States, the build up in consumption during the housing boom was strong but not nearly as sharp as the build up in Spain. The declines in both countries were sharp and abrupt as the housing bubble burst and the banking crisis began. However, in Spain, the post-2007 decline was sharper, more like a fall from a cliff and it has continued to fall sharply since whereas in the United States the decline leveled off in 2009 and 2010 and actually showed signs in 2011 of possibly beginning to recover, if only slightly.

Today’s market size post shows the overall value of cement sales—portland and masonry cement—in the United States in 2006 and 2011.

Geographic reference: United States
Year: 2006 and 2011
Market size: $12.6 billion and $6.6 billion respectively
Source: “Cement – Statistics and Information,” Mineral Industry Survey, a series of reports produced by the U.S. Geological Survey, made available online and last updated on May 25, 2011. Here is a link to the USGS site.
Original source: U.S. Department of the Interior
Posted on May 29, 2012

Cement in Spain

Spanish Cement Consumption

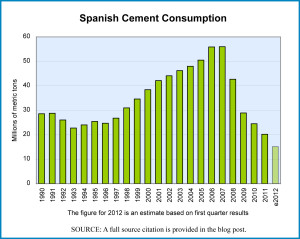
We hear much these days about Europe and the economic struggles it is having. Watching from afar—or at least as far as one can be in our very intertwined, economically globalized world—we tend to see primarily the outlines of the big, macro picture. A quick glance at Spanish cement demand since 2007 reminds one of how the overall downturn is hitting some sectors with special ferocity.

While many industrialized nations experienced a construction boom during the 2001-2007 period, Spain’s was one of the larger. Consequently, its cement industry grew at a robust rate for a decade. Since peaking in 2007 it has shrunk dramatically and significant declines in early 2012, on a year-over-year basis, suggest that the shrinking is far from complete. In fact, rates of consumption when measured on a per capita basis have not been as low in Spain since 1966.

Today’s market size post shows the demand for cement in Spain in 2007 and 2011. The graph shows Spanish cement consumption over a two decade period.

Geographic reference: Spain
Year: 2007 and 2011
Market size: 56.0 and 20.2 million metric tons respectively
Source: “Holcim Spain to Cut 35% of Workforce,” Global Cement, May 23, 2012, available online here. and updates from the Monthly Retail Trade Reports from the same reporting series, U.S. Census Bureau, available online here. The graph was created from data provided by Oficemen, the Spanish Cement industry association, Agrupación de Fabricantes de Cemento de España, available online here.
Original source: Global Cement and Oficemen
Posted on May 25, 2012

Solar Panels

On May 17, 2012, the U.S. Commerce Department announced the imposition of antidumping tariffs on solar panels imported to the United States from several Chinese companies. China exports 95% of the solar panels it makes worldwide. In the United States, Chinese-made solar cell imports more than doubled between 2010 and 2011 while the wholesale price of solar cells in the United States continued a multi-year fall. The price of solar panels is based on their electrical capacity. In 2008, the average price per watt of capacity was $3.30 and in January 2012 that price had fallen to $1.20. The lower prices have fueled the market and led to quickly rising installations but they have also crippled the domestic panel manufacturing industry. Therefore, the new tariffs are welcomed by one part of the industry—manufacturers—and disliked by another—installers.

Today’s market size is the value of solar cells imported to the United States from China in 2011.

Geographic reference: United States
Year: 2011
Market size: $3.1 billion
Source: Keith Bradsher and Diane Cardwell, “Chinese Solar Panels Face Big Tariffs,” New York Times, May 18, 2012, page B1, available online here. Also from Keith Bradsher, “U.S. Solar Panel Makers Say China Violated Trade Rules,” New York Times, October 19, 2011, available here.
Original source: U.S. Department of Commerce
Posted on May 22, 2012

Dolls, Games, and Toys

The United States is the largest toy and game market in the world, with an estimated retail sales value in 2010 of $22 billion. This estimated value includes video game consoles but does not include the games themselves, which are categorized as software but by some estimates would add another $10 billion to the actual value of the dolls, games, and toys market. Of course, if we included things that somebody considered a toy while another considered a vehicle of some sort—boat, bike, snowmobile—it would be an even larger market… Yes, defining the market is key, which is part of what makes a system like the North American Industrial Classification System (NAICS)—used by Canada, Mexico, and the United States—so useful.

Today’s market size post breaks the U.S. dolls, games, and toys industry down into three categories, U.S. manufacturer shipments, imports, and exports. The fact that U.S. made product is valued by the Census Bureau at less the value of exports is the result of what is called re-exportation; some of what is imported is turned right around and exported. A topic for another day.

Geographic reference: United States
Year: 2002 and 2010
Market size: Domestic production at wholesale: $4.85 and $2.86 billion
Market size: Exports F.A.S.: $1.16 and $3.77 billion
Market size: Imports C.I.F.: $12.06 and $22.30 billion
Source: “Statistics for Industry Groups and Industries: 2010 and 2009,” Annual Survey of Manufactures 2010, available from the Census Bureau website here. and data from the U.S. International Trade Statistics database on NAICS industry 339932. The International Trade Statistics database is available online here.
Original source: U.S. Department of Commerce, Bureau of the Census
Posted on May 5, 2012

E-Commerce Writ Large

Sector Pie Chart

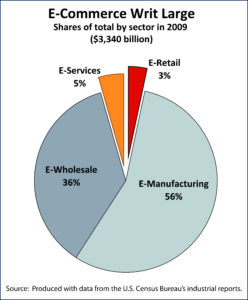
The announcement this week that two large players in the Internet world have made billion dollar plus acquisitions made us think again about e-commerce. It is a term that is used regularly but one suspects that its meaning is somewhat subjective and based on the user’s own concept of the business. E-commerce can be viewed, as it often is, as electronic shopping. Of course, that might more accurately be called e-shopping or e-retail. Commercial exchange is much bigger than that.

By taking the electronically transacted portions of each of the primarily commercial sectors of the economy, we see (in the pie chart) that e-retail makes up only a small share of the more broadly defined e-commerce. E-wholesale and e-manufacturing account for the lion’s share of the total but they are not new and shiny and so attract far less media attention or investor interest.

Even within the retail sector as a whole, e-commerce accounts for just under 5 percent of the whole. That percentage is, of course, growing, and growing rapidly. It is this fact that must be causing companies like Facebook to spend in excess of $1 billion on a company with a popular photo-sharing app (Instagram). Worth noting is the fact that in some retail sectors, e-commerce does play a far larger role than the 5 percent it represents of the sector at large: electronics and books are two such.

Today’s market size numbers measure the size of the U.S. retail sector in the 4th quarter of 2011, and the size of the e-commerce portion of that total.

Geographic reference: United States
Year: 2011, 4th quarter
Market size: Retail, $1.072 trillion, E-commerce: $51.38 billion (4.8% of total retail)
Source: Quarterly Retail E-Commerce Sales, 4th Quarter 2011, U.S. Census Bureau, available online here.
Original source: U.S. Department of Commerce, Bureau of the Census
Posted on April 11, 2012

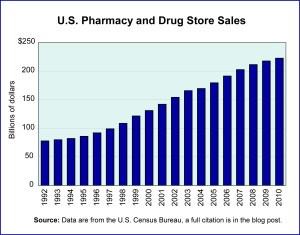
Pharmacy & Drug Stores

Drug Retailing

The sale of drugs, whether over-the-counter or prescription drugs, has been a healthy, growing business for a long time in the United States. The sale of these products through pharmacies and drug stores is the subject of our post today. The graph presents sales of these retailers over the period 1992–2010. The annual growth rate in sales over this period was 10.3%, a third faster than the economy as a whole, which grew at 7.2% annually.

Worth noting is the fact that over this same time period, the number of retail outlets selling drugs has increased as Big Box stores, grocery stores and others have gotten into the business of selling drugs with enthusiasm. Consequently, the role of pharmacies and drug stores in total drug sales has actually declined over this period.

Geographic reference: United States
Year: 2000 and 2010
Market size: $130.87 billion and $222.26 billion respectively
Source: Annual Retail Trade Survey 2009, and updates from the Monthly Retail Trade Reports from the same reporting series, U.S. Census Bureau, available online here.
Original source: U.S. Department of Commerce, Bureau of the Census
Posted on April 4, 2012

Apparel Consumption

Clothes, we all wear them and yet for the apparel industry what matters is fashion. It is through changing fashions that people are most often lured into buying more clothes than are strictly necessary. For many, of course, clothes buying is an entertainment.

Per capita spending on apparel in the United States peaked for the first decade of the new century in 2005 and then fell, gaining downward momentum with the onset of the recession and the financial crisis that followed. Complicating the downward spiral is the fact that apparel companies were caught somewhat off guard by the sharp decline in spending which led to excess inventories. As these were liquidated, overall apparel prices declined.

Today’s market size is a measure of the apparel industry based on per capita spending in the United States.

Geographic reference: United States
Year: 2005 and 2010
Market size: Annual, per capita spending of $1,276 and $1,136 respectively
Source: “Table 3. Age of Reference Person: Average Annual Expenditures and Characteristics,” Consumer Expenditure Survey, 2005 and 2010, U.S. Bureau of Labor Statistics, available here
Original source: U.S. Labor Department
Posted on March 21, 2012

Cable and Premium TV Market

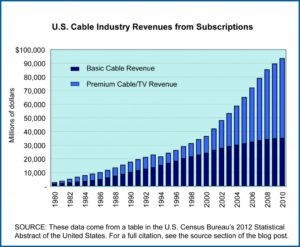
Cable TV revenues

Economic data show that most industries in the United States saw declines of some sort during the recent recession and accompanying financial crisis of 2007—2009. One industry which appears to have weathered the downturn without noticeable declines is the pay television broadcasting industry. It is true that the growth they’ve seen may have been larger were it not for the economic downturn. Nonetheless, based on overall revenue, the industry’s growth trajectory has shown not a blip as can be seen in the chart.

Today’s market size post is based on industry revenues for cable services from basic and premium broadcasting as well as installation services and high-speed Internet access through cable lines.

Geographic reference: United States
Year: 2000 and 2010
Market size: $36.43 and 93.37 billion respectively
Source: “Table 1142. Cable and Premium TV—Summary: 1975 to 2010,” 2012 Statistical Abstract of the United States, December 2011, U.S. Census Bureau, page 717, available online here.
Original source: SNL Kagan, a division of SNL Financial L.C.
Posted on March 12, 2012

Waldkindergartens

Waldkindergartens, or forest kindergartens, are outdoor schools for three to five year olds. As the name implies, the classes are held in forests. Although these types of schools became popular in Europe in the 1950s and 1960s, the idea of outdoor classrooms began in the 1800s when Friedrich Froebel, a German educator and former forest intern, introduced the concept of kindergartens, or children’s gardens. When working with young children, he would teach them in garden settings or in the countryside. Later other educators expanded on his idea with a play-based curriculum.

In the United States, kindergartens are teacher-directed indoor classrooms; however, in the mid-2000s after the book Last Child in the Woods, by Richard Louv, was published there was a renewed interest in getting children outdoors for play and for education. While waldkindergartens are rare in the United States currently, the few programs that are in existence have waiting lists of students wanting to be part of the program. Are these programs beneficial? A study in Europe found that children who went through the waldkindergarten program had more self-confidence, a greater sense of independence, stamina, coordination, motivation and concentration. Some parents in the United States report that their children have better problem-solving and critical-thinking skills. Data show the approximate number of waldkindergartens in Germany.

Geographic reference: Germany
Year: 2012
Market Size: 450 schools
Source: Ruth A. Wilson, “Teaching Among the Trees,” American Forests, Winter 2012, pages 42-43
Posted on March 6, 2012

Cable Programming & Distribution

The U.S. economy is divided into large categories for the purpose of tracking economic activity and the “Information” sector of the economy is where such things as publishing, broadcasting and telecommunications reside. The rise of the digital age is having a major impact on the activities of this sector but for some, it is a very positive impact while for others the transition is more challenging. The cable business is one of the industries in this sector that is seeing robust growth in revenue and over the last five years has shown no sign of slowdown despite the recession and subsequent financial crisis of 2007-2009.

Today’s market size is the size of the U.S. cable program distribution and subscription programming industry in 2005 and 2010. These industries are designated with the following NAICS codes: 5152 (Cable and other subscription programming) and 5175 (Cable and other program distribution).

Geographic reference: United States
Year: 2005 and 2010
Market size: $117.1 and $176.5 billion respectively
Source: “Table 3.0.1 Information Sector (NAICS 51)—Estimated Revenue for Employer Firms: 2005 through 2010,” Service Annual Survey, February 2, 2012, available online here.
Posted on February 27, 2012

Newspapers

Annual revenue generated by the newspaper industry in the United States fell again in 2010, following a pattern seen throughout the last decade. The most recent Service Annual Survey, published by the U.S. Census Bureau, shows a decline in revenues from 2005 to 2010 for the newspaper publishing industry of 30 percent, and this represents a loss of revenue before inflation. The loss, when adjusted for inflation, was 42 percent.

Today’s market size is the size of the newspaper industry in the United States based on annual revenues in 2010.

Geographic reference: United States
Year: 2010
Market size: $34.7 billion
Source: “Table 3.0.1 Information Sector (NAICS 51)—Estimated Revenue for Employer Firms: 2005 through 2010,” Service Annual Survey, February 2, 2012, available online here.
Posted on February 20, 2012