U.S. Active Duty Military

Active Duty Military, 1990-2011

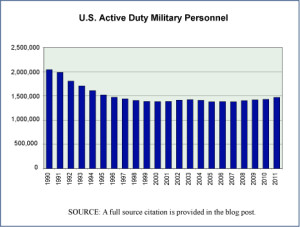
Today’s market size is the size of the population of U.S. active duty military personnel. The chart to the right shows active duty military personnel figures from 1990 through August of 2011. The declining trend in this population, which appears clearly in the chart, is somewhat surprising given the United States’ involvement in “hostilities” in several parts of the world since 1990. One can see what appears at first blush to be a similarity with the economy at large in terms of reduced demand for labor and increased outsourcing. However, we only mention this seeming similarity here because such an assertion would require far more study and analysis to either present properly or disprove.

Geographic reference: United States
Year: 2010
Market size: 1.43 million
Source: “Table 510. Department of Defense Personnel: 1960 to 2010,” 2012 Statistical Abstract of the United States, page 335, available online through the Census Bureau’s website, here.
Original source: U.S. Department of Commerce, Bureau of the Census and the U.S. Department of Defense.
Posted on January 7, 2013

Sales Taxes

With so much discussion of late about taxes, mostly income taxes, we thought we’d look at another tax. This one rests particularly heavily on those at the lowest end of the income scale. It is the sales tax.

Sales taxes vary greatly from state to state and within a state from area to area. An example of this is Warren County, New York, located at the southern end of the Adirondack Mountains and encompassing the beautiful resorts surrounding Lake George. As a region for which tourism is a major economic engine, it levies its own local sales tax. Total sales taxes of 7% are collected in Warren County, 4% is a state level tax which is passed on to the state and the remaining 3% is retained by the county. Please note that this local sales tax may not be included when the U.S. Census Bureau does studies of national sales tax collections for a particular year by looking at the totals collected by each state. It depends on whether or not the state in question includes that local sales tax revenue in its summary of tax collections reported to the Census Bureau.

Today’s market size is the total collected for sales taxes in the United States by states in 2011. These sales taxes accounted in 2011 for 48.4% of the total of all taxes collected by state governments.

Geographic reference: United States
Year: 2011 (fiscal year)
Market size: $366.54 billion
Source: “State Government Tax Collections Summary Report: 2011,” April 12, 2012, a report from the Census Bureau available online here.
Original source: U.S. Department of Commerce, Bureau of the Census
Posted on January 3, 2013 (still seems odd, 2013!)

College Enrollment

While we at ECDI don’t really see education as a market-driven endeavor, there is no question that educational services are an important part of the U.S. economy. Public expenditures on education account for between 5% and 6% of Gross Domestic Product (GDP) annually, as measured in value added. Educational services in the private sector account for another 1% to 1.5% of GDP. Today we look at enrollment in post-secondary educational institutions of all sorts in the United States as our market.

Several interesting details about 2011 college enrollment in the United States are these: of the total enrolled, more than half were females (55.2% versus 44.8%); most were full-time (73%); most were enrolled in public institutions (79%), and slightly more than half of the students were employed, either part-time (27.5%) or full-time (25.7%). For anyone interested in more details about this “market,” the source from which we obtained today’s market size—link provided below—offers a very detailed breakdown of college enrollment in the United States, by demographic characteristics as well as by type of institution and by years in school.

Geographic reference: United States
Year: 2011
Market size: 20.4 million
Source: “Table 5. Type of College and Year Enrolled for College Students 15 Years Old and Over, by Age, Sex, Race, Attendance Status, Control of School, Disability Status, and Enrollment Status: October 2011,” part of the Current Population Survey series produced and made available to us all by the U.S. Census Bureau on their website here.
Original source: U.S. Department of Commerce, Census Bureau.
Posted on November 30, 2012

Charitable Giving

Today’s market size post provides a measure of charitable giving in the United States last year. Charitable giving was greatly impacted by the recession and financial system melt-down of 2007–2009 but contributions have been rising as the economy recovers, slowly. In 2011, charitable giving totals were up 4% over giving in the prior year but were still 11% lower than the total giving in 2007. Of interest is the fact that contributions made by individuals accounted, in 2011, for 73% of all charitable giving in the United States.

Geographic reference: United States
Year: 2011
Market size: $298 billion
Source: “Giving Statistics,” National Park Service website posting with a great deal of information reproduced from the report listed below as the Original Source. Here is a link to the National Park Service website.
Original source: Giving USA 2012, American Association of Fundraising Counsel.
Posted on September 14, 2012

Military Expenditures Worldwide

On the 11th anniversary of terrorist attacks on the United States, we look at military spending for today’s market size post. According to a recent report by the Stockholm International Peace Research Institute which tracks military spending worldwide, the response to the September 11 attacks was “one of the dominating factors of the global security environment over the past 10 years, and a key factor influencing military spending in many countries.

Today’s market size is the measure of all military expenditures by countries around the world in 2011, of which the top three by overall spending were the United States with 41% of the total expenditure, China with 8%, and Russia with 4%.

Geographic reference: World
Year: 2011
Market size: $1.738 trillion
Source: SIPRI Yearbook 2012, Armaments, Disarmament, and International Security, Summary, pages 8-9, published in 2012 by the Stockholm International Peace Research Institute. The summary report is availalble online here.
Original source: SIPRI
Posted on September 11, 2012

Newspapers

Annual revenue generated by the newspaper industry in the United States fell again in 2010, following a pattern seen throughout the last decade. The most recent Service Annual Survey, published by the U.S. Census Bureau, shows a decline in revenues from 2005 to 2010 for the newspaper publishing industry of 30 percent, and this represents a loss of revenue before inflation. The loss, when adjusted for inflation, was 42 percent.

Today’s market size is the size of the newspaper industry in the United States based on annual revenues in 2010.

Geographic reference: United States
Year: 2010
Market size: $34.7 billion
Source: “Table 3.0.1 Information Sector (NAICS 51)—Estimated Revenue for Employer Firms: 2005 through 2010,” Service Annual Survey, February 2, 2012, available online here.
Posted on February 20, 2012

Cantaloupes and Other Agricultural Commodities

Being people who work with statistical data every day it was with great pleasure that we read recently that the USDA has decided to reverse its earlier decision to eliminate dozens of longstanding statistical reports that it has maintained for decades. Turns out the industries being covered by these reports find them extremely valuable, essential really. So, industry leaders explained just how important those reports are to their planning and financing and the USDA reconsidered. We find this development most encouraging. Some things really are best done at the large scale by an entity not motivated by its own commercial interests.

Today’s market size, selected from a long list of in-depth USDA commodity reports, is the market for domestic cantaloupe. It is the value (farm value or wholesale value) of cantaloupes harvested in in the United States in 2010 when 77,430 acres were planted with cantaloupe.

Geographic reference: United States
Year: 2010
Market size: $314.4 million
Source: William Neuman, “U.S. Reverses Decision To End Farming Reports,” The New York Times, December 24, 2011, page B3, available online here. The USDA report on cantaloupes can be found online here. The figure used here is from Table 3—U.S. Cantaloupe: Acreage, Yield, Production, and Value, 1950-2010.
Original source: U.S. Department of Agriculture
Posted on December 30, 2011

R&D Expenditures Nationally

An encouraging statistic for today’s market size post, the growth rate in expenditures on research and development in the United States. Between 1980 and 2008 total spending on R&D grew by 529 percent.

Geographic reference: United States
Year: 1980 and 2008
Market size: $63.2 billion and $397.6 billion respectively
Source: “Table 799. Research and Development (R&D) Expenditures by Source and Objective,” Statistical Abstract of the United States 2012, page 522, a PDF version of that page is available here.
Original source: U.S. Census Bureau
Posted on December 16, 2011

Ham Radio Operators

Amateur radio, also known as ham radio, uses a designated “radio frequency spectrum for purposes of private recreation, non-commercial exchange of messages, wireless experimentation, self-training, and emergency communication,” according to Wikipedia. Ham radio operations are coordinated by the International Telecommunication Union. Ham radio operators must demonstrate knowledge in electronics and regulations in order to obtain a license for their radio station. Once licensed, the ham radio operator can communicate with people throughout the world.

Amateur radio began in the late 19th Century. By the late 20th Century, the hobby’s
popularity was waning; however, in the early 21st Century, ham radio saw a surge in the number of enthusiasts. By 2010, the number of ham radio licenses in the United States had increased 60 percent since 1981. In 2007, the United States Federal Communications Commission stopped requiring knowledge of Morse Code in order to obtain a license. The increase in ham radio licenses has been attributed to this. In 2010 alone, there were 30,000 new applications for ham radio licenses.

Today’s market size is the total number of people that have ham radio licenses in the United States.

Geographic reference: United States
Year: 2010
Market Size: 700,000
Source: Matt Sepic, “Ham Radio Growing in the Age of Twitter,” NPR, April 5, 2010, available online here and “Amateur Radio,” Wikipedia, available online here.
Posted on December 9, 2011

Medicare Enrollment

Medicare Enrollment Stats

Today is the 70th anniversary of the attack on Pearl Harbor. Today is also the final day of the Medicare annual enrollment period. Only one of these topics lends itself to a market size post. Worth noting—and by way of tying these two things together a little—is the fact that anyone (now an American citizen) who was around on the day that Pearl Harbor was attacked, is now eligible for Medicare.

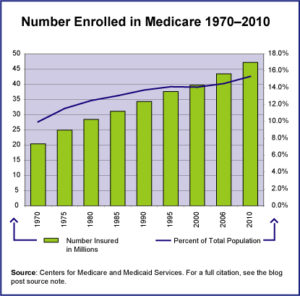
Today’s market size is the number of people enrolled in the Medicare health insurance system in the United States in 2010. The graphic provides data on enrollment from 1970 to 2010 and shows how this population relates to the total U.S. population over this period.

Geographic reference: United States
Year: 2010
Market size: 47.2 million
Source: “Table I.1 Medicare Enrollment Trends,” part of the statistical offerings on the Federal Government’s CMS website here.
Original source: Center for Medicare and Medicaid Services, U.S. Department of Human Health and Services
Posted on November 7, 2011

Computers in the U.S.

The steady rise in demand for computers and electronic computing devices in the United States appears, when charted, as a line moving in exactly the opposite direction as the domestic production and shipments of these same products. This is an industry (NAICS 334111) that highlights a trend towards increasing consumption of a product and declining production of the same which feeds the U.S. trade imbalance. But that leads us to complex questions we don’t really want to address here. Here, we present market sizes and today’s is based on the value of Electronic Computer Manufacturing in the United States in 2000 and 2010 as well as the value of net imports of the same products in 2000 and the forecasted value for 2010.

Geographic reference: United States
Year: 2000 and 2010
Market size: U.S. manufacturing $69.3 and $27.9 billion
Market size: Net imports $89.4 and $199.3 billion
Source: Computer value of shipments from Annual Survey of Manufactures 1997, and the 2002 Economic Census. Net imports of Electric and Electronic Equipment from Statistical Abstract of the United States: 2000. Net imports of Computers and Electronic Products from Statistical Abstract of the United States: 2012.
Posted on November 29, 2011

Veterans Enrolled in the VA

Today’s post is about veterans since it is the holiday we have designated for remembering our veterans of foreign wars. The Department of Veterans Affairs has since 1999 done an annual survey to help track the number of veterans who are enrolled to receive health benefits through the Veterans Administration (VA). It may surprise some people to discover that a veteran of the U.S. military would even need to enroll in anything to receive VA benefits but things are more complicated as it turns out.

Here is an explanation from the VA on the need to enroll annually for some veterans. “Enrollments are renewed annually and many veterans will stay enrolled each year without any action on their part. Most veterans who are not receiving monthly compensation or pension checks from VA, however, must complete an annual financial statement known as a Means Test. Completing a Means Test allows the VA to place you in the correct Priority Group for determination of copayments. It also ensures that your local VA receives reimbursement from VA for the health care provided to you.”
Link to quoted source.

The market size listed below is the number of U.S. veterans enrolled to receive VA benefits in 2002 and in 2010.

Geographic reference: United States
Year: 2002 and 2010
Market size: 6.2 million (approximately 25% of the veteran population in 2002) and 7.8 million (approximately 35% of the veteran population in 2010)
Source: “Table 7.1—Perceived Health Status by Year,” 2010 Survey of Veteran
Enrollees’ Health and Reliance Upon VA,
July 2011, page 74, available in a PDF format here.
Original source: U.S. Department of Veterans Affairs
Posted on 11/11/11

Foreign Students in the United States

While within the United States there is a great deal of debate about how the higher education system as a whole is functioning, its appeal to those from outside the country is as strong as ever. The number of students traveling from outside the United States to attend a U.S. institute of higher learning has been increasing steadily during the first decade of the 21st century. This is both a challenge and a benefit for U.S. colleges and universities as these students often need intensive language assistance but also pay full tuition. According to the U.S. Department of Commerce, foreign students in the United States contribute approximately $20 billion to the economy annually.

Today’s market size is the size of the population of foreign students at U.S. institutions of higher learning in 2009.

Geographic reference: United States
Year: 2009/2010 School Year
Market size: 690,923 students — in terms of country of origin, the three leading countries are China which sent 18.5% of the students in 2009/2010, India which sent 15.2% and South Korea which sent 10.4%
Source: A press release for the report titled Open Doors 2010 which is put out annually by the Institute of International Education. The report is issued annually and the press release announcing the 2010 edition is available online here.
Original source: Institute for International Education and the U.S. Department of State’s Bureau of Educational and Cultural Affairs
Posted on November 7, 2011

Postal Service Mailboxes

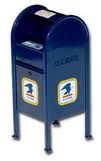
Blue USPO Mailbox

While the United States Postal Service publicizes the closing of thousands of post offices nationwide, the laying off of workers, and the end of Saturday delivery, one service the Postal Service offers has been slowly, quietly disappearing: the corner mailbox.

Once a staple in many neighborhoods, the blue mailbox on the corner is now slowly fading into history. Nancy Pope of the Smithsonian Institution commented thus about the significance of the corner mailbox: “Nothing says you’re on an American street more than the blue mailbox. It’s part of a neighborhood identity. It’s reassurance, it represents our ability to communicate with one another. When you take this away, something is lost.” At one time these blue mailboxes were seemingly everywhere. A convenience that perhaps has been taken for granted over the years. Data show the number of United States Postal Service blue mailboxes nationwide.

Geographic reference: United States
Year: 1985 and 2011
Market Size: 400,000 and 160,000 respectively
Source: Bob Greene, “Farewell My Mailbox,” CNN.com, September 8, 2011, available online here. The charming little image used above was obtained from this site, and used with our thanks.
Original Source: Research by Carolyn Jones of the San Francisco Chronicle.
Posted on October 28, 2011

“e-Learning” Hardware and Software

The use of computers and other technological devices in the classroom has long been a source of debate among educators. Equipping schools with the most cutting edge technology is costly and the benefits of these expenditures in actually teaching students is not always evident. Nonetheless, in a world in which computers are ubiquitous the desire to have our children use modern technology with confidence helps to drive growth in the market for “e-learning” devices and software.

Today’s market size is a forecast of the value of the e-learning sub-sector of “the global education market” in the year 2015.

Geographic reference: World
Year: Forecast for 2015
Market size: $69 Billion
Source: “Brave New World: The Changing Landscape of Education and Technology,” April 2010, a report posted online by the firm Spire Research & Consulting and available here.
Original source: Marijk van der Wende, “The Role of US Higher Education in the Global E-Learning Market,” Center for Higher Education Policy Studies (CHEPS), Research & Occasional Paper Series, University of California, Berkeley, 2002
Posted on September 14, 2011

Freight by Rail

Moving large volumes of freight over long distances is an energy intensive proposal and something we do very regularly these days. In fact, with the rise of globalization humanity is now moving more over greater distances than ever before. Moving cargo by rail is the second most efficient means of transporting it—the first being transport over water. Coal is the commodity whose movement on railroads accounts for the largest percentage of tonnage moved by Class I Railroad operators in the United States (44%) and the largest percentage of gross revenue, when divided out by commodity type, for these operators (24%).

Today’s market size is the tonnage carried by U.S. Class I Railroads in 2010 and the value of the corresponding gross revenue earned for their transportation. The revenue number does not adjust for such things as incentive rebates offered by the railroad operators. U.S. Class I Railroads in 2010 were the following: BNSF Railway, CSX Transportation, Grand Trunk Corporation, Kansas City Southern Railway, Norfolk Southern Combined Railroad Subsidiaries, Soo Line Corporation, and Union Pacific Railroad.

Geographic reference: United States
Year: 2010
Market size: 1.85 billion tons and $57.44 billion in gross revenues
Source: “Class I Railroad Statistics,” June 17, 2011, a report produced by the Policy and Economics Department of the Association of American Railroads. Here is a link to the report.
Original source: Association of American Railroads

Judicial Campaign Ads on TV

State Supreme Court Campaign Funds

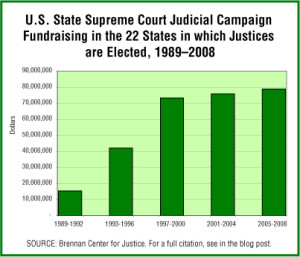
For many, the idea of electing a judge is an odd one. It seems strange to have judicial candidates handing out trinkets at the polling place when next they may be presiding over a court of law making decisions of a very serious nature. Yet for a variety of reasons, 22 States in the United States hold at least some competitive elections in selecting their State Supreme Court Justices. According to a new report by the Brennen Center for Justice, the volume of money being raised and spent on state-level judicial campaigns has been rising very sharply. In fact, many feel strongly that this infusion of money is undermining confidence in our very judicial system.

The graph shows the sum of all state supreme court campaign fundraising, by four-year election cycle, over a period of 19 years. The rise in fundraising is directly correlated to a rise in the quantities contributed by a small number of large donors, businesses and business groups for the most part. For more details, we recommend a close look at the source report.

Today’s market size is the quantity spent on television spots for candidates in State Supreme Court Judicial Campaigns during 2008 alone, a subset of the money presented in that graph for the years 2005-2008.

Geographic reference: United States, and more specifically, the 22 states that hold some competitive electorial process in the selection of their Supreme Court Justices
Year: 2008
Market size: $19,945,970
Source: James Sample, Adam Skagg, Jonathan Blitzer, Linda Casey, and Charles Hall, The New Politics of Judicial Elections 2000-2009: A Decade of Change, Figure 1 on page 5 and Figure 13 on page 26, August 2010, published by Brennan Center for Justice, National Institute for Money in State Politics, and Justice at Stake Campaign. The report is available online here.

National Flood Insurance Program

With flood waters inundating so many in the Mississippi River Valley and with spillways being opened to try and mitigate the damage further downstream, we turn today to the size of the United State’s National Flood Insurance Program (NFIP), run by the Federal Emergency Management Agency (FEMA). The program was designed to provide a shared pool of resources that could help to reduce the high cost of disaster assistance resulting from flooding along the national waterways.

NFIP is not only an insurance program but a floodplain management and mapping program. Participation in NFIP is voluntary at the community level, with a couple of exceptions. One is for properties located in officially designated flood plains on which a mortgage is held. Banks require the purchase of flood insurance for such properties on which they hold the mortgage. Another exception to the voluntary nature of this program is the fact that those who receive financial assistance from the federal government following a Presidential declaration of disaster may then be required to purchase flood insurance through NFIP.

Today’s market size is the total amount paid in premiums to the NFIP in 1990 and 2010 as well as the number of policies in force in those years.

Geographic reference: United States
Year: 1990 and 2010
Market size: $672.8 million from 2.48 million policies and $3,353.8 million on 5.65 million policies respectively
Source: “Statistics by Calendar Year,” data made available online here by FEMA.
Original source: U.S. Department of Homeland Secutiry, Federal Emergency Management Agency

Barges

Our thoughts turn to those living along the nation’s riverways as news of rising waters and extensive flooding are coming in from all over the Midwest and East Coast. The inland and intercoastal waterway as an important transportation highway then comes to mind, a highway on which hundreds of millions of tons of cargo move annually valued at over $75 billion. Much of this cargo is moved in barges—non-self-propelled vessels—much like rail cars for the waterway system. Barges are tied together and moved through the system by tow boats. Barges are the most energy efficient way to move things. On a ton-mile per gallon basis, (miles per gallon carrying one ton of cargo) trucks get 155 miles, rail transport gets 413 miles and inland towing gets 576 miles per gallon.

Geographic reference: United States
Year: 2008
Market size: 32,052 barges
Source: “TABLE 2: Summary of the United States Flag Passenger and Cargo Vessels Operating or Availalble for Operation by Year,” Waterborne Transportation of the United States, November 16, 2009, available online here. Energy costs per mode of transportation data comes from a report put out by the Kentucky Association of Riverports, available online here. Another Army Corp of Enginners report, titled Inland Waterway Navigation, Value to the Nation, highlights many interesting facts about the inland waterway, including how water transportation compares with other modes in terms of efficiency. It is available online here.
Original source: U.S. Army Corp of Engineers

BBC Funding

As a bit of a tip-of-the-hat to the royal wedding being celebrated today, we look at the company that will no doubt lead the rest in covering this event, the British Broadcasting Corporation, known around the world as the BBC. Today’s market size is the estimated total value of the annual licensing fee which is levied on every U.K. household that has a television set. This fee was established under law in 1922 and although controversial today, remains in place. The sum collected makes up approximately 80 percent of the BBC’s annual budget.

Geographic reference: United Kingdom
Year: 2010
Market size: £3.6 billion (approximately $5.6 billion based on the exchange rate at the end of 2010)
Source: Lyall, Sarah and Eric Pfanner, “The Beeb Is Struggling to Tighten Its Belt,” The New York Times, April 24, 2011, page B1.
Original source: BBC