Lottery Ticket Sales

The United States does not have an actual national lottery, as many nations do. That is not to say, however, that government-sponsored gambling is not a big business in the United States. Here, lotteries are operated at the state level. Total sale of lottery tickets in the United States, in all their many forms—daily numbers, pull tabs, scratch off cards, Keno, Powerball, Mega Millions, etc.—is today’s market size.

In all, 43 states have a lottery and some count 44 by including two Arkansas lotteries, one being the Arkansas Scholarship Lottery which is relatively new, having started in September of 2009. Other lotteries included in the calculation of the total national market are lotteries in the District of Columbia, Puerto Rico and the Virgin Islands. States with the largest sale of lottery tickets are New York, Massachusetts, Florida, Texas, Georgia and California which together accounted for 42.3% of lottery ticket sales nationally. Worth noting is the fact that this percentage is only slightly higher than these states’ combined population relative to the total U.S. population. Together, the populations of these six states represented 38.1% of the total U.S. population in 2010.

Geographic reference: United States
Year: 2010
Market size: $62.85 billion
Source: Patricia A. McQueen, “That Magic Word—’Growth’—Is Spoken Again as Most U.S. Lotteries Post Gains in Annual Sales,” Casino Journal, October 2010, page 8. The Federal government provides a page on its USA.gov website with links to all the state lottery websites for more details by state. That site is available here.

Recreational Boating

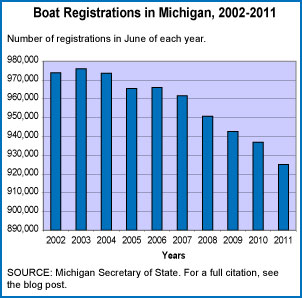
Boat Registrations in Michigan

The market size reflects the amount spent on new boats, boating accessories, engines, trailers, and services in Michigan. Despite the fact that the number of boat registrations dropped from 2010, total spending on boats shows a 10.6% increase from a year ago. Nationwide, in 2010, the number of boaters hit a record high of 75 million, or 32.4% of adults. According to the National Marine Manufacturers Association, that’s the highest percentage since 1999.

Geographic reference: Michigan
Year: 2011
Market size: $351 million
Source: Barbara Wieland, “Boating Industry Rides Recovery Wave,” Lansing State Journal, June 19, 2011, page 1E
Original source: National Marine Manufacturers Association.

Native American Tribal Casino Market

The recession of 2008 and 2009 took its toll on just about every industry, including the gaming industry. According to the source, this industry saw declines in 2009 but those declines were smaller than the declines experienced by commercial gaming nationally. Today’s market size is the size of the gaming industry run by native American tribes throughout the United States in 2009.

Geographic reference: United States
Year: 2009
Market size: Gaming Facilities: 446, Revenues: $26.4 billion
Source: Meister, Dr. Alan, Indian Gaming Industry Report, 2011 edition, highlights of which are provided in a press release about the report available online here.
Original source: Casino City Press

Video Games

The world of gaming is big and it is growing. Today’s market size is the number of video games sold annually. Leading video game publishers include Nintendo with around 19% of the market in 2010, Electronic Arts (12%), Activision (9.6%) and Ubisoft (7%).

Geographic reference: World
Year: 2000, 2005 and 2010
Market size: In millions of units: 43.7, 128.7 and 651.9 respectively
Source: “Worldwide Yearly Chart,” a report on the industry by VGChartz made available online here.
Original source: VGChartz Network

Home Movie Rentals

The ways in which people obtain the movies they wish to watch at home have multiplied and changed over time, altering this market greatly. In 2005 the video rental store still had a 74% share of this market but this share has declined in favor of companies that offer a mail-in form of service, like Netflix, as well as kiosk style retail outlets. By way of punctuating this transition, in late summer 2010, Blockbuster, one of the largest video rental store chains still operating, filed for bankruptcy.

The market size listed here includes the following categories of video rental outlet: Subscriptions, Kiosks, Traditional Video-on-Demand (VOD), Video Stores, and Internet VOD.

Geographic reference: United States
Year: 2010
Market size: $7.8 billion
Source: USA TODAY, September 23, 2010, page 2B.
Original source: Screen Digest

Sports Equipment

As basketball fans indulge in the offerings of March Madness, we look at sales of sporting equipment. Interestingly, when it comes to basketball, there is not much equipment needed, just a hoop and a ball. Basketball apparel, well, that’s another matter. Sporting apparel is not, however, included in today’s market size although it is included in the source table for those interested. Today’s market size covers a vast array of sporting equipment types, from fishing rods to golf clubs, tennis rackets to scuba tanks, and skis to fencing foils, to name but a few. Oh, and exercise equipment is included as well.

Geographic reference: United States
Year: 2009
Market size: $24.6 billion
Source: “Table 1249 – Sporting Goods Sales by Product Category: 1990 to 2008, and Projection, 2009,” Statistical Abstract of the United States: 2011, page 770, available online here.
Original source: National Sporting Goods Association

App Store Sales

We hear a lot about “apps” these days, or application programs. But what are they, really. These are computer programs designed as standalone software to run on a variety of devices, usually mobile devices. These apps are sold through online stores and usually have a well defined and somewhat limited purpose. They usually have a filename extension “.app” for use on mobile operating systems such as Android; iOS (Apple); Linux; MeeGo; Microsoft Mobile; RIM (BlackBerry); and Symbian.

Apps are a class of products whose market is based on volume. The average price of an app is around $2.50, (reached with a lot sold for 99¢ and a few sold for $9.00 plus) so a whole lot of apps had to sell in order to reach the market size presented below. There are 5 billion mobile device subscribers worldwide, according the the International Telecommunications Union (ITU). Now, all mobile devices are not “smart” devices and thus are not equipped to run apps. Nonetheless, based on the fact that an estimated 10% of these 5 billion devices are smart we can calculate, very generally, that each one of these smart device owners bought just under two apps in 2010. There seems room for growth here…

As a side note, that figure of 5 billion mobile device subscribers is rather noteworthy given that the world population in 2010 was just shy of 7 billion. Food for thought.

Geographic reference: World
Year: 2010
Market size: $2.15 billion
Source: Whitney, Lance, “Report: Apple Remains King of App Store Market,” CNET News, February 15, 2011, available online here. Also, press release from the ITU which is available online here.
Original source: IHS Screen Digest, February 2011

Movie Tickets

Some people wonder why so many Hollywood movies seem to be written to appeal to a very youthful crowd. As it turns out, this has to do with the fact that young people, aged 12 to 24 years, purchase a disproportionately high percentage of all movie tickets, disproportionate as compared to their representation within the population. In North America, young people aged 12 to 24 years represents 18% of the population but in 2010 bought 32% of movie tickets.

Geographic reference: North America
Year: 2010
Market size: 1.34 billion movie tickets.
Source: Barnes, Brooks and Michael Cieply, “Graying Audience Returns to Movies, in Glasses That Aren’t 3-D,” The New York Times, February 26, 2011, page 1.
Original source: Motion Picture Association of America

Music Stores

To be precise, the figures below are for the industry designated by the Census Bureau as Prerecorded Tape, Compact Disc and Record Stores [NAICS 45-1220]. Now, the very name of this industry will likely explain why it has seen such precipitous declines over the last decade… since music is now so often purchased online and downloaded as an electronic file. It also serves as an extreme example of a retailing segment that is having to grapple with a major shift in how business is done.

Geographic reference: United States
Year: 1997 and 2007
Market size: Number of Establishments: 8,158 and 4,102 respectively.
Market size: Sales: $7.37 and $3.51 billion respectively.
Market size: Employment: 66,623 and 28,685 respectively.
Source: “Sector 44: EC0744I2: Retail Trade: Industry Series: Preliminary Comparative Statistics for the United States (2002 NAICS Basis): 2007 and 2002,” 2007 Economic Census, available online here. The data from 1997 are from the 1997 Economic Census, after conversion of the data to a NAICS 2002 basis.
Original source: U.S. Department of Commerce, Bureau of the Census.

Valentine’s Day as a Market

Based on a survey conducted for the National Retail Federation, spending on Valentine’s Day is expected to be up in 2011 after two down years in 2009 and 2010. For all those in the business of selling flowers, cards, chocolates, champagne, footie pajamas, and romantic dinners out, here’s hoping the forecast is correct!

Geographic reference: United States
Year: 2005 and 2011 forecast
Market size: $13.19 and $15.7 billion respectively.
Source: “Men to Pay High Price for Love on Valentine’s Day,” an NRF press release from January 31, 2006, available online here. The estimate for 2011 is from the same source, 2011 Valentine’s Day Consumer Intentions and Actions Survey, the press release for which is available here.
Original source: National Retail Federation and BIGresearch.

Book Wholesalers

The distribution network through which books get from the publisher to the reader is one that has been going through enormous change over the last few decades. First, the big box bookstores moved into a space previously occupied by smaller retailers. Then, Amazon got into the business and started serving as both a wholesaler and a retailer, but one without a store front, operating entirely online. Since then, the rise of the electronic book, or e-book, has further altered the way that books make their way to the reader. The landscape for book distribution seems to be in a state of constant change these days, much as the music industry experienced a decade ago. The figures that follow are for the industry designated by the NAICS code 42-4920: Book, Periodical, and Newspaper Merchant Wholesalers.

Geographic reference: United States
Years: 1997, 2002 and 2007
Market size: Number of Establishments: 3,257; 3,464 and 2,789 respectively.
Market size: Sales: $33.63; $30.90 and $28.32 billion respectively.
Market size: Employment: 89,309; 76,072 and 63,511 respectively.
Source: “Sector 42: EC0742I2: Wholesale Trade: Industry Series: Preliminary Comparative Statistics for the United States (2002 NAICS Basis): 2007 and 2002,” 2007 Economic Census, available online here. The data from 1997 are from the 1997 Economic Census.
Original source: U.S. Department of Commerce, Bureau of the Census.

Visitors to Public Gardens

Data show the number of visitors per year to public gardens in the United States. In many places the number of visitors to public gardens has declined in recent years. According to Rick Colbert, director of Tyler Arboretum in Pennsylvania, founded in 1825, “young families are not interested in being outside…. Kids today are much more comfortable behind a computer screen.” As a result, many public gardens are promoting their sustainability efforts, tapping into the theme of “going green”, which is popular with young people.

Geographic reference: United States
Year: 2009
Market size: 70 million
Source: W. Barksdale Maynard, “A Bold New Mission for Arboreta: Sustainability,” American Forests, Autumn 2010, pages 38-43

Halloween Market

The size of the market for all Halloween holiday spending is rather hard to measure as it incorporates many things: candy, snacks, costumes, pumpkins, scary decorations, etc. The results of a much-quoted survey undertaken by the National Retail Federation are what we present here. They represent an increase of 17% over estimated spending on Halloween in 2009. Shall we take this as a good sign, a sign of people feeling freer to spend money on nonessentials?

Happy Halloween!

Happy Halloween

Geographic reference: United States
Year: 2010
Market size: $5.8 billion
Source: “Halloween Spending Expected to Rise this Year,” Kansas City Star, October 11, 2010, available online here.
Original source: National Retail Federation

Commercial Casinos

Commercial casinos represent just over a third of the total gambling and gaming industry (37%). Indian casinos—which are counted separately and are not part of the commercial casino market as presented here—are a somewhat smaller portion of the overall gaming business but still represent 28% of that market. The size of the commercial casino industry listed here includes deepwater cruise ships and other waterborne casino operations.

Geographic reference: United States
Year: 2007
Market size: $34.41 billion, gross gambling revenue
Source: “Gaming Revenue: Current-Year Data,” available online here.
Original source: Christiansen Capital Advisors LLC

Gambling & Gaming Business

Measuring the market for gambling and gaming is tricky because of the variety of activities covered. Some studies will include aspects of the gaming industry that other studies exclude, an example being state run lotteries. Consequently, one sees citations that vary greatly about the size of the gaming business.

The measurement presented here is from the American Gaming Association, a trade association and lobbying group with offices in Washington, DC. This market size is based on gross gambling revenues for all of the following gaming types: Card Rooms, Commercial Casinos, Charitable Games and Bingo, Indian Casinos, Legal Bookmaking, Lotteries, and Pari-Mutuel Wagering.

Geographic reference: United States
Year: 2007
Market size: $92.27 billion, gross gambling revenue
Source: “Gaming Revenue: Current-Year Data,” available online here.
Original source: Christiansen Capital Advisors LLC

Motion Picture and Video Industries

This industry comprises the whole large group of companies engaged primarily in the production and/or distribution of motion pictures, videos, television programs, or commercials; in the exhibition of motion pictures; or in the provision of postproduction and related services.

Geographic reference: United States
Year: 2002 and 2007
Market size: $62 billion and $80 billion respectively
Source: 2002 Economic Census and 2007 Economic Census, October 30, 2009. The 2007 data on the Information sector is available online here.
Original source: U.S. Bureau of the Census

Fireworks!

In 2008, consumer fireworks represented 87% of total consumption with display fireworks the remaining 13%. Have fun celebrating on the 4th!

Geographic reference: United States
Year: 2008
Market size: $940 million and 213.2 million pounds
Source: “U.S. Fireworks Consumption Figures,” available online here.
Original source: U.S. Department of Commerce

National Park Visitors

The size of the market for national parks is provided based on visitors to these parks annually. The most visited of the national parks is Golden Gate National Park in San Francisco, California.

Geographic reference: United States
Year: 2009
Market size: 94.5 million visitors
Source: “National Park Summary Visitors Report,” May 2010 available online here.

DVD Audio and Super Audio CD Market

Data show shipments of titles in the DVD Audio and Super Audio CD formats. While these formats provide higher-quality audio than CDs or MP3s they are losing market share rapidly.

Geographic reference: United States
Year: 2003 and 2009
Market size: 1,700,000 and 200,000 respectively
Source: Joseph Plambeck, “In Mobile Age, Sound Quality Steps Back,” The New York Times, May 9, 2010 available online here.
Original source: Recording Industry Association of America

Size of the Drive-in Movie Market

While drive-in movies have declined greatly since their heyday in the mid-1950s, when 5,000 such theaters were operated, there has been some small growth in the industry since the 1990s. In 2007, 6 new drive-in theaters were built in the United States.

Geographic reference: World
Year: 2007
Market size: 483 theaters
Source: “Interactive Statistics for 2007,” December 2009 available online here.