Auto Industry Economic Impact

auto industry camaroGeneral Motors’ announcement of the 2019 closing of assembly plants in North America created uncertainty for 14,000 families in Michigan, Ohio, Maryland and Oshawa, Ontario, Canada. These 14,000, both blue-collar and white-collar workers alike, are direct employees of General Motors. But sadness and uncertainty reverberated throughout many industries. According to the Center for Automotive Research, in the United States, more than 7 million private sector jobs are supported by the auto industry. Steel mills, logistics companies, grocery stores, restaurants, gas stations, and child care centers are just some of the businesses negatively impacted by plant shutdowns and layoffs,1 as automotive companies buy fewer supplies and services and workers cut back on expenses. Businesses in close proximity to auto plants, those that rely on workers spending money in their stores and restaurants, are more heavily impacted than some when plants close.

Today’s market size shows the amount of annual compensation of employees working in industries supported by the auto industry in the United States. In 2014, the last year for which data are available, 570,000 jobs were supported by the auto industry in Michigan, where auto industry employment accounts for more than 11% of the labor force.

1 According to General Motors, some of the workers that will be laid off at General Motors’ plants will be offered jobs at other manufacturing facilities either in Michigan or in another state.

Geographic reference: United States
Year: 2018
Market size: $500 billion
Sources: Eric D. Lawrence, “Pain of GM Closures Is Far-Reaching,” Lansing State Journal, December 3, 2018, page 6A; Jamie L. LaReau, “General Motors to Close Detroit, Ohio, Canada Plants,” Detroit Free Press, November 26, 2018 available online here.
Original source: Center for Automotive Research
Image source: AnSICHThoch3, “auto-chevrolet-camaro-road-1112183,” Pixabay, January 2, 2016 available online here. Use of image does not constitute endorsement.


Classic Car Bubble?

ClassicCar

The classic and collector car market in the United States has been strong for many years, slowing during the recession of 2007–2009 but recovering quickly thereafter. In fact, in the summer of 2013 an all-time record was broken, surpassing the prior record by $13 million when a Mercedes W196 sold at auction for $29.6 million. But any market for collectibles fluctuates, such markets are, by definition, speculative. What concerns some in the trade is the overall supply and demand balance.

The concern has to do with the fact that approximately 58% of the classic cars in the United States are owned by baby boomers. It is anticipated, based on historical ownership patterns, that baby boomers will begin to sell off their collections over the next twenty years. Thus, the question arises, is there a strong enough market for these cars, one that can withstand a flood of mid 20th century American cars without causing prices to fall sharply?

Today’s market size is the number of classic and collector cars in the United States in 2013.

Geographic reference: United States
Year: 2013
Market size: 5 million cars
Source: Rob Sass, “For Sale by Boomer,” Car and Driver, March 2014, pages 76-79.
Original source: Hagerty Group
Posted on February 14, 2014

Used Cars in China

The auto market in China, like most markets, is growing rapidly. Demand for cars has been growing annually as the purchasing power of millions of Chinese people increases as that country becomes an economic powerhouse. But because the mass market for automobiles in China is relatively new—having taken off in earnest starting four or five years ago, according to the first source listed below—a used car market is an even newer thing in China. It takes, on average, four years for a new car to be traded in for an “upgrade” and thus become available for resale as a used car.

Today’s market size is the estimated number of used cars sold in China in 2012 as well as a forecast for the number of used cars that will be sold in 2016 and 2020. For comparison purposes, let us point out that in the United States in 2012, used car sales were nearly three times greater than new car sales whereas in China, used car sales were only one-third the number of new car sales. The used car market in China is very young, with lots of room to grow.

Geographic reference: China
Year: 2012 and forecasts for 2016 and 2020
Market size: 4.8, 10.0 and 20.0 million respectively
Sources: (1) Kelvin Chan, “Auto Sales Boom Spawns a Growing Used Car Market in China,” Detroit Free Press, November 27, 2013, available online here. (2) Cliff Atiyeh, Used-car Sales Climb as Americans Hold Onto Older Vehicles,” MSN.com, February 4, 2013, available online here.
Original source: Changan Ford, the U.S. company’s China joint venture
Posted on December 11, 2013

Cars in Europe

Car1

The auto market in Europe is far from recovering from the sharp decline in sales that occurred after 2007 and the financial crisis that hit in 2008. Industry forecasts suggest that it has yet to bottom out and many projections have the industry selling fewer cars in 2020 than it did in 2007. Meanwhile, in the United States this year, the auto market is expected to reach 99.4% of the record sales reached in 2007, based on unit sales, assuming the dysfunction in the nation’s capital does not derail the economy.

Today’s market size is the number of cars sold in the European Union—plus Iceland, Norway and Switzerland—in 2007 (peak year for sales), 2013 (based on mid-year projections), and 2020 (forecast).

Geographic reference: European Union, Iceland, Norway and Switzerland
Year: 2007, 2013, 2020
Market size: 16.0 million, 12.1 million, and 14.8 million respectively
Source: “Automakers, Analysts Disagree On When Europe’s Sales Will Finally Rebound,” Automotive News Europe, August 8, 2013, available online here. Vanessa Fuhrmans, “Europe’s Car Makers Spin Their Wheels,” The Wall Street Journal, October 1, 2013, page A1.
Original source: IHS Automotive
Posted on October 10, 2013

Wireless Systems in Cars

Nearly all automakers offer some sort of wireless network in their cars, such as General Motors’ OnStar and Ford’s SYNC. Data show the estimated revenue from wireless devices in cars in 2013. This figure is projected to increase tenfold by 2025.

Geographic reference: United States
Year: 2013
Market size: $2.5 billion
Source: Andy Greenberg, “Digital Carjackers,” Forbes, August 12, 2013, pages 44-46
Original source: GSMA, a mobile industry trade group
Posted on August, 15, 2013

Map Apps

According to IHS Automotive, one in four U.S. cars now comes with a navigation system. Globally, installations of dashboard navigation systems are estimated to reach 13.8 million by the end of 2013. Typically, automakers charge between $500 to more than $2,000 for these systems. Even standalone GPS systems tend to cost hundreds of dollars. In addition to high cost, these systems come preloaded with maps and are not connected to the internet, thereby making them more difficult to update. In some cases, a trip to the dealership is necessary.

In contrast, smartphone and tablet map apps are internet-connected, easy to update, often give real-time traffic information and in some cases can be downloaded for free. In 2012, 47% of car owners said that they used a smartphone map app while driving, up from 37% in 2011. Makers of dashboard navigation systems have taken notice. General Motors’ OnStar, Garmin, and TomTom all have created map apps of their own, ranging in price from $36 to $150. In some cases, these apps run both on mobile devices and on a car’s dashboard.

Today’s market size is the number of map app downloads in the U.S. in May 2013, an 11% increase from the total downloaded in May 2012.

Geographic reference: United States
Year: May 2013
Market size: 79.1 million
Source: Keith Naughton, “OnStar, Garmin Try to Keep Pace with Waze, Other Free Navigation Apps,” Bloomberg Businessweek, July 25, 2013, available online here.
Original source: ComScore
Posted on August 13, 2013

Used Hybrid Cars

The used car market is doing quite well having benefited from the sudden decline of automobile leases during the aftermath of the financial crisis of 2008–2009. Expiring auto leases are a primary source of cars feeding the used car market. Hybrid gas-electric cars are a small subset of the overall used car market, primarily because they are a small part of the overall market. Another reason has to do with the fact that hybrid gas-electric cars need to have new battery systems installed after either five years of use or 100,000 miles, on average. The price of these battery systems, depending on the vehicle, run anywhere from $2,000 to $6,000.

Today’s market size is the estimated number of used hybrid gas-electric vehicles on the U.S. used car market in early 2013.

Geographic reference: United States
Year: 2013
Market size: 415,000 vehicles
Source: Ann Carrns, “Tips for Buying and Servicing a Used Hybrid Car,” The New York Times, May 30, 2013, available online here.
Original Source: Edmonds.com
Posted on June 4, 2013

Used Car Market

Today’s market size is the number of used cars sold in the United States in 2012, a quantity that is 5% above the 2011 total. Many large-scale trends and factors play into the market for used vehicles, many of them related directly to how the new car market is doing. Therefore, to suggest that the losses from a natural disaster might play a role in the overall annual market for used cars is probably somewhat overstating matters. However, the loss of a quarter million cars in the hurricane that hit the east coast of the United States last fall, Hurricane Sandy, may well have played a small role in the 5% rise in used car sales during 2012. It may also bode well for used car sales in 2013.

Geographic reference: United States
Year: 2012
Market size: 40.5 million cars
Source: Mike Ramsey, “Amid New Car Boom, Used Cars Are Gold,” The Wall Street Journal, February 21, 2013, available online here. Michael Winerip, “Not Just a Car, but a Storm Victim, Too,” The New York Times, March 17, 2013, page S12.
Original source: Manheim Consulting and National Insurance Crime Bureau
Posted on March 22, 2013

Indian Automobile Makers

Image of a street in India

Two- and three-wheel vehicles far outnumber four-wheel vehicles in India. Nonetheless, the automobile manufacturing industry in that country is growing rapidly, it is expected that by 2015 the number of four-wheel vehicles produced in India will be twice the figure produced in 2012.

Today’s market size is the number of automobiles made in India in 2012 for the domestic market as well as the number of two- and three-wheel vehicles.

Geographic reference: India
Year: 2012
Market size: 3.1 million automobiles and 16.5 million two- and three- wheel vehicles.
Source: Jonny Williams, Digital Manufacturing, March 12, 2013, available online here. The photo above comes from the Enjoy India website, here, with our thanks.
Posted on March 13, 2013

Plug-In, Electric Cars

Tesla booth at Detroit Auto Show

Today’s market size is the number of electric plug-in cars purchased in the United States in 2012. Plug-in electric cars come in two varieties, an all-electric version like the Tesla Model S and a hybrid electric and gas engine version such as the Chevy Volt. The electric and gas engine variety is similar to more conventional hybrid cars but has a much larger battery and can, as the name implies, be plugged into an electric outlet for charging. By contrast, most cars referred to simply as hybrids (non-plug-ins) use a battery system to assists the primary gas engine and they charge that battery internally by capturing energy from the operation of the engine itself.

The world of cars is changing, perhaps slowly but it is changing. In 2012, plug-in electrics represented 0.51% of all sales of automobiles in the United States and 11.6% of all hybrid car sales.

Geographic reference: United States
Year: 2012
Market size: 50,804 plug-in electric cars
Source: JC Reindl, “LG CHEM: Battery Industry’s Future Questioned After Report,” Detroit Free Press, February 17, 2013, page 1.
Posted on February 20, 2013

Used Car Dealers

U.S. Used Car Dealer Sales, 1992-2011

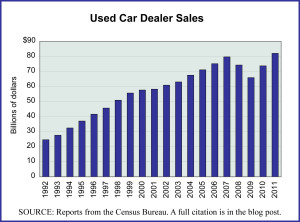
The U.S. auto industry was hit particularly hard by the last recession and financial crisis. For those selling used cars, the recession was less severe than for car manufacturers and new car dealers. As an industry, used car dealers saw a downturn in sales for two years (2008 and 2009) but by 2011 had completely recovered and exceeded their pre-recession sales while new car dealers were still 10% off of their 2007 peak sales.

The graph shows annual sales for U.S. used car dealers from 1992 through 2011. As can be seen in the graph, while the used car industry can usually weather a recession well, as demand for used cars is less impacted by an overall downturn than are sales of new cars, the recession from late 2007 through 2009 was not a “normal” recession. Financial system crises, as the one that started in 2008, lead to more severe and long-term troubles for the economy and they even impact industries that are immune to cyclical recessions.

Geographic reference: United States
Year: 2011
Market size: $82.07 billion
Source: “Estimates of Monthly Retail and Food Services Sales by Kind of Business: 2011,” Monthly Retail Trade Report, November 14, 2012, data for the NAICS industry 44112. The graph was sourced from the same report as well as the Annual Retail Trade Survey 2010, March 30, 2012. Both reports are available online at the Census Bureau website.
Original source: U.S. Department of Commerce, Bureau of the Census
Posted on November 19, 2012

Classic Cars

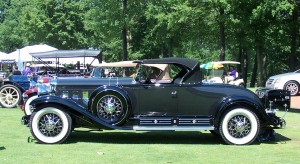
Concours d'Elegance, summer 2011, Michigan

The market for classic cars has been very strong over the last two decades in the United States. It is one of the niche markets used by the well-heeled as both an investment vehicle and a hobby. Today’s market size is the approximate value of classic car auction sale totals in 1995 and 2011.

Geographic reference: United States
Year: 1995 and 2011
Market size: $45 million and $500 million respectively
Source: Scott Rosenblatt, “Total Auction Sales,” Classic Cars: Your Portfolio’s Midlife Crisis, Credit Suisse, 2012, page 21, available online here.
Original source: Classic Car Auction Yearbook (data Historica Selecta)
Posted on October 23, 2012

Auto Sales in August

The business pages of major papers all over the United States today are reporting on U.S. auto and light truck sales in August 2011. What is interesting is the fact that based on a commonly used reporting technique—namely to compare sales in one month with the sales in that month one year earlier—sales in August 2011 look very good. They were 7.5% more than sales of autos and light trucks in August 2010 and 1.2% greater than sales in July 2011. The trend is definitely positive.

However, in times of sudden economic slowdown, or times of recovery after a precipitous decline these sorts of comparisons can be misleading. Daniel Gross put this situation very colorfully in a 2010 Slate article on the auto industry, saying “comparing August 2010 to August 2009 is a little like comparing today’s home run totals to those racked up in seasons when the sluggers were on steroids and the ball was juiced.” Worth noting is the fact that U.S. auto sales averaged 16 million units annually between 2000 and 2007. Based on sales through August of 2011, annual sales are estimated to reach 12.5 million for the year. The industry has been changed greatly by the last recession.

Geographic reference: United States
Year: August 2011
Market size: 1.07 million automobiles and light trucks
Source: Nick Bunkley, “Car Buyers Unfazed by Storms, Financial and Tropical, in August,” The New York Times, September 2, 2011, page B1, and Daniel Gross, “A Successful Turn,” Slate, September 2, 2010, available online here.
Original source: MotorIntelligence.com
Posted on August 9, 2011

Auto Repair Services

Several of us here have had reason lately to make large payments to auto mechanics. This, combined with the level of business apparent at our various auto repair shops, led us to wonder if businesses that do automotive repair and maintenance work were perhaps recovering more quickly from the great recession than other businesses in the service sector.

The future looks bright for automotive repair shops as the median age of automobiles in the United States continues to climb. According to a study by R.L. Polk Company, the median age of automobiles on the road in the United States grew 44% between 1990 and 2008, from 6.5 years to 9.4 years. And these median age figures do not include the changes that resulted in the aftermath of the 2008 financial crisis which had a devastating impact on new vehicle sales. Demand for automotive repair will only increase as the age of the fleet increases.

Today’s market size is based on the estimated revenue of all automotive repair and maintenance firms in the U.S. in 2001 and 2010. Worth noting, these revenue figures are for firms defined by the source as “employer firms,” and thus do not include all those involved in doing repair work on their own or on the side.

Geographic reference: United States
Year: 2001 and 2010
Market size: $76,518 million and $83,714 million respectively
Source: Yearbook 2010, “Table 10.1 Other Services (Except Public Administration, Religious, Labor, and Political Organizations, and Private Households) (NAICS 81) – Estimated Revenue for Employer Firms: 2001 through 2009,” Service Annual Survey 2009, page 198, issued in February 2011 and available online here. Preliminary data for 2010 are from early released reports from the Service Annual Survey 2010.
Original source: U.S. Department of Commerce, Economics and Statistics Administration, U.S. Census Bureau

Luxury Car Market

Rolls-Royce Hood

Today’s market size is the size of the market in China for luxury automobiles. According to the source, the leading brand of car sold in China in 2010 was the Audi which had the top two best selling models.

Geographic reference: China
Year: 2010
Market size: 458,976 luxury cars
Source: Thompson, Chrissie, “Chinese Bypassing Detroit When They Think Luxury,” Detroit Free Press, May 15, 2011, page 6B. The photo was taken at the 2011 International Auto Show in Detroit, Michigan and while it is not an Audi hood ornament, it is pretty.
Original source: JD Power and Associates

Vehicle Registrations

Here, we look at automobile registrations as well as light truck registrations. These vehicles are used for both personal and commercial purposes but can be seen as primarily vehicles for personal use.

Geographic reference: United States
Year: 2008
Market size: Automobiles, 137.1 million and Light Trucks, 101.2 million
Source: “United States Fast Facts,” State Transportation Statistics 2009, page V.
Original source: Research and Innovation Technology Administration, Bureau of Transportation Statistics, U.S. Department of Transportation

Airport Car Rental Market in the United States

The leading car rental firms in this market are Hertz (with a 26% market share), Avis (19%), National (12%), Enterprise (10%), Budget (10%), and Alamo (9%). The airport rental car market is one segment of the overall market and represents about half of the total U.S. car rental market.

Geographic reference: United States
Year: 2009
Market size: $10 billion
Source: “Hertz Investor Marketing,” February 10, 2010
Original source: Euromonitor