Minerals in Wyoming

Taxable value of WY minerals

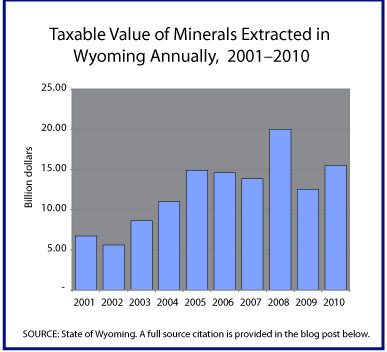
Mining and extraction industries in Wyoming saw a significant decline in 2009 after peaking in 2008 for the decade but 2010 saw a strong recovery over 2009. The graph shows taxable value for all minerals extracted annually in Wyoming from 2001 through 2010. Wyoming’s mineral wealth is providing the state with a strong base for recovery from the recession that began in December 2007.

Today’s market size is the total value of all minerals extracted in 2010. The minerals included in this total are oil, natural gas, coal, bentonite, trona, uranium, sand and gravel.

Geographic reference: United States
Year: 2001 and 2010
Market size: $6.74 and $15.49 billion respectively
Source: Barron, Joan, “State’s Mineral Valuation Booms,” Casper Star Tribune, June 1, 2011, page 1.
Original source: State of Wyoming

Agaricus & Specialty Mushrooms

There were 312 growers of agaricus and specialty mushrooms in the United States in the 2009-2010 growing season. Today’s market size is the estimated value of their crop of agaricus and specialty mushrooms. The State of Pennsylvania was the leading state for this crop with a 49.56% share of the total crop. California was the next largest producing state with a 20.78% share and Washington was the third largest with a 2.48% share.

Geographic reference: United States
Year: 2009-2010 Season
Market size: $924.86 million
Source: “Mushrooms,” one in a series of crop reports produced by the U.S. Department of Agriculture, last updated on August 19, 2010. Here is a link to the USDA report on mushrooms.
Original source: U.S. Agriculture Department (USDA)

Iron & Steel

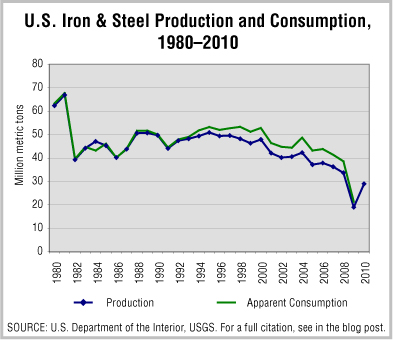
Iron & Steel in the U.S. over 30 years

The year 2010 saw a strong recovery for iron ore production in the United States after a particularly strong downturn in 2009. The market size presented today is the value of all iron and steel production in the country in 2010. The state of Indiana accounted for 24% of the total raw steel production, followed by Ohio with 10%, and Michigan and Pennsylvania each accounting for 7%.

The graphic shows iron and steel production and apparent consumption figures for a period of 30 years, from 1980 to 2010. Apparent consumption is a calculated figure based on production, plus imports, minus exports plus or minus change in stock.

Geographic reference: United States
Year: 2010
Market size: $139 billion
Source: “Iron and Steel, Statistics and Information,” Mineral Industry Survey, a series of reports produced by the U.S.Geological Survey, made available online and last updated on May 19, 2011. Here is a link to the USGS site.
Original source: U.S. Department of the Interior, USGS

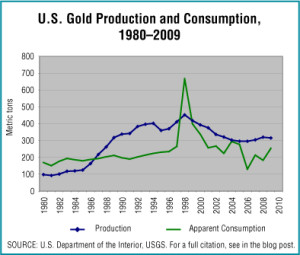
Gold

Gold has long been considered essentially a monetary metal. In the late 20th century, however, gold’s superior electrical conductivity and resistance to corrosion caused it to emerge as an essential industrial metal. Gold now performs critical functions in computers, communications equipment, jet aircraft engines, and a host of other products, although the largest single use for gold is still in the production of jewelry.

The trade in gold has been robust of late—particularly since the financial crisis that began with the last recession and the bursting of the housing bubble—and gold prices have risen sharply. The estimated price in 2010 was 23 percent higher than in 2009, hitting a high in November 2010 of $1,424.07 per troy ounce.

The graphic shows gold production and apparent consumption figures for a period of 30 years, from 1980 to 2010. Apparent consumption is a calculated figure based on production, plus imports, minus exports plus or minus change in stock.

Geographic reference: United States
Year: 2010
Market size: $8.9 billion
Source: “Gold, Statistics and Information,” Mineral Industry Survey, a series of reports produced by the U.S.Geological Survey, made available online and last updated on May 19, 2011. Here is a link to the USGS site.
Original source: U.S. Department of the Interior, USGS

VOIP Providers

Today’s market size is based on the revenues earned by Voice Over Internet Protocol (VOIP) providers in 2010. VOIP saw a tremendous 194 percent growth from 2000 to 2010. This industry is expected to grow another 17.4 percent from 2010 to 2016.

Geographic reference: United States
Year: 2010
Market size:: $12.5 billion
Source: Phil Izzo, “Top 10 Thriving Industries,” The Wall Street Journal, May 16, 2011, available online here
Original source: IBIS World

Peat

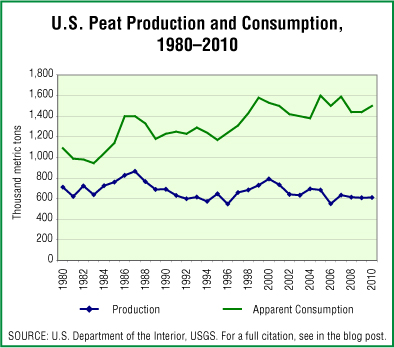
Peat poruction and consumption

Peat is a natural and renewable organic material that is grown in shallow wetlands, primarily in the Northern Hemisphere. It is used widely as a plant-growth medium because of its unusual ability to both retain water and promote drainage. Peat also has industrial uses as a filtration medium to remove toxins in water processing and as an effective absorbent used in the clean-up of fuel and oil spills.

Today’s market size is the estimated f.o.b. plant value of marketable peat from plants in the United States. The graphic provides a look at peat production and consumption over a thirty year period, from 1980 to 2010.

Geographic reference: United States
Year: 2010
Market size: $16 million
Source: “Peat, Statistics and Information,” Mineral Industry Survey, a series of reports produced by the U.S.Geological Survey, made available online and last updated on May 19, 2011. Here is a link to the USGS site.
Original source: U.S. Department of the Interior, USGS

Manufactured Home Dealers

Data presented are revenues for 2010. The industry did well during the housing boom, but since then has faltered. Over the entire period from 2000 to 2010, the industry declined 73.7 percent and is expected to decline another 62 percent from 2010 to 2016.

Geographic reference: United States
Year: 2010
Market size: $4.5 billion
Source: Phil Izzo, “Top 10 Dying Industries,” The Wall Street Journal, March 28, 2011, available online here.
Original source: IBIS World

Copper

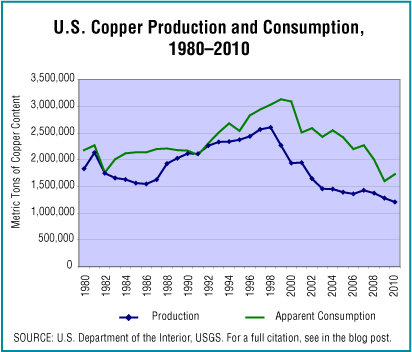
Copper mining history in the U.S.

The price of copper has been rising for a few years now so a 5% decline in the quantity of copper mined in the United States between 2009 and 2010 did not result in a loss of value of the total copper mined. Today’s market size is the quantity and value of copper mined in the United States in 2010. The graphic shows production and apparent consumption figures for a period of 30 years, from 1980 to 2010. Apparent consumption is a calculated figure based on production, plus imports, minus exports plus or minus change in stock.

Geographic reference: United States
Year: 2010
Market size: 1.12 million metric tons valued at $8.4 billion
Source: “Copper,” Mineral Commodity Summary 2011, January 2011, page 48, available online here.
Original source: U.S. Department of the Interior, USGS

National Flood Insurance Program

With flood waters inundating so many in the Mississippi River Valley and with spillways being opened to try and mitigate the damage further downstream, we turn today to the size of the United State’s National Flood Insurance Program (NFIP), run by the Federal Emergency Management Agency (FEMA). The program was designed to provide a shared pool of resources that could help to reduce the high cost of disaster assistance resulting from flooding along the national waterways.

NFIP is not only an insurance program but a floodplain management and mapping program. Participation in NFIP is voluntary at the community level, with a couple of exceptions. One is for properties located in officially designated flood plains on which a mortgage is held. Banks require the purchase of flood insurance for such properties on which they hold the mortgage. Another exception to the voluntary nature of this program is the fact that those who receive financial assistance from the federal government following a Presidential declaration of disaster may then be required to purchase flood insurance through NFIP.

Today’s market size is the total amount paid in premiums to the NFIP in 1990 and 2010 as well as the number of policies in force in those years.

Geographic reference: United States
Year: 1990 and 2010
Market size: $672.8 million from 2.48 million policies and $3,353.8 million on 5.65 million policies respectively
Source: “Statistics by Calendar Year,” data made available online here by FEMA.
Original source: U.S. Department of Homeland Secutiry, Federal Emergency Management Agency

Functional Foods Market

At the most elemental level, we eat to supply our bodies with the nutrients necessary to maintain life. So by definition, food has a rather important function. However, the term functional food refers to processed foods and drinks that are marketed as having “health-promoting or wellness-maintaining properties”. The labels on such foods often include messages such as heart healthy, helps reduce cholesterol, clinically shown to improve kids attentiveness, helps support your immune system or your digestive system or your nervous system, etc.

Geographic reference: United States
Year: 2009
Market size: $37.3 billion
Source: Singer, Natasha, “Food With Benefits, or So They Say,” The New York Times, May 15, 2011, page B1, available online here.
Original source: Nutritional Business Journal

Luxury Car Market

Rolls-Royce Hood

Today’s market size is the size of the market in China for luxury automobiles. According to the source, the leading brand of car sold in China in 2010 was the Audi which had the top two best selling models.

Geographic reference: China
Year: 2010
Market size: 458,976 luxury cars
Source: Thompson, Chrissie, “Chinese Bypassing Detroit When They Think Luxury,” Detroit Free Press, May 15, 2011, page 6B. The photo was taken at the 2011 International Auto Show in Detroit, Michigan and while it is not an Audi hood ornament, it is pretty.
Original source: JD Power and Associates

Space Shuttle Services

Photo from NASA

Today’s market size is a bit of an exercise in guessing the low-end, ballpark size of a market for space shuttle services for the coming few years. We base this estimate on three things: (1) NASA’s labor commitments to the International Space Station (ISS) between 2011 and 2017, (2) the per astronaut cost to NASA of a ride to and from the ISS on the Russian Soyuz Spacecraft, and (3) a contract signed by NASA to contract with SpaceX, a private company, to provide cargo delivery services to the ISS. Clearly, this simple estimate is only an approximation of the potential of this market. Defined more broadly—to include, for example, what is often called space tourism—the market size in coming years is much larger.

What we present here is the minimum market size for shuttle services to the ISS based on NASA demand that grows out of the United State’s closing down of its own Shuttle Program.

Happy final journey, Shuttle Endeavor!

Geographic reference: World
Year: 2012—2017
Market size: $3.18 Billion
Source: “NASA’s Cost to Hitch a Ride on Russian Rocket Rises,” CFNews13.com, March 15, 2011, available online here. “How Many Astronauts Does NASA Need?” Universe Today, December 7, 2010, available online here. “The Shuttle Program Is Winding Down—What Next?” PCWorld, May 16, 2011, available online here. Finally, the photo used above is from NASA’s site here.

Native American Tribal Casino Market

The recession of 2008 and 2009 took its toll on just about every industry, including the gaming industry. According to the source, this industry saw declines in 2009 but those declines were smaller than the declines experienced by commercial gaming nationally. Today’s market size is the size of the gaming industry run by native American tribes throughout the United States in 2009.

Geographic reference: United States
Year: 2009
Market size: Gaming Facilities: 446, Revenues: $26.4 billion
Source: Meister, Dr. Alan, Indian Gaming Industry Report, 2011 edition, highlights of which are provided in a press release about the report available online here.
Original source: Casino City Press

Crude Oil Supply

Based on a report recently issued by the U.S. Energy Information Administration, the supply of crude oil for U.S. energy needs, from all sources, is anticipated to decline between 2009 and 2025. On a per capita basis this decline is rather large, 15.3%. This is because the population is projected to increase by 16.4% between 2009 and 2025 while the supply of crude oil is forecast to decline by 1.39%. Obviously, new sources of petroleum supply will be (are) in high demand, not to mention all other forms of energy.

Today’s market size is the daily supply in millions of barrels per day (mbpd) of crude oil in the United States, for 2009 and projected for 2025.

Geographic reference: United States
Year: 2009 and 2025
Market size: In 2009, 14.33 mbpd and in 2025, 14.13 mbpd
Source: “Table C4. Liquid Fuel Supply and Disposition,” Annual Energy Outlook 2011, With Projections to 2035, April 2011, page 175, available online here.
Original source: U.S. Department of Energy, Energy Information Administration

Video Games

The world of gaming is big and it is growing. Today’s market size is the number of video games sold annually. Leading video game publishers include Nintendo with around 19% of the market in 2010, Electronic Arts (12%), Activision (9.6%) and Ubisoft (7%).

Geographic reference: World
Year: 2000, 2005 and 2010
Market size: In millions of units: 43.7, 128.7 and 651.9 respectively
Source: “Worldwide Yearly Chart,” a report on the industry by VGChartz made available online here.
Original source: VGChartz Network

Cement

Cement Production Graph

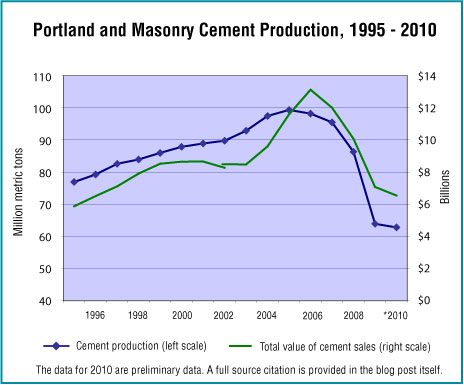
A decade plus worth of production data on the cement industry shows a pattern with which we are familiar, the build-up and crash of the housing market. Most of the construction materials industries have seen similar patterns of growth and decline in the 2000s. Early data on 2010 show that sales of cement in that year reached a 27 year low, falling 45% (59 million metric tons) off the high reached in 2005.

The market size presented below is the number of metric tons of portland and masonry cement produced in the United States in 2010 and the approximate value of that cement if shipped from the mill the same year.

Geographic reference: United States
Year: 2010
Market size: 62.8 million metric tons with an approximate value of $5.7 billion
Source: “Cement,” part of an annual series titled Mineral Commodities Summaries, published by the U.S. Geographical Survey and available online here.
Original source: U.S. Department of the Interior, USGS

Sodium Sulfate

Sodium sulfate is an inorganic chemical that looks like a white powder. Its chemical symbol is NA2 SO4. Sodium sulfate is used in the production of many products. Soaps and detergents account for the largest single share (35%) of its consumption. Other end uses of sodium sulfate include glass manufacturing which accounts for 18% of consumption, the paper and pulp industry uses 15%, and textile production accounts for 4% of consumption in the United States. The remaining 28% of consumption is divided among many smaller consuming end users.

The market size presented below is the estimated total value of all natural and synthetic sodium sulfate sold in 2010.

Geographic reference: United States
Year: 2010
Market size: $42 Million
Source: “Sodium Sulfate Statistics Information,” part of an annual series titled Mineral Commodities Summaries, published by the U.S. Geographical Survey and available online here.
Original source: U.S. Department of the Interior, USGS

Barges

Our thoughts turn to those living along the nation’s riverways as news of rising waters and extensive flooding are coming in from all over the Midwest and East Coast. The inland and intercoastal waterway as an important transportation highway then comes to mind, a highway on which hundreds of millions of tons of cargo move annually valued at over $75 billion. Much of this cargo is moved in barges—non-self-propelled vessels—much like rail cars for the waterway system. Barges are tied together and moved through the system by tow boats. Barges are the most energy efficient way to move things. On a ton-mile per gallon basis, (miles per gallon carrying one ton of cargo) trucks get 155 miles, rail transport gets 413 miles and inland towing gets 576 miles per gallon.

Geographic reference: United States
Year: 2008
Market size: 32,052 barges
Source: “TABLE 2: Summary of the United States Flag Passenger and Cargo Vessels Operating or Availalble for Operation by Year,” Waterborne Transportation of the United States, November 16, 2009, available online here. Energy costs per mode of transportation data comes from a report put out by the Kentucky Association of Riverports, available online here. Another Army Corp of Enginners report, titled Inland Waterway Navigation, Value to the Nation, highlights many interesting facts about the inland waterway, including how water transportation compares with other modes in terms of efficiency. It is available online here.
Original source: U.S. Army Corp of Engineers

Digital Publishing Market

UK books

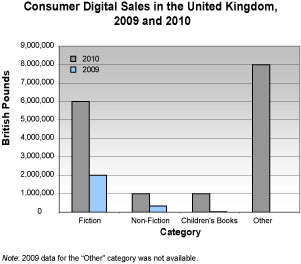
Data show combined digital sales in the United Kingdom, including academic, professional, school, and consumer digital downloads and e-books. Academic and professional digital sales accounted for £84 million. Consumer sales, which includes fiction, non-fiction, and children’s books, were £16 million. Of that £16 million, e-book sales accounted for £13 million. The graph to the right breaks down consumer digital sales by category.

Geographic reference: United Kingdom
Year: 2010
Market size: £120 Million
Source: Philip Jones, “Digital Sales Now Worth 6%, as E-books Grow 300% in 2010,” TheBookseller.com, March 5, 2011 available online.
Original source: Publishers Association

Librarian Corp

In an era which defines itself as the “Information Age,” it should come as no surprise that libraries have seen their usage numbers increasing annually for a decade. Today’s market size looks at the Librarian Corp—number of librarians working as librarians in the United States in 2008 and forecasted to be working in 2018 based on projections by the Bureau of Labor Statistics.

Geographic reference: United States
Year: 2008 and 2018
Market size: 159,900 and 172,400 respectively
Source: “Librarians,” Occupational Outlook Handbook, 2010-2011 Edition, December 3, 2010, available on the BLS web site here.
Original source: U.S. Department of Labor, Bureau of Labor Statistics