Home Entertainment Market

Home Entertainment Spending, 2000-2010

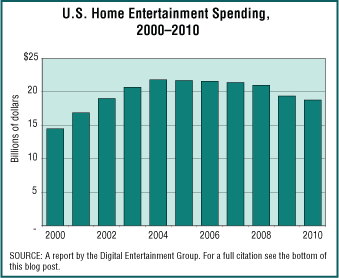
Today’s market size is the value of spending on the home entertainment segment related to films and all forms of videos that are rented and purchased, on DVD, CD, and downloaded electronically. The graph shows how this market has fared for the first decade of this century and shows that even the strong home entertainment segment has seen declines during the recession that started in December 2007. Actually, spending in this market peaked in 2004 and 2005 and has declined slightly every year since then.

Geographic reference: United States
Year: 2010
Market size: $18.8 billion
Source: “DEG Year-End 2010 Home Entertainment Report,” a report produced by the industry-funded nonprofit corporation Digital Entertainment Group. The report is available online here.

NASCAR Attendance

The first decade of this century has been one of great change for auto racing, the sport we call NASCAR (National Association for Stock Car Auto Racing). TV audience ratings have been falling and despite ticket price reductions, so has attendance at NASCAR races since peaking in 2006. The struggles of the auto industry in general may be part of the pall which seems to have fallen upon this sport. Some people blame changes made to increase the safety of the vehicles after the death of one of the sports’ most recognizable drivers, Dale Earnhardt Jr., during a race in 2001 for the declines in NASCAR audiences. Others suspect the recession is having a harder impact on fans of NASCAR than it is on fans of other sports. Whatever the cause, the sport is, for now, in decline.

Today’s market size is the estimated attendance at NASCAR races in the United States for the 2006 and 2010 seasons.

Geographic reference: United States
Year: 2006 and 2010
Market size: 4.6 and 3.6 million respectively
Source: Nate Ryan, “Action on Track Isn’t Helping NASCAR Attendance, Ratings,” USA Today, February 18, 2011, page 2A.
Original source: NASCAR estimates

Lottery Ticket Sales

The United States does not have an actual national lottery, as many nations do. That is not to say, however, that government-sponsored gambling is not a big business in the United States. Here, lotteries are operated at the state level. Total sale of lottery tickets in the United States, in all their many forms—daily numbers, pull tabs, scratch off cards, Keno, Powerball, Mega Millions, etc.—is today’s market size.

In all, 43 states have a lottery and some count 44 by including two Arkansas lotteries, one being the Arkansas Scholarship Lottery which is relatively new, having started in September of 2009. Other lotteries included in the calculation of the total national market are lotteries in the District of Columbia, Puerto Rico and the Virgin Islands. States with the largest sale of lottery tickets are New York, Massachusetts, Florida, Texas, Georgia and California which together accounted for 42.3% of lottery ticket sales nationally. Worth noting is the fact that this percentage is only slightly higher than these states’ combined population relative to the total U.S. population. Together, the populations of these six states represented 38.1% of the total U.S. population in 2010.

Geographic reference: United States
Year: 2010
Market size: $62.85 billion
Source: Patricia A. McQueen, “That Magic Word—’Growth’—Is Spoken Again as Most U.S. Lotteries Post Gains in Annual Sales,” Casino Journal, October 2010, page 8. The Federal government provides a page on its USA.gov website with links to all the state lottery websites for more details by state. That site is available here.

e-Education—Students Enrolled in Online Courses

Enrollment in online courses

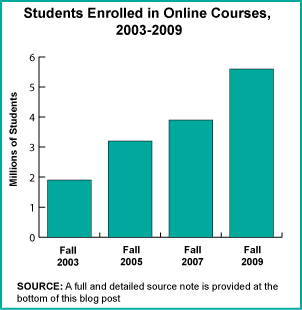
The number of students taking at least some of their classes online has risen steadily throughout the first decade of the 21st Century. In 2003, 11.2% of college and university students took at least one class online. By 2009, 27.4% did. The chart at the right shows the growth in the number of students enrolled in at least one online course in the Fall of each year.

Geographic reference: United States
Year: 2003 and 2009
Market size: Approximately 1.9 million and 5.6 million students respectively

Source: “Entering the Mainstream: The Quality and Extent of Online Education in the United States, 2003 and 2004,” [Abstract], Sloan Consortium, available online here; “Survey Reports: Online Education Grows by Almost a Million Students,” [Abstract], Sloan Consortium, available online here; “Table 176. Total Fall Enrollment in Degree-Granting Institutions, by Level of Enrollment, Sex, Attendance Status, and Type and Control of Institution: 2003,” Digest of Education Statistics: 2005, Spring 2004, available online here; “Table 202. Total Fall Enrollment in Degree-Granting Institutions, by Level of Enrollment, Sex, Attendance Status, and Type and Control of Institution: 2009,” Digest of Education Statistics: 2010, September 2010, available online here.

Graph Source: “Entering the Mainstream: The Quality and Extent of Online Education in the United States, 2003 and 2004,” [Abstract], Sloan Consortium, available online here; “Making the Grade: Online Education in the United States: 2006,” [Abstract], Sloan Consortium, available online here; “Staying the Course — Online Education in the United States, 2008,” [Abstract], Sloan Consortium, available online here; “Survey Reports: Online Education Grows by Almost a Million Students,” [Abstract], Sloan Consortium, available online here.

Financial Information

The market for financial information can be defined in many ways. Most often it is understood to be the market used by investors who wish to study the stock market with an eye on decisions related to whether to invest in, and when to invest in, a particular company’s stock, a fund of stocks, or a particular industrial sector. The leaders in the field of financial information are Thomson Reuters and Bloomberg. Today’s market size is the estimated total worldwide of money spent on financial information in 2008.

Geographic reference: World
Year: 2008
Market size: $23.01 billion
Source: “Burton-Taylor Data Indicates Challenging Year for Thomson Reuters, Bloomberg and Financial Information/Analysis Market,” Press Release dated February 18, 2009 and available online here.
Original source: Burton-Taylor International Consulting L.L.C.

Time Banks

In the 1980s while at the London School of Economics and Political Science, Dr. Edgar S. Cahn, a civil rights lawyer and activist, conceived the time banking system, a modern-day bartering system. For each hour members provide services to other members, they are credited with one hour of time that they can then use to request services from other members. Cahn came back to the United States to implement his idea and time banks popped up all across the USA in inner city neighborhoods over the next decade.

Soon Japan took interest and by the mid-1990s interest was building in the United Kingdom. The first time bank in the United Kingdom was started in 1998. According to TimeBanking UK, there are currently hundreds of time banks—although in a modified version from what Cahn conceived—operating in Japan. In the United Kingdom there are 105 active time banks and 131 in development. Since then, time banking has become popular in many more countries.

The market size presented below represents the number of time banks in the United States that are members of TimeBanks USA (founded by Edgar S. Cahn) and the MI Alliance of Timebanks.

Geographic reference: United States
Year: 2011
Market size: 92
Source: “TimeBanks USA Member Directory,” TimeBanks USA, available online here; “TimeBanks throughout Michigan,” MI Alliance of Timebanks, available online here; “About > History,” TimeBanking UK, available online here; “About Time Banking UK,” TimeBanking UK, available online here; “‘TimeBanks’ Sprouting Up in Metro Detroit,” CBS Detroit, June 22, 2011, available online here.

The Public Cloud

Cloud computing is, in the simplest terms, the use of a remote location, accessible through the Internet, to store the data and applications used on a computer. We discuss this market in more detail in a post from May 3rd. Today’s market size is the size of the public cloud which is defined by the source as a service that is commercially offered to an “unrestricted marketplace of potential users.”

Geographic reference: World
Year: 2010 and forecast for 2015
Market size: $21.5 and $72.9 billion respectively
Source: Larry Dignan, “IDC: Public Cloud Market Will Hit $72.9 Billion in 2015,” ZDNet, June 20, 2011, available online here.
Original source: IDC

Recreational Boating

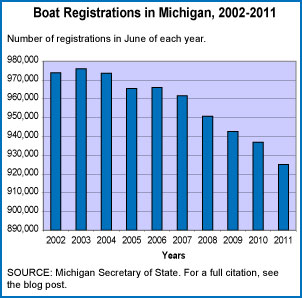
Boat Registrations in Michigan

The market size reflects the amount spent on new boats, boating accessories, engines, trailers, and services in Michigan. Despite the fact that the number of boat registrations dropped from 2010, total spending on boats shows a 10.6% increase from a year ago. Nationwide, in 2010, the number of boaters hit a record high of 75 million, or 32.4% of adults. According to the National Marine Manufacturers Association, that’s the highest percentage since 1999.

Geographic reference: Michigan
Year: 2011
Market size: $351 million
Source: Barbara Wieland, “Boating Industry Rides Recovery Wave,” Lansing State Journal, June 19, 2011, page 1E
Original source: National Marine Manufacturers Association.

Airline Industry Worldwide

At the Show in 2009

Today’s market size is the estimated net profits of the worldwide airline industry. The Paris Air Show is being celebrated this week and the press coverage of this important aerospace industry show is providing many interesting glimpses of the industry. The most recent recession combined with high energy costs hit the airline industry hard, causing two years of losses. Financial returns in 2010 represent a return to profitability for the industry as a whole. The mood is good at this year’s Paris Air Show as aircraft manufacturers are hopeful that orders will be healthy this year.

Geographic reference: World
Year: 2010
Market size: $18 billion (Global airline industry net profits)
Source: Nicole Clark, “At the Paris Air Show, Anticipating a Surge in Sales,” The New York Times, June 18, 2011, page B1. The image used above is from the Paris Air Show website, here.

Reverse Mortgages

A reverse mortgage is a loan mechanism that allows the owner of a home to borrow against the value of that home. This is done while the homeowner and borrower continues to live in the home, maintains the home and pays the taxes owed on the home and property. To qualify for such a loan the borrower must be at least 62 years of age.

While the first reverse mortgage established in the United States purportedly dates back to 1961 it was the housing bubble of the last decade that brought this form of lending to the public’s attention. And, as with so many things that blossomed during the distortions of the real estate bubble, the bloom is off the rose of reverse mortgages. The two largest providers of reverse mortgages exited the business during 2011.

Today’s market size is the dollar volume of the reverse mortgage business in the United States in 2001 and 2010. Worth noting is the fact that while these two points in time show a significant increase in this business, the peak came in 2009.

Geographic reference: United States
Year: 2001 and 2010
Market size: $0.5 and $10.3 billion respectively
Source: Tara Siegel Bernard, “2 Big Banks Exit Reverse Mortgage Business,” The New York Times, June 18, 2011, page B1, available online here.
Original source: Reverse Market Insight

Plants and Floriculture Products

In a season when gardens become a big part of many people’s lives, we turn today to a market size about landscaping plant products. Today’s market size is the estimated production value of live plants and products of floriculture in Europe which “include live trees, shrubs and bushes and other goods commonly supplied by nursery gardeners or florists for planting or ornamental use.” In 2010, this represented around 44% of world production.

Geographic reference: European Union
Year: 2010
Market size: €19.7 billion
Source: European Commission, Agriculture and Rural Development, “Live Plants and Products of Floriculture,” May 24, 2011, available online here.

Judicial Campaign Ads on TV

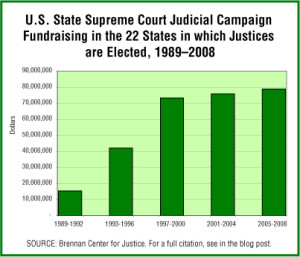
State Supreme Court Campaign Funds

For many, the idea of electing a judge is an odd one. It seems strange to have judicial candidates handing out trinkets at the polling place when next they may be presiding over a court of law making decisions of a very serious nature. Yet for a variety of reasons, 22 States in the United States hold at least some competitive elections in selecting their State Supreme Court Justices. According to a new report by the Brennen Center for Justice, the volume of money being raised and spent on state-level judicial campaigns has been rising very sharply. In fact, many feel strongly that this infusion of money is undermining confidence in our very judicial system.

The graph shows the sum of all state supreme court campaign fundraising, by four-year election cycle, over a period of 19 years. The rise in fundraising is directly correlated to a rise in the quantities contributed by a small number of large donors, businesses and business groups for the most part. For more details, we recommend a close look at the source report.

Today’s market size is the quantity spent on television spots for candidates in State Supreme Court Judicial Campaigns during 2008 alone, a subset of the money presented in that graph for the years 2005-2008.

Geographic reference: United States, and more specifically, the 22 states that hold some competitive electorial process in the selection of their Supreme Court Justices
Year: 2008
Market size: $19,945,970
Source: James Sample, Adam Skagg, Jonathan Blitzer, Linda Casey, and Charles Hall, The New Politics of Judicial Elections 2000-2009: A Decade of Change, Figure 1 on page 5 and Figure 13 on page 26, August 2010, published by Brennan Center for Justice, National Institute for Money in State Politics, and Justice at Stake Campaign. The report is available online here.

Salt

World production of salt has grown at just above the rate of population growth over the last quarter century or so—global salt production grew by 35% while world population grew by 38% between 1985 and 2007. Salt is used in many ways, in the treatment of water, in agricultural applications, as an industrial input, in deicing operations and as a spice or food additive. In the United States, food-grade salt is the smallest of the categories of salt by end use. In fact, nearly two-thirds of U.S. salt consumption annually is related to the de-icing of roadways. This makes us wonder (with a bit of tongue in cheek) whether looking at changes in the number of paved roads there are in the northern reaches of the northern hemisphere and the southern reaches of the southern hemisphere may be a better gauge for predicting future salt demand in the world.

Today’s market size is the quantity of salt produced worldwide in 1985 and in 2007, measured in millions of metric tons.

Geographic reference: World
Year: 1985 and 2007
Market size: 190.6 and 257.0 million metric tons respectively
Source: “World Salt Production,” a spreadsheet presented on the Salt Institute’s web page, available online here.

Bulgarian Rose Oil

Rose Pedals

In 2004, supported by the Bulgarian Foreign Ministry, then-Foreign Minister Solomon Passy, and the German non-governmental organization Welthungerhilfe, a project was started in Afghanistan to cultivate Bulgarian Roses as an alternative to growing opium. Bulgarian Roses are unique in that they are cultivated for their oil, which is used in expensive perfumes. The total amount of rose oil produced in the world was 4,000 kilograms in 2010, most of that grown in the Rose Valley of Bulgaria. It takes 3,500 kilograms of rose petals to produce one kilogram of rose oil. One kilogram of rose oil sells for around 4,000-5,000 euros. Although small-scale, the rose oil industry in Afghanistan provides a living wage for 5,000 people. The market size shown is the amount of rose oil produced in Afghanistan in 2010.

Geographic reference: Afghanistan
Year: 2010
Market size: 30 kilograms valued at approximately €135,000
Source: Sofia News Agency, “Afghanistan Shows Off Own ‘Bulgarian Rose’ Oil,” novinite.com, January 24, 2011, available online here. The image used comes from an online article titled “Extract of Bulgarian Rose Oil Contains in Italian Parfume,” published on June 20, 2007, available online here.

Extended Warranties

An extended warranty is something offered to consumers by retailers either as a service the retailer offers or on behalf of the manufacturer. These extended warranties vary greatly in terms of what they cover and duration. Today’s market size is an estimate of the number of such warranties sold annually in the United States.

Geographic reference: United States
Year: 2010
Market size: 250 million warranties annually
Source: Newman, Andrew Adams,”Old-Time Torture Tests Resurface on YouTube, and Tablets Take a Licking,” The New York Times, page B6, June 10, 2011, available online here.

Indian Agrochemical Market

India is the fourth largest producer of agrochemicals in the world, behind the United States, Japan, and China. An estimated $17 billion worth of crops is lost every year due to non-use of pesticides. Recently the biofertilizer sector has been trying to educate farmers about biofertilizers and biopesticides in hopes that they will switch from the chemical fertilizers and pesticides to the natural ones. Biopesticides are derived from natural materials such as animal and plant bacteria and certain minerals. According to the source, unlike chemical fertilizers, biofertilizers are effective, non-toxic, and do not lead to the deterioration in quality or fertility of the land. Data for 2012 are projected.

Geographic reference: India
Year: 2008 and 2012
Market size: $1.22 billion and $1.70 billion, respectively
Source: “Indian Agrochemical Industry Expected to Grow to 1.7 Bn by 2012,” The Economic Times, March 2, 2011, available online here.

Molybdenum

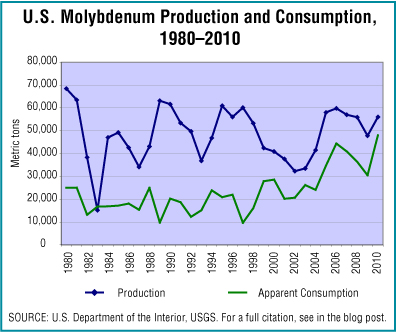
U.S. production and consumption figures for Molybdenum over 30 years

Molybdenum, a Group 6 chemical, is a refractory metallic element. The ability of molybdenum to withstand extreme temperatures without expanding or softening very much makes it useful in a variety of applications that involve intense heat. The manufacture of armour, aircraft parts, electrical contacts, industrial motors and filaments are among the industrial uses of molybdenum. It is used principally as an alloying agent in steel, cast iron, and superalloys to enhance corrosion resistance, strength, toughness, and weldability.

Today’s market size is the value of domestically produced molybdenum based on the average oxide price in 2010. The graphic shows production and apparent consumption figures for a period of 30 years, from 1980 to 2010. Apparent consumption is a calculated figure based on production, plus imports, minus exports, plus or minus change in stock.

Geographic reference: United States
Year: 2010
Market size: $885 million
Source: “Molybdenum Statistics and Information” part of a series of reports on different minerals and commodities produced by the U.S. Geological Survey and available online here.
Original source: U.S. Department of the Interior, U.S. Geological Survey (USGS)

Folding Furniture

Today’s market size is the value of retail sales of folding furnture—tables and chairs— in the United States in 2009. Leading manufacturers of this sort of furniture include Cosco and Lifetime.

Geographic reference: United States
Year: 2009
Market size: $395 million
Source: Dorel Investor Day, June 2, 1010, page 49, available online here.
Original source: Dorel Asia

Helium, Grade-A

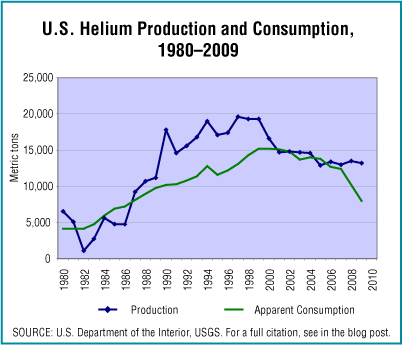
Helium production and consumption

For those not involved in one of the industries in which helium is an input, the term may conjure images of party balloons. But, helium is used in a variety of industrial applications. In the United States its end users break down in the following categories: 32% for cryogenic applications; 18% for pressurizing and purging applications; 13% is used for welding; 18% for controlled atmospheres; 4% for leak detection; 2% for breathing mixtures and the remaining 13% for other applications, like party balloons.

Today’s market size is the estimated value of domestically extracted grade-A helium in 2010. The graphic shows production and apparent consumption figures for a period of 30 years, from 1980 to 2010. Apparent consumption is a calculated figure based on production, plus imports, less exports plus or minus change in stock.

Geographic reference: United States
Year: 2010
Market size: $730 million
Source: “Helium Statistics and Information,” part of a series of reports on different minerals and commodities produced by the U.S. Geological Survey and available online here.
Original source: U.S. Department of the Interior, U.S. Geological Survey (USGS)

Disposable Diapers

Any parent with a small child knows that diapers are big business. The use of disposable diapers is highest in industrialized countries and together these countries account for most of this market, the U.S. alone accounting for nearly 20% of the global market according to the source. Today’s market size is an estimate of the size of the global diaper market in 2005 and 2010. The estimated size for 2010 is based on a forecast for that year made in advance. More recent estimates suggest that the global market surpassed $30 billion in 2010

Geographic reference: World
Year: 2005 and 2010
Market size: $22.2 and $26.6 billion respectively
Source: “Stratagist,” a report published in May 2009 by Feed-back.com, Market Analysis With Context and Perspective, available online here.
Original source: Euromonitor International and Global Industry Analysts