Electronic Games

The world of games, electronic games, is changing quickly as mobile devices become an ever more important platform on which they’re played. As a result, one may find estimates of sizes for this market that vary greatly, all depending on how a particular source defines the market. What was once primarily a software business—the making of electronic games to be sold, loaded onto a computer and then played—has become something much broader. Access to the Internet and higher speed connections globally have also fueled the growth in this industry.

Today’s market size is an estimate of total revenues—including all platforms, PCs, smartphones, TV and consoles, tablets, and massively multiplayer online (MMO) games—of the global electronic games market in 2012 and a forecast for revenues in 2016.

Geographic reference: World
Year: 2012 and forecast for 2016
Market size: $66.3 billion and $86.1 billion
Source: Dean Takahashi, “Mobile growth will fuel global game market that hits $86.1B by 2016,” VB Gamebeats, June 6, 2013, available online here.
Original source: Newzoo
Posted on March 31, 2014

Exam Preparation Firms

ExamPrep

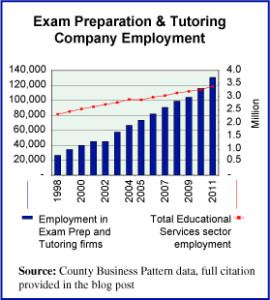
Business is booming for those involved in the business of helping to prepare students to take examinations, primarily standardized tests ranging from college entrance exams to the tests given children to select for admittance to private kindergarten. The graph provides employment figures nationally from 1998 through 2011 for all firms involved with exam preparation and tutoring. The rate of employment growth in this area has been very strong. From 1998 to 2011 it nearly quadrupled, growing 391%. This was the standout industry within the overall educational service sector, which as a whole saw employment grow 46% over the period. The red line in the graph shows overall sector employment.

The reason we have used employment data to show the growth of this industry is because data on revenues is not plentiful. Growth in revenue for the industry between 1997 and 2007, two Economic Census years, was 331%. Over that same period, employment grew 241%. It is reasonable to assume that between 2007 and 2011, revenue in the industry also kept pace with employment growth, suggesting that this is an industry that was not strongly impacted by the recession of 2007–2009.

Today’s market size is the total value of revenues earned by Exam Preparation and Tutoring businesses in the United States in 1997 and 2007. For those familiar with the NAICS coding system, this industry is NAICS 611691.

Geographic reference: United States
Year: 1997 and 2007
Market size: $815 million and $3.5 billion respectively
Sources: (1) “Educational Services: Geographical Area Series: Comparative Statistics for the United States (2002 NAICS basis): 2007 and 2002,” 2007 Economic Census, U.S. Census Bureau, available online here. (2) Arsen J. Darnay, editor, Information, Finance, & Services USA, 2001, page 549, Gale Group. (3) “2010 County Business Patterns (NAICS),” U.S. Census Bureau, available online here.
Original source: U.S. Department of Commerce, Bureau of the Census
Posted on March 19, 2014

Animal Feed Additives

Food supplements are consumed, whether by humans or animals, to augment or improve in some way the nutritional value of the diet. Food additives in farming have been used for centuries, as anyone who has seen a salt-lick will appreciate. However, with the rise of corporate farming in livestock production—what are known as Animal Feeding Operations (AFOs)—the use of feed additives and the nature of those additives has changed greatly. Animal feed additives come in a variety of types, from vitamin supplements and amino acids to preservatives, emulsifiers and essential fatty acids.

Recently, one commonly used additive has been in the media spotlight; antibiotics. It is now common practice in the United States to add low doses of antibiotics to animal feed. Antibiotics are used to stimulate growth as well as to stave off the diseases bred by unnatural and unsanitary conditions. The use of antibiotics on livestock is so great in the United Sates that it is believed to account for 80%, by weight, of all antibiotic use. The business of providing a population with high volumes of low-cost meat is a very large business indeed. Raising livestock in more natural ways—as opposed to the assembly-line manner used by AFOs—takes longer and, as they say, time is money.

Today’s market size is the estimated global value of the animal feed additive market. These additives are most heavily used in North America and Asia-Pacific, regions that together account for more than 60% of the use of animal feed additives.

Geographic reference: World
Year: 2012 and a forecast for 2018
Market size: $16.18 billion and $20.23 billion respectively
Source: “Animal Feed Additives Market Worth $20,233.2 Million by 2018,” PR Newswire, March 12, 2014, available online here.
Original source: MarketsandMarkets
Posted on March 17, 2014

Nonstore Retail Sales

Nonstore

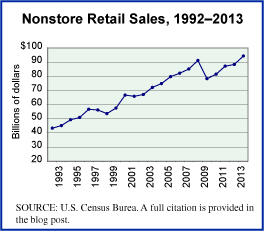
We hear a lot today about e-commerce, which may be defined in many ways and has been around for longer than most people think if we include exchanges made at the wholesale trade level as a part of e-commerce. Wholesalers have been using electronic sales for a long time now. But e-commerce is not actually synonymous with nonstore retail. While electronic shopping accounts for a great deal of the total nonstore retail business, nearly 80% in 2013 when combined with mail-order house sales, there are others in this nonstore sector.

The total nonstore retail sector includes, as we’ve seen, electronic shopping and auction websites and mail-order houses. It also includes businesses that do their selling with infomercials on TV, by going door-to-door, through the use of in-home demonstrations, those that sell from portable stalls or food trucks, and those operating vending machines. The graph we present shows annual sales by nonstore retailers other than electronic shopping, auctions, and mail-order houses.

Today’s market size is the total value of sales made in the United States through nonstore retailers in 2000 and in 2013.

Geographic reference: United States
Year: 2000 and 2013
Market size: $180.5 billion and $450.2 billion
Source: “Time Series / Trend Charts,” a new interactive resource made available by the U.S. Census Bureau using its wealth of data collected in a monthly survey series it does of the retail trade sector. The main website for the “Monthly and Annual Retail Trade” data is here and the new Time Series / Trend Chart offering is available online here.
Original source: U.S. Census Bureau
Posted on March 13, 2014

Sake

Sake is an alcoholic beverage, made with rice, that originated in Japan. It is often referred to as rice wine but is actually closer to a beer than a wine based on the way that it is brewed. In the production of wine, the natural sugars in the fruits from which it is made are fermented. In making sake, the sugars that are fermented to produce the alcohol must first be converted from the starches in rice. It is a process very similar to the one used to brew beer.

Today’s market size is the value of Japanese sake exports to the world in 2002, 2012 and the industry’s declared goal for exports by 2020. In 2012, one-third of the sake exported from Japan was imported by the United States.

Geographic reference: Japan
Year: 2002, 2012, and a forecast for 2020
Market size: ¥7.5 billion, ¥8.9 billion and ¥60 billion respectively. In dollar terms, based on average exchange rates each year and using 2013’s exchange rate for the 2020 forecast, those values are $60 million, $112 million, and $616 million.
Source: Eric Peanner and Zhiyi Yang, “In Sake, Japan Sees A Potential Stimulus,” The New York Times, February 22, 2014, pages B1-B2. The average exchange rate data used to convert the Yen to Dollars was obtained at this OzForx Group Limited website.
Original source: National Tax Agency of Japan
Posted on March 11, 2014

Bourbon

The last decade has been one of unexpected growth for whiskey distillers in the United States and in particular for those producing bourbon. Bourbon is made in the United States only—in the same way that Scotch Whiskey must be made in Scotland—and is a type of whiskey made from a grain mash consisting of at least 51% corn mash. The distinctions that define types of whiskey are the primary grain used in the mash with which the whiskey is distilled, the length of time it is aged in a barrel, and the place in which it is made.

Bourbon whiskey was a very fashionable and popular drink in the United States after prohibition and through the 1950s. The drink went out of fashion in the 1960s and spent the next several decades in decline. But that has all changed since the turn of the century. Bourbon is once again a fashionable drink, demand for which is rising so quickly that distillers are having a hard time keeping pace. After all, a high-quality bourbon must spend years in a barrel to age making quick adjustments to inventory problematic.

Today’s market size is the value of bourbon exports from the United States in 2002 and 2013.

Geographic reference: U.S. exports
Year: 2002 and 2013
Market size: $376 million and $1 billion respectively
Source: Clay Risen, “The Billion-Dollar Bourbon Boom — How Did American Bourbon Get So Damn Hot?” Fortune, February 24, 2014, pages 56-65.
Original source: Distilled Spirits Council of the United States
Posted on March 4, 2014

Library Spending

Library-interior

Today’s market size is the dollar amount spent, worldwide, by libraries on content. “Content” in this context refers to all material, physical or digital, purchased by libraries to become a part of their offerings.

Geographic reference: World
Year: 2011 and estimates for 2013
Market size: $23.78 billion and $24.79 billion respectively
Source: Andrew Neilson, “Content Spending by Library Type and Geography, 2011,” The Rise of eBooks: Global eBooks Trends, Elsevier, June 23, 2013, available online here. The photo comes from this website and is an interior shot of the Washington State Library.
Original source: Outsell, Inc.
Posted on February 27, 2014

Athlete Endorsements

With the end of the 2014 Winter Olympics having been celebrated yesterday, we turn our attention today to the subject of how much is spent every year paying athletes to endorse products. By its very nature, the endorsement of an athlete requires that the athlete be a superstar, at least within his or her own sport. Thus, it will come as no surprise that 70% of the earnings from athlete endorsements in 2013 were earned by the top 100 such spokesmen and women.

The top three earners included two golfers and a tennis player, in order; Tiger Woods, Roger Federer, and Phil Mickelson. Also of interest, only four women made the top 100 list, each is a tennis player. When the top one hundred athlete endorsement deals of 2013 are analyzed by sport, one sees that basketball has the largest number of players on the list and earns the largest total of the athletic endorsement pie (15%). A full breakdown by sport is provided in a detailed table on the source website, a link to which is provided below.

Today’s market size is the approximate value of all athlete endorsements, worldwide, in 2013. We give a tip of the hat to the Ghulf Genes blog for a link to the source of today’s market size.

Geographic reference: World
Year: 2013
Market size: $1.1 billion
Source: “Top 100 Highest-Paid Athlete Endorsers 2013,” Opendorse, available online here.
Posted on February 24, 2014

Refugees

The number of people in the world who have been displaced from their countries due to war, persecution, or natural disaster is hardly what one might think of as a market. And yet those involved in helping this unfortunate population—as it awaits the opportunity to return home or seeks a way to resettle in a new home—may view it in ways quite similar to a growing market.

According to the UN Refugee Agency, the UNHCR, the total number of refugees in the world at the end of 2012 was 45.2 million. This included 28.8 million people displaced within their own countries, 15.4 million international refugees and nearly one million people in the process of seeking asylum. This figure represented a 20 year high, however, it has done nothing but rise ever since. The ongoing civil war in Syria has lead to a massive exodus from that country, a flow which has only increased since the end of 2012.

Today’s market size is the approximate number of Syrian refugees being housed in Turkey as of the middle of 2013 and a projected figure as of the end of 2014. Already in 2012, Turkey supplanted the United States on the list of top ten nations by the number of refugees hosted, taking over the tenth spot on that list.

Geographic reference: Turkey
Year: mid-2013 and a projection for the end of 2014
Market size: 400,000 and 1.5 million respectively
Sources: (1) Mac McClelland, “Container City,” New York Times Magazine, February 16, 2014, pgs. 24-31. (2) “Statistics — 2012 UNHCR Statistics Yearbook,” a summary online at this UN website.
Original source: United Nations Refugee Agency
Posted on February 19, 2014

Classic Car Bubble?

ClassicCar

The classic and collector car market in the United States has been strong for many years, slowing during the recession of 2007–2009 but recovering quickly thereafter. In fact, in the summer of 2013 an all-time record was broken, surpassing the prior record by $13 million when a Mercedes W196 sold at auction for $29.6 million. But any market for collectibles fluctuates, such markets are, by definition, speculative. What concerns some in the trade is the overall supply and demand balance.

The concern has to do with the fact that approximately 58% of the classic cars in the United States are owned by baby boomers. It is anticipated, based on historical ownership patterns, that baby boomers will begin to sell off their collections over the next twenty years. Thus, the question arises, is there a strong enough market for these cars, one that can withstand a flood of mid 20th century American cars without causing prices to fall sharply?

Today’s market size is the number of classic and collector cars in the United States in 2013.

Geographic reference: United States
Year: 2013
Market size: 5 million cars
Source: Rob Sass, “For Sale by Boomer,” Car and Driver, March 2014, pages 76-79.
Original source: Hagerty Group
Posted on February 14, 2014

Soft Veneer and Plywood

Today’s market size is the value of soft veneer and plywood consumed in the United States in 2007 and 2011. This figure is referred to as apparent consumption as it is the result of the following calculation: the value of U.S. made product shipments, less exports, plus imports. In the case of soft veneer and plywood, as in the case of all construction materials, the years since 2007 have been very difficult as the industry works through the collapse of the housing market and… builds back very slowly. Production fell over this period by 23% while exports grew by the same percentage and imports dropped by 42%.

Geographic reference: United States
Year: 2007 and 2011
Market size: $4.28 billion and $3.09 billion respectively
Sources: (1) “Value of Exports, General Imports, and Imports by Country and by 6-digit NAICS,” U.S. International Trade Statistics, a data set kept by the U.S. Census Bureau and made available online here. (2) “Manufacturing: Subject Series: Industry-Product Analysis: Industry Shipments by Products, 2007,” 2007 Economic Census, data on NAICS 321212, available online with all the Economic Census reports from the Census Bureau’s American FactFinder web site here. (3) “Value of Product Shipments: Value of Products for Product Classes, 2010 and 2011,” Annual Survey of Manufactures, available online through the American FactFinder site but more specifically, here
Original source: U.S. Department of Commerce, Bureau of the Census
Posted on February 11, 2014

Oranges

Today’s market size is the total production of oranges worldwide in 2013, broken out into those harvested for consumption as fresh fruit and those harvested for processing. In the United States, production was down in 2013 due in part to Citrus Greening disease which has been killing trees in the nations largest orange producing state, Florida. Over the last six years, 2008–2013, U.S. orange production accounted for an average of 15% of world production. In 2013 that figure fell to 13%.

Geographic reference: World
Year: 2013
Market size: 51.8 million metric tons, 59% harvested for fresh consumption and 41% for processing
Source: “Oranges, Fresh: Production, Supply and Distribution in Selected Countries,” Production, Supply and Distribution Online, December 24, 2013, USDA, Foreign Agricultural Service, available online here. The USDA reports on the production and supply of many agricultural products through its Foreign Agricultural Service, the main web site for which is here.
Original source: U.S. Department of Agriculture, Foreign Agricultural Service (FAS)
Posted on February 7, 2014

Super Bowl TV Ads

SuperBowlAds

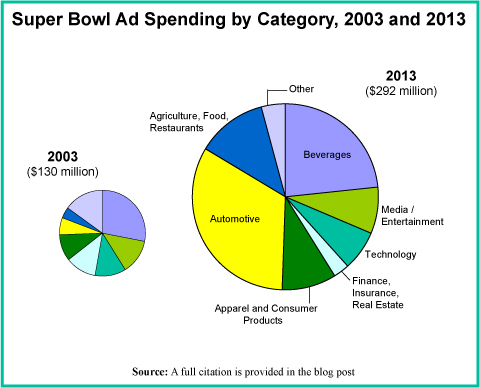
The Super Bowl is one of the big, annual TV events in the United States and as such it draws a large number of views. As a result, those wishing to reach a broad audience and having lots of money to spend, like to advertise during the Super Bowl. In fact, for many viewers, the advertisements themselves have become part of the attraction of the event.

The pie graph we present here shows ad spending by industry category in 2003 and 2013. Clearly, the auto industry has decided that the Super Bowl is a great way to grab attention for new cars and trucks. In 2013 that industry accounted for 33% of Super Bowl ad spending, up from 7% in 2003.

Today’s market size is the total spent on TV advertisements during the Super Bowl in 2003 and in 2013. The source we link to below provides a very interesting, interactive graphic with details on each Super Bowl from 2000 through 2013 as well as links to videos of memorable advertisement broadcasts in each year.

Geographic reference: United States
Year: 2003 and 2013
Market size: $130 and $292 million respectively
Source: Andrew Garcia Phillips and Willa Plank, “Super Bowl Spending Driven by Automotive Ads,” Wall Street Journal, available online here.
Original source: Kantar Media
Posted on February 5, 2014

Diamond Rings

An article about wedding jewelry caught our attention. In a New York Times article over the weekend the subject of how much is spent in the United States annually on diamond engagement and wedding rings was presented. According to the article, couples paid an average of $4,000 on engagement rings in 2012 and another $1,000 for her wedding band, $500 for his. Now, averages, as we know, can be deceptive. What we were unable to find are statistics on just how many of these rings were purchased, which would be nice to know since the range in price for a diamond ring can be quite large. What we can say, by way of putting today’s market size into some context, is that in each year between 2000 and 2011 the number of marriages in the United States was between 2 and 2.3 million.

Today’s market size is the total value of diamond engagement and wedding jewelry sold in the United States in 2012.

Geographic reference: United States
Year: 2012
Market size: $11 billion
Source: Tara Siegel Bernard, “With Engagement Rings, Love Meets Budget,” The New York Times, February 1, 2014, page B1, available online here.
Original source: Bain & Company
Posted on February 3, 2014

Silica Sand for Hydraulic Fracturing

Sand

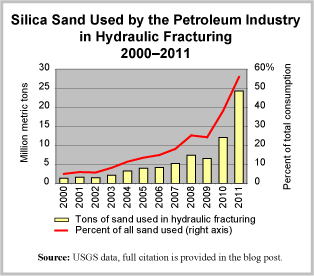
Yesterday’s post on the size of the world market for silica sand got us to thinking. So, we dug around in the U.S. Geological Survey’s Minerals Yearbook, to see if we could clearly see any trends in the use of silica sand in the United States. What we found was clear indeed and we present it here in a graph.

Overall, silica sand consumption has increased 62% from 2000 to 2011. The use of silica sand by the petroleum industry, for hydraulic fracturing, has grown 1,674%. The use of silica sand in oil and gas fracking operations was a relatively steady 5% of the overall demand for decades and began to rise in the mid-2000s. By 2011, it reached 56% of total demand for silica sand in the United States. Final data on 2012 are not yet available but all signs show that the trend seen in the graph has continued apace.

Today’s market size is the value of silica sand used in oil and gas hydraulic fracturing operations in the United States in 2001 and in 2011.

Geographic reference: United States
Year: 2001 and 2011
Market size: $47.5 million and $1.33 billion respectively
Source: Thomas P. Dolley, “Silica [Advanced Release]” Tables 1 and 6, 2011 Minerals Yearbook, March 2013, pages 66.1-66.10, USGS, available in PDF format here. Data from Tables 1 and 6 of the Silica chapter of each annual Minerals Yearbook from 2000 through 2010 were used and may be accessed at the USGS web site here.
Original source: U.S. Department of the Interior, U.S. Geological Survey (USGS)
Posted on January 31, 2014

Silica Sand

Sand is made up, primarily, of very small quartz (silicon dioxide, or SiO2) crystals. Quartz is one of the most common minerals found on the Earth’s surface, so it is both an easily found mineral and one we use in many, many ways. Sand is used in water filtration, in glass manufacturing, in industrial casting, as an abrasive in many applications, in producing concrete, in adding texture to slick roads, and as a filler in children’s sand boxes. Silica sand, however, has a higher price than the sand usually used to help on deicing roads and making concrete. This is because it is a purer sand, having the composition and grain-size distribution required for industrial applications. Silica sand has well-rounded, consistently sized granules of almost pure quartz grains.

The demand for silica sand has been rising steadily for years now. Globalization—if you will forgive such a sweeping generalization—is one of the main reasons, as is the increased demand worldwide for glass (think HD TVs, tablets and cell phones), and the significant increase in the use of hydraulic fracturing in the oil and gas industry. The hydraulic fracturing process for oil and gas extraction takes a mixture of silica sand (often called frac sand), water and chemicals and injects this mixture into a well under very high pressures. Small cracks form in the bedrock and the sand in the mixture helps to prop open these tiny fissures. From the fissures, conduits form that increase the flow of fluids and gas within the well.

Today’s market size is the value of silica sand sold worldwide in 2011 and a forecast for its value in 2016.

Geographic reference: Worldwide
Year: 2011 and a forecast for 2016
Market size: $6 billion and $9.2 billion respectively
Sources: (1) World Industrial Silica Sand, a brochure to promote an industrial study produced by The Freedonia Group and published in October 2012. The brochure is available online here. (2) “Industrial Silica Sand FAQs,” Minnesota Department of Natural Resources, last updated on October 31, 2012 and available here.
Posted on January 29, 2014

Craft Cider

red_apples_on_tree_193814

Sales in the United States of hard cider tripled between 2007 and 2012. Hard cider is a fermented alcoholic beverage made with fruit juice, usually apple but some ciders are made with other fruit juices, primarily peach and pear. When the term cider is used alone, it may refer to hard cider or to a nonalcoholic apple cider.

Although the hard cider market is still a small fraction of the $10.2 billion craft beer market (2012) it is growing quickly. Cider sales in multi-outlets and convenience stores during the year ended March 24, 2013, totaled $122.5 million for the top 20 cider brands. That’s an increase of 97 percent compared to a year earlier. Capitalizing on the craft cider trend, small and large craft beer manufacturers are creating their own hard cider blends to entice drinkers with new taste offerings. To spark interest in the mainstream beer drinker MillerCoors offers several hybrid beers.

Today’s market size is total sales of hard cider in the United States in 2012.

Geographic reference: United States
Year: 2012
Market size: $600 million
Source: Chris Furman, “Craft Cider Gaining Momentum,” Brewhound, June 3, 2013, available online here. The photo is from a web site offering images free of copyright, here.
Posted on January 24, 2014

Training Doctors

The education and training of a doctor is a long and costly endeavor. First comes the classroom education, the cost of which is picked up, for the most part for those not fortunate enough to get a scholarship, by the future doctor him or herself. Then comes a final on-the-job training period in which doctors with new diplomas spend four or more years working in a residency program.

During this residency, doctors in training see and treat patients under the supervision of more seasoned physicians. Most of these residency programs are carried out in teaching hospitals, which account for approximately 20% of the nation’s hospitals. Residency programs are arduous. Residents are expected to routinely work 80 hours a week and they are paid half or far less of what they will receive for much the same work after the residency. This training is expensive for the system as a whole and has been, for all practical purposes, nationalized.

The U.S. federal government pays for most of this training with money from the Medicare and Medicaid systems. Our market size today is the money spent by the federal government annually to support this graduate medical education.

Geographic reference: United States
Year: 2012
Market size: $11.5 billion of U.S. government funds are used to support residency slots in training hospitals, approximately 115,000 in 2012
Source: Catherine Dower, “Graduate Medical Education,” a health policy brief published in Health Affairs, on August 31, 2012 and available online here.
Original source: U.S. Department of Health and Human Services, Center for Medicare and Medicaid Services
Posted on January 22, 2014

Spending on Water and Sewer

Water-Sewer

One of the basic infrastructural needs of any modern society, particularly one in which the density of population is great, such as in urban areas, is that which supplies clean water and carries waste away. It is one of those things that in modern industrial society we take very much for granted and almost don’t notice it, until something isn’t working.

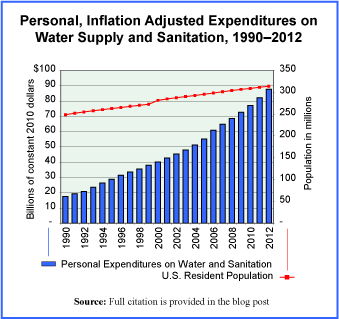
Today’s market size is the amount spent by residents, in the United States, for water supply and sanitation in 1990 and again in 2012. This does not include the expenditures of companies or other entities for water and sewer services but is, rather, the total spent by individuals for personal use. The graph provides a year-by-year picture of these expenditures in constant 2010 dollars, in other words, in inflation-adjusted terms. A red line on the graph is there to show how the population has risen over this period and it is clearly at a rate much slower than the rate of growth in expenditures on water.

Geographic reference: United States
Year: 1990 and 2012
Market size: $27.1 and $85.9 billion respectively (in current dollars)
Source: “Table 2.5.5 Personal Consumption Expenditures by Function (A),” National Income and Product Accounts Tables, (NIPA), Bureau of Economic Analysis, August 7, 2013, available from the BEA web site here.
Original source: U.S. Department of Commerce, Bureau of Economic Analysis
Posted on January 20, 2014

Youth Sports Tourism

An estimated 35 million children in the United States between the ages of 5 and 18 play organized sports every year. Of those, 21 million play non-school youth sports, which include baseball, soccer, lacrosse, rowing, hockey, volleyball, and gymnastics. These non-school groups are organized through local programs, such as Little League, or through sports clubs.

Unlike school-sponsored sports, in which teams usually travel by bus from one local school to another for games and tournaments, non-school sports games and tournaments may be held either across town or across the country. Parents are expected to spend the time and money to take their children to these events. Because of the money families spend while at these far away locations, more cities are planning to build sports complexes to attract youth sports tournaments.

Today’s market size is an estimate of the total spent in 2013 by families in the United States on travel for youth sports, including hotels, restaurants, and shopping. This category of tourism—Youth Sports Tourism—didn’t even exist a few years ago but is now one that is keenly tracked by industry observers and chambers of commerce.

Geographic reference: United States
Year: 2013
Market size: $7 billion
Source: Mark Koba, “Spending Big on Kids’ Sports? You’re Not Alone,” CNBC.com, January 13, 2014, available online here.
Original source: Minnesota Amateur Sports Commission
Posted on January 16, 2014