American Craft Beer Market in Belgium

Belgians who drink beer love their locally-made beer. In years past, many Belgians considered American beer inferior, but this attitude may be changing. American craft beers are now appearing in Belgian supermarkets and in bars. A craft beer brewed by Seattle’s Schooner EXACT brewery won the top award at the Brussels Beer Challenge in 2015. American beers also won several other gold medals, 5 more than Belgian beers did, that same year.

Today’s market size shows the amount of craft beer exported to Belgium by American brewers in 2015. In comparison, the United States imported 50 million gallons of Belgian beer that year.

Geographic reference: Belgium
Year: 2015
Market size: 160,000 gallons
Source: Thompson, Linda A., “U.S. Suds No Longer Duds,” Lansing State Journal, August 7, 2016, page 4B.

Dental Floss Market

Dental floss was invented in the early 19th century by dentist Levi Spear Parmly and patented in 1874. For decades parents in the United States have taught their children to floss their teeth daily. The Federal government has recommended daily flossing since 1979 as part of a surgeon general’s report. Later, the recommendation was part of the Dietary Guidelines for Americans, which are updated every five years. The American Dental Association, which has recommended flossing since 1908, states on its website that “flossing may … help prevent gum disease and cavities”. A Department of Health and Human Services statement reiterates that flossing is “an essential part of taking care of your teeth and gums.”

Things changed a bit in 2015 when the Dietary Guidelines for Americans omitted daily flossing as a recommendation due to inconsistent and unreliable evidence that flossing provided any benefit. According to the source, most existing studies on the efficacy of flossing used outdated methods and tested few people for short periods of time. By law, the Dietary Guidelines for Americans must be based on scientific evidence.

Today’s market size represents the estimated global market for dental floss in 2017, half of that market is in the United States.

Geographic reference: World
Year: 2017
Market size: $2 billion
Sources: “Little Proof Flossing Really Helps, Study Shows,” Lansing State Journal, August 8, 2016 available online here. “Flossing,” Mouth Healthy, 2016 available online here. Manchir, Michelle, “Government, ADA Recognize Importance of Flossing,” ADA News, August 2, 2016 available online here.
Original source: MarketSizeInfo.com

Sneaker Resale Market

When one hears the word collectibles one may think of antiques, figurines, baseball cards or comic books. But something many of us wear on a daily basis has also become a collectible: sneakers. Rare sneakers are now being sold through social media and at trade shows. In some cases, shoes bought at retail for $200 four years ago are now listed at close to nine times that. In some cases, sneakerheads—as buyers and sellers of rare sneakers are called—are paying more than $5,000 a pair for the most coveted styles.

In the United States, about 9 million pairs of sneakers are resold each year. Today’s market size shows the estimated value of the sneaker resale market in the United States in 2016.

Geographic reference: United States
Year: 2016
Market size: $1.2 billion
Source: Diamond, Michael L., “Teen Finds Fortune, Heartbreak in Sneakers,” Lansing State Journal, August 28, 2016, page 6B.

Alternative-Fuel Vehicles

When one thinks of alternative fuels for vehicles, one might think of diesel, ethanol, or even compressed natural gas, but recently vehicles running on propane have entered the market. According to Todd Mouw, vice president of sales and marketing for Roush CleanTech, a manufacturer of engines that run on propane, propane is “… cleaner than gasoline and diesel. We have a lot of it (in the U.S.) and … it’s easy to integrate into a Ford truck or school bus.” In fact, all three major school bus manufacturers in the United States offer propane-powered school buses to school districts.

Today’s market size is the number of propane-powered vehicles on the road. In comparison, we also include the number of vehicles on the road powered by compressed natural gas.

Geographic reference: United States
Year: 2016
Market size: More than 143,000 propane-powered vehicles
Market size: Approximately 153,000 compressed natural gas powered vehicles
Source: Snavely, Brent, “Alternative-Fuel Buses Carry Roush,” Lansing State Journal, January 8, 2017, page 18A
Original source: Roush CleanTech and Natural Gas Vehicles for America

Moving Day

Bar Chart

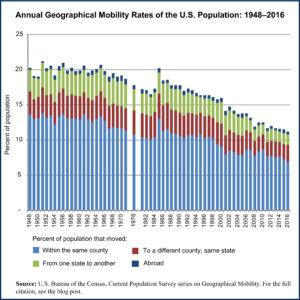
Today we are looking at the number of people who make a residential move in the United States each year. This is a measure of geographical mobility and has been tracked by the U.S. Census Bureau annually for decades. Using their data we produced a graph showing the annual percent of the U.S. population aged one year or more that moved from one place to another each year.

Americans think of themselves as a very mobile people, both in terms of economic mobility as well as actual, physical mobility. And yet, in truth, we are less mobile than we were in the past. As the data in the graph show, we actually move far less often now than in the past. The trend is towards fewer moves and moves of shorter distance.

There are many reasons for this change, from an aging population to less regional diversity in the growing service industries than existed in the manufacturing sector. An increasing use of occupational licensing practices and a declining rate of job changing in the United States also contribute to this change. (Yes, contrary to popular thought, we actually change jobs more infrequently than in the past.)

Some analysts see the declining rate of geographical mobility in the United States as one of the reasons behind a declining rate of productivity growth. Others see it as just another consequence of decreased median income growth. What is clear is the fact that we are staying put at much higher rates now than we did thirty years ago.

For those interested in reading more about this topic, we provide a link to further reading about it under the source note below.

Geographic reference: United States
Year: 1976 and 2016
Market size: 36.8 million (17.7% of the population) and 35.1 million (11.2%)
Source: “Table A-1. Annual Geographical Mobility Rates, By Type of Movement: 1948-2016,” Current Population Survey, Historical Migration/Geographic Mobility Tables, November 15, 2016, available here.
Original source: U.S. Department of Commerce.
Further reading: Tyler Cowen, “The Unseen Threat to America: We Don’t Leave Our Hometowns,” Time, February 22, 2017, available online here.

Wheat Market in Michigan

Michigan has approximately 8,000 wheat farmers, some have been farming on family farms for more than 100 years. Several have ancestors who were wheat farmers in Europe. Farmers in Michigan plant on average 500,000 acres of wheat per year.

There are primarily two types of wheat that Michigan farmers plant: soft white and soft red. Soft white wheat is mostly used in breakfast cereals and whole-grain products because of its greater palatability. Soft red wheat is mostly used for baked goods and other processed foods.

Today’s market size is the value of wheat sales by farmers in Michigan.

Geographic reference: Michigan
Year: 2016
Market size: $218.5 million
Source: Witsil, Frank, “Dr. Wheat Shapes Eats,” Lansing State Journal, November 13, 2016, page 7A

U.S. Population Over 165 Years

US Population 1850-2015

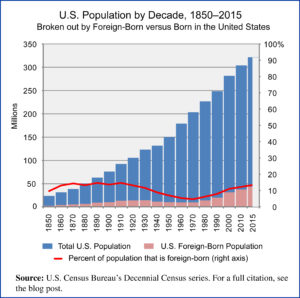
Since the beginning of the 21st century the movement of people around the globe has picked up. Factors such as globalization, wars and natural disasters have spurred an increase in the number of people emigrating or finding themselves forced into fleeing their homes and becoming refugees, looking for a new home. Resistance to newcomers is on the rise in many places and tensions run high when the topic of immigration comes up in public discourse. This set of circumstances made us wonder about the actual numbers of foreign-born people residing in the United States.

Today’s market size is the number of foreign-born people living in the United States in 2000 and in 2015. In the year 2000 foreign-born residents made up 12.4 percent of the U.S. population and in 2015 they accounted for 13.5 percent of all residents. The graph shows how the number of foreign-born persons in the population has trended over the last 165 years.

Geographic reference: United States
Year: 2000 and 2015
Market size: 31.1 and 43.3 million respectively
Source: Campbell Gibson and Kay Jung, “Table 1. Nativity of the Population and Place of Birth of the Native Population: 1850 to 2000,” Historical Census Statistics on the Foreign-Born Population of the United States: 1985 to 2000, U.S. Census Bureau, February 2006, available here; “Table 1.1 – Population by Sex, Age, Nativity, and U.S. Citizenship Status, 2010,” from the Census Bureau’s Current Population Survey, March 2010 Detailed Tables, available here, and “Table 2. Projections of the Population by Nativity for the United States: 2015 to 2060,” from the Census Bureau’s Population Project report titled 2014 National Population Projections: Summary Tables, available here.

Bicycle Accessory Market in the United Kingdom

In 2015 there were 15.8 million bicyclists in the United Kingdom. In urban areas cycling has become a convenient and environmentally-friendly alternative to other forms of transportation. Recently more and more professionals are using their bicycles to commute to work. Since 2010 the market for accessories has grown faster than the market for bicycles themselves—28 percent and 23 percent, respectively.

Today’s market size shows the value of the bicycle accessory market, which includes parts, accessories, and clothing, in the United Kingdom for 2014. That same year the market for bicycles was valued at £956 million.

Geographic reference: United Kingdom
Year: 2014
Market size: £1.25 billion
Source: Graham, Luke, “Chain Reaction: Cycling Gets a Luxury Pricetag,” CNBC, July 31, 2015 available online here.
Original source: Mintel

Public Transportation in the Lansing, Michigan Area

The Capital Area Transit Authority (CATA) is the largest public transit provider in the tri-county area around Lansing, Michigan. The tri-county area consists of Ingham, Clinton, and Eaton counties. CATA has been operating public transportation in the mid-Michigan area since 1972 and has been twice named the best transit system of its size in North America by the American Public Transportation Association.

Ridership grew steadily during the 1970s, before leveling off during the 1980s and most of the 1990s. During the 1980s and 1990s, the number of rides fluctuated around 3-4 million annually. In 1999, CATA took over the Michigan State University bus service. Since then ridership has increased nearly 3-fold. In contrast, the population of the tri-county area grew by 22.6% from 1970 to 2010.

In 2013, CATA set a fourth consecutive yearly record for number of rides. By 2014, however, ridership was down overall despite seeing increased ridership on its Michigan State University routes and increased requests for its paratransit services. In the fourth quarter of 2014, gasoline prices fell which could account for the decreased ridership. Gasoline prices remained low in 2015. Nationally, according to the American Public Transportation Association, total passenger trips declined by 3.5 percent from October 2015 to December 2015. CATA reported a 1 percent decline in ridership in 2015 relative to the close of 2014.

Today’s market size represents the number of rides annually on CATA vehicles in 1972 and 2015.

Geographic reference: Lansing, Michigan area
Year: 1972 and 2015
Market size: Less than 1 million rides and 11.43 million rides respectively
Sources: “National Trend Leaves Its Mark on Ridership,” CATA 2016 Community Report, June 2016, page 3; “Ridership Trends Vary by Service Type”, CATA 2015 Community Report: Where Public Transportation Goes Community Grows, June 2015, page 3; “Passenger Trips Reflect Stable Demand”, CATA 2014 Community Report: Moving You Forward With Pride, June 2014, page 3; “Growth in Ridership Remains Strong”, CATA 2013 Community Report: Moving You Toward Your Dreams, June 2013, page 4; “Riding High with Record Ridership,” CATA 2012 Community Report 40th Anniversary Edition: Greater Lansing on the Move, August 2012; “CATA Demand Grows with Community Need,” CATA 2011 Community Report: Greater Lansing on the Move, August 2011; Tri-County Regional Planning Commission, “Tri-County Regional Growth: Choices for Our Future,” Draft Report, August 2002 available online here; “Ingham County, Michigan” available online here; “Clinton County, Michigan” available online here; and “Eaton County, Michigan” available online here.

Prepaid Card Market

Prepaid cards, or general purpose reloadable cards, as they are called in industry parlance, are popular among 30 to 49-year-olds, especially renters and those earning less than $50,000 per year according to the Pew Charitable Trust. The cards, generally available for sale at supermarkets and drugstores, are similar to gift cards except that they can be reloaded with money. For some, this is a lower-cost alternative to a checking account, but fees can add up. Depending on the card users are charged for putting money on the card, withdrawing money at an ATM, checking the account balance, paying bills, and in some cases, users are charged a monthly fee. Starting in October 2017 the Consumer Financial Protection Bureau will implement new rules that will provide requirements for disclosure of fees, limit users liability when a prepaid card is lost or stolen, and in some cases eliminate certain fees.

Today’s market size shows the total amount of money consumers placed on their cards in 2003 and 2012.

Geographic reference: United States
Year: 2003 and 2012
Market size: $1 billion and $65 billion respectively
Source: Tompor, Susan, “Users of Prepaid Cards Get Protection,” Lansing State Journal, October 16, 2016, page 24A.

Smart Wearable Healthcare Market

fitbit-imgThe market for smart wearable healthcare devices is one part of the larger smart wearables market as a whole. The term wearables is used to refer to any electronic device, usually small, that can be worn relatively easily during the normal activities of life. Examples include wristbands such as the Fitbit, smart watches, clip on devices like pedometers and even clothing into which sensors have been sewn.

Smart wearable healthcare devices are those that are specifically designed to help a person monitor his or her own health—activity level, hours of sleep, heart rate, temperature, blood pressure, etc.—as well as devices designed to communicate remotely with medical providers so that they may monitor a patient from afar.

Geographic reference: United States
Year: 2014 and forecasted for 2020
Market size: $2 billion and $41 billion respectively
Source: “Healthy Beats — With Health Being the ‘Great Motivator,’ Wearables Are Gaining Popularity,” Corp! Sept./Oct. 2016, pages 36-39.
Original source: Soreon Research

Fine Art Market

Today we look at the global trade in fine art. This market is measured by looking at sales through public auctions as well as industry estimates of art gallery and private art dealer sales based on polls of over 6,500 dealers around the world. While the market in 2015 was down by 7% from 2014, the United State’s portion of the market grew, reaching 43% of the total. This is because the United States saw increases in fine art sales from both 2013 to 2014 and again from 2014 to 2015 while global fine art sales were dropping.

Globally, the market became more top heavy in 2015 with a rise in ultra-high-end transactions, those valued at over $10 million each. This portion of the fine art market accounted for 28% of the total in 2015.

Geographic reference: World
Year: 2015
Market size: $63.8 billion
Source: Alexander Forbes, “The 10 Most Important Takeaways from the 2016 TEFAF Art Market Report,” Artsy Editorial, March 11, 2016, available online here
Original source: The European Fine Art Foundation (TEFAF) 2016 Art Market Report

U.S. Wholesale Trade

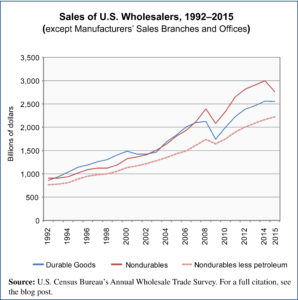
wholesaleToday’s market size is the size of the wholesale trade industry in the United States. This industry breaks down into those who work with durable goods—furniture, cars, trucks, construction materials, electronics, appliances and the like—and those who deal in nondurables—food, clothes, paper products, drugs, gas, and other such.

The graph shows total annual sales made by wholesale firms that are not also manufacturers over the period 1992-2015. The sales are broken out by the two major categories discussed, durable goods and nondurable goods. There is also one further line presented, one showing sales of all nondurable goods wholesalers other than those selling petroleum and petroleum products. We have added this line by way of showing how much less volatility there is in annual sales volumes when the petroleum sector is removed from the nondurables category.

Geographic reference: United States
Year: 2000, 2009 and 2015
Market size: $2.81, $3.83 and $5.32 billion respectively
Source: “Table 2. Revised (Not Adjusted) Estimates of Monthly Sales, Inventories, and Inventories/Sales Ratios of Merchant Wholesalers, Except Manufacturers’ Sales Branches and Offices: January 1992 Through July 2016, Monthly & Annual Wholesale Trade reports, U.S. Census Bureau, available online here
Original source: U.S. Department of Commerce

Firearms in the United States

Firearms2Today’s market size is the rising number of firearm background checks being seen annually in the United States. As can be seen in the graph to the right, the number of background checks have been on the climb annually since the turn of the century and have been climbing at a faster pace since 2005. In terms of checks by type of gun to be purchased, checks associated with handguns have risen at a slightly faster rate than checks for other types of firearms.

The number of background checks is not the same as the number of firearm purchases since not every background check is followed by a purchase and some background checks are followed by the purchase of multiple guns. Furthermore, an average of one percent of background checks results in a denial of eligibility to purchase a firearm. Nonetheless, the NICS firearm background check system statistics are one of the most accurate means of tracking gun sales at the national level in the United States.

Geographic reference: United States
Year: 2015
Market size: 23.03 million checks
Source: “Firearm Commerce in the United States, Annual Statistical Update, 2015,” U.S. Bureau of Alcohol, Tobacco, Firearms and Explosives, available online here. For an explanation of the NICS program, see the FBI website here.
Original source: U.S. Department of Justice.

Information Sector

Info. SectorToday we’re looking at one sector of the U.S. economy, the Information Sector. This sector includes industries such as publishing, movie making, telecommunications, broadcasting, data processing, web hosting and all sorts of Internet activities associated with the dissemination of information. The sector is identified in the North American Industrial Coding System (NAICS) as sector 51 and includes the activities of 78 industries.

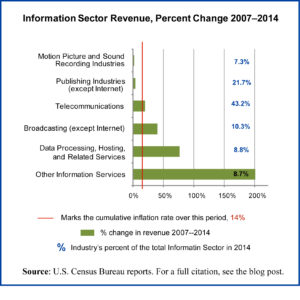
Total revenue for this sector grew by 26% from 2007 to 2014, making it one of the better-performing sectors within the larger Service Sector. Yet a closer look at the main groups in the Information Sector shows that their paths vary greatly over this period. The broadcasting industries and those related to the Internet saw real growth while the others saw little if any growth, considering that the cumulative inflation rate over this period was 14%.

The chart above shows the growth each of the industrial sectors within the Information Sector has had over the period at which we’re looking and includes a red line showing the cumulative rate of inflation over the period. Real growth only happened in the industries whose growth rate exceeded the cumulative rate of inflation.

Geographic reference: United States
Year: 2007 and 2014
Market size: $1.08 and $1.37 trillion respectively
Source: “Table 1: Estimated Revenue for Employer and Nonemployer Firms: 2007 through 2014,” 2014 Services Annual Survey, U.S. Census Bureau, January 28, 2016, available online here.
Original source: U.S. Department of Commerce, Bureau of the Census
Posted on May 24, 2016

Welcome to the new Market Size Blog

We’re in the process of moving our website from one hosting site to another and redesigning it. Soon we’ll be fully up and running again but in the meantime, this site will be constantly changing and a little chaotic.

Once we’re ready we’ll have a little launch party.

Until then, cheers!

Student Loan Debt

Today’s market size is the amount owed in the United States for loans taken to finance higher education. The figures, which come from reports produced by the Federal Reserve Banking system, appear in an interesting article about the opportunity costs of having a large part of the younger generation beginning its productive life carrying a significant debt load. This fact may begin to explain the decline in first-time home purchases as well as declining numbers of new business start-up, two activities that require a population with more debt capacity than young people in the United Sates have these days.

Geographic reference: United States
Year: 2003 and 2013
Market size: $300 billion and $1.1 trillion respectively
Source: Phyllis Korkki, “Ripple Effects From Rising Student Debt,” The New York Times, May 25, 2014, pages B6.
Original source: Professor Brent W. Ambrose of Pennsylvania State University and Larry Cordell and Shuwei Ma of the Federal Reserve Bank of Philadelphia.
Posted on May 30, 2014

Paper Manufacturing

The production of paper of all types in the United States fell, as did most production activity, during the recession of 2007–2009 but regained most of the losses by 2011. The industry also adjusted to lower demand by increasing exports and reducing imports, a pattern seen in many industries over the past six years. Between 2007 and 2011 paper production fell and then regained all but 0.1% of its 2007 total while paper exports rose 26.2% and exports fell by 7.2%.

Today’s market size is the value of U.S. paper manufacturer shipments in 2007 and 2011.

Geographic reference: United States
Year: 2007 and 2011
Market size: $176.12 billion and $175.88 billion respectively
Source: “General Statistics: Statistics for Industry Groups and Industries: 2011 and 2010,” Annual Survey of Manufactures, available on the Census Bureau’s American FactFinder website here. Data for NAICS 322-Paper Manufacturing from U.S. International Trade Statistics, database also produced and made available online by the Census Bureau, here.
Original source: U.S. Department of Commerce, Bureau of the Census
Posted on April 16, 2014

Appliance and Electronics Stores

ApplianceStores

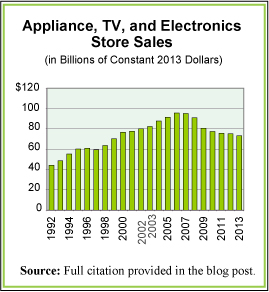
Today’s market size is the sales volume of appliance, TV, and electronics stores in the United States in 2013. Sales through these stores grew 26% from 2000 to 2013. However, as is often the case with a single measure, that single statistic does not tell the full story. Sales peaked in 2007 and between then and 2013 they declined by 15%. When one takes inflation out of the mix, the picture changes further yet. In inflation-adjusted dollars, sales from 2000 to 2013 actually fell by 5% and between 2007 and 2013 they fell by 23%. The trend is clear in the graph we provide which shows sales annually in inflation-adjusted, constant 2013 dollars.

Geographic reference: United States
Year: 2013
Market size: $73.29 billion
Source: “Estimated Annual Sales of U.S. Retail and Food Services Firms by Kind of Business: 1992 Through 2012,” Annual Retail Trade Survey 2012, U.S. Census Bureau, March 31, 2014, available online here. “Retail and Food Service Sales,” January 2014 Monthly Retail Trade and Food Service Report, U.S. Census Bureau, March 13, 2014, available online at the same site linked to above. Constant 2013 dollars were calculated using “Table 1.1.9. Implicit Price Deflators for Gross Domestic Product,” part of the National Income and Products Accounts Tables produced by the Bureau of Economic Analysis and available online here.
Original source: U.S. Department of Commerce, Bureau of the Census and Bureau of Economic Analysis
Posted on April 4, 2014

Movie Tickets

The Motion Picture Association of America tracks movie box office receipts very closely. The resulting statistics are available rather quickly for North America but they take longer to come in from other parts of the world. Revenues from theatrical releases of a movie are only the beginning of the revenue generated by a film. Nonetheless, they are important to the movie industry and they are growing most strongly outside the industrialized world, where the number of theaters being opened annually is rising.

Today’s market size is the global box office revenue in 2008 and 2012, with a geographical breakdown to show what percentage of the total revenue was generated in the U.S. and Canada.

Geographic reference: World
Year: 2008 and 2012
Market size: $27.7 billion (U.S./Canada 53.3%) and $34.7 billion (U.S./Canada 45.2%)
Source: “Global Box Office—All Firms (US$ Billions),” Theatrical Market Statistics 2012, MPAA, Summer 2013, page 4, available online here.
Original source: Motion Picture Association of America, Inc. and Rentrak Corporation
Posted on April 2, 2014