Greeting Card Publishers

I’m dreaming of a white Christmas
With every Christmas card I write
May your days be merry and bright
And may all your Christmases be white
— Lyrics from “White Christmas,” by Irving Berlin

greeting cardThe holiday season. That time between Thanksgiving and New Year’s Day. Or is it between Halloween and New Year’s Day? The retail holiday season seems to start earlier every year. It’s the time of year when we hear terms such as Black Friday and Cyber Monday, when advertisements for gifts for young and old alike are more numerous and sales abound in stores and online. For many people dates on the calendar are filled with shopping, trips to see Santa, holiday baking and decorating, religious services, parties, and get-togethers with friends and family.

Amidst all this busyness, some will find quiet time to sit down and address Christmas cards to their friends and loved ones, wishing them well in the new year and letting them know they are thought of warmly. Much has changed since 1875 when the first Christmas card was printed in the United States. Nowadays more people are sending greetings online, but paper greeting cards have not fallen out of favor. According to the Greeting Card Association, consumers in the United States buy 6.5 billion greeting cards annually, approximately a quarter of which—1.6 billion—are Christmas cards,1 the most popular type of seasonal greeting card. Valentine’s Day cards and Mother’s Day cards are a distant second and third, with 145 million2 and 133 million units sold respectively.

Today’s market size shows the number of greeting card publishing establishments in the United States in 2006 and 2016 according to the U.S. Census Bureau’s County Business Patterns survey. While there were fewer establishments in 2016 than there were in 2006, the number of people employed rose from 12,765 to 13,842 over this time period. The average yearly wages for workers in this industry, however, dropped dramatically, from $49,442 in 2006 to $34,199 in 2016.

1 Including boxed cards.
2 Not including classroom valentines.

Geographic reference: United States
Year: 2006 and 2016
Market size: 132 and 99 respectively
Sources: County Business Patterns, American FactFinder, United States Census Bureau, various years available online here; “About Greeting Cards – General Facts,” Greeting Card Association, July 2016 available online here; John Hanc, “The History of the Christmas Card,” Smithsonian.com, December 9, 2015 available online here; “White Christmas Lyrics – Irving Berlin” available online here.
Image source: BiljaST, “christmas-new-year-happy-3003907,” Pixabay, December 2017 available online here.

Audiobooks

According to a July 2016 article in The Wall Street Journal, audiobooks are the fastest-growing format in publishing. From 2014 to 2015, sales increased 20.7 percent and unit sales grew 24.1 percent.

Several factors may have contributed to this increase in sales. First, there are more ways consumers can listen to audiobooks: mobile devices, such as smartphones, smartwatches, and tablets; in-car devices, such as Android Auto and Apple CarPlay; and in-home devices, such as Amazon Echo and Google Home. Second, obtaining audiobooks has become easier. Libraries offer digital downloads of audiobooks as do subscription audiobook services and services such as Apple iTunes and Google Play which allow instant access to whatever the consumer wants to read at that moment. Also, according to Ian Small, CEO of Audiobooks.com, the popularity of podcasting has influenced the millennial generation’s new-found interest in audiobooks.

Today’s market size is the total sales of audiobooks in 2015, 90.4 percent of which is made up of adult titles, with a bit more than three-quarters of that being adult fiction.

Geographic reference: United States
Year: 2015
Market size: $1.77 billion
Sources: Bacon, Beth, “Trending Up: What’s Fueling and Feeding the Audiobook Boom?” DBW, April 11, 2017, available online here; Maloney, Jennifer, “The Fastest-Growing Format in Publishing: Audiobooks,” The Wall Street Journal, July 21, 2016, available online here.
Original source: Audio Publishing Association

Information Sector

Info. SectorToday we’re looking at one sector of the U.S. economy, the Information Sector. This sector includes industries such as publishing, movie making, telecommunications, broadcasting, data processing, web hosting and all sorts of Internet activities associated with the dissemination of information. The sector is identified in the North American Industrial Coding System (NAICS) as sector 51 and includes the activities of 78 industries.

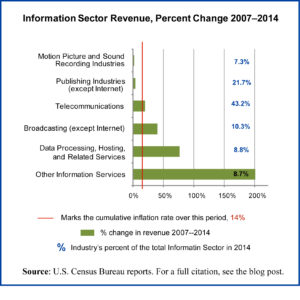
Total revenue for this sector grew by 26% from 2007 to 2014, making it one of the better-performing sectors within the larger Service Sector. Yet a closer look at the main groups in the Information Sector shows that their paths vary greatly over this period. The broadcasting industries and those related to the Internet saw real growth while the others saw little if any growth, considering that the cumulative inflation rate over this period was 14%.

The chart above shows the growth each of the industrial sectors within the Information Sector has had over the period at which we’re looking and includes a red line showing the cumulative rate of inflation over the period. Real growth only happened in the industries whose growth rate exceeded the cumulative rate of inflation.

Geographic reference: United States
Year: 2007 and 2014
Market size: $1.08 and $1.37 trillion respectively
Source: “Table 1: Estimated Revenue for Employer and Nonemployer Firms: 2007 through 2014,” 2014 Services Annual Survey, U.S. Census Bureau, January 28, 2016, available online here.
Original source: U.S. Department of Commerce, Bureau of the Census
Posted on May 24, 2016

Library Spending

Library-interior

Today’s market size is the dollar amount spent, worldwide, by libraries on content. “Content” in this context refers to all material, physical or digital, purchased by libraries to become a part of their offerings.

Geographic reference: World
Year: 2011 and estimates for 2013
Market size: $23.78 billion and $24.79 billion respectively
Source: Andrew Neilson, “Content Spending by Library Type and Geography, 2011,” The Rise of eBooks: Global eBooks Trends, Elsevier, June 23, 2013, available online here. The photo comes from this website and is an interior shot of the Washington State Library.
Original source: Outsell, Inc.
Posted on February 27, 2014

Newsprint

Newsprint

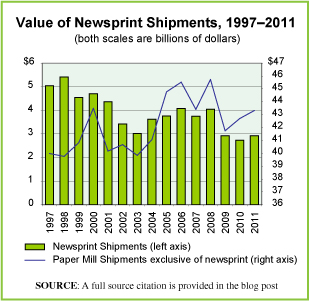
Newsprint is a grade of paper used primarily for printing newspapers, advertising inserts and advertising mailers. It comes not in sheets but in huge, long rolls for use in web offset, letterpress, and flexographic printers. As the digitizing of information has advanced, it will come as no surprise to see that the demand for newsprint has been on the decline. We made a graph to show how the value of newsprint shipments by the paper industry have fared over the last fifteen years in the United States. The newsprint industry is designated as NAICS 322122 by the U.S. Census Bureau.

Since the majority of newsprint is used in the production of newspapers, the decline of the newspaper industry is mirrored in the decline of newsprint production. Among the factors causing a decline in the newspaper industry are a declining readership, particularly that of young adults, the rise of digital editions for which paid subscriptions are far less, and the decline in advertising revenue that has resulted as advertisers’ budgets are being split among a growing number of media outlets, many online. For figures on the newspaper industry, check our earlier posts on that market, here.

Today’s market size is the value of U.S. newsprint shipments at the wholesale level in 1998 (a peak year for shipments) and 2011. Worth noting is the fact that declines in newsprint have exceeded declines in newspaper circulation during this period—46% decline in newsprint shipments versus 21% decline for daily newspaper circulation—suggesting that the papers that are in circulation are not only fewer than before, but have fewer pages as well.

Geographic reference: United States
Year: 1998 and 2011
Market size: $5.42 billion and $2.92 billion respectively
Source: “Value of Shipments for Product Classes,” Annual Survey of Manufactures, editions: 2001, 2005, 2008 and 2011. This series of reports is produced by the U.S. Bureau of the Census in all non Economic Census years. The reports are available online through the Census Bureau’s American FactFinder system, here. Newspaper circulation data are from “Newspaper Circulation Volume,” Newspaper Association of America, September 4, 2012, available online here.
Original source: First Research and the U.S. Bureau of the Census
Posted on September 12, 2013

Paper Consumption

While the use of paper and paper products has not declined significantly—despite much talk in the 1990s of a coming paperless society—the publishing industry is using less paper. According to a new industry report, paper consumption by the book industry declined by 34% from 2006 to 2010, due in part to the great recession and in part to increasing sales of e-books. This information comes from a report whose primary purpose was to track the book publishing industry’s overall environmental impact on the world. Another item highlighted in the report is the increasing quantity of recycled material in the paper that is used by the industry. According to the report, the use of recycled fiber by the book publishing industry rose from 5% of all fiber in 2004 to 24% in 2010.

By way of placing this information in the context of the larger paper industry, it is worth noting that during the period covered in the Book Industry Environmental Trends report, the total value of product shipments made by U.S. Paper and Newsprint Mills dropped by 6.2%, from $45.5 billion in 2006 to $42.7 billion in 2010. In 2006, newsprint represented 7% of the value of all paper mill product shipments and by 2010 that percentage had fallen to 3.6%. But, a discussion of newsprint takes us into a complex niche within the paper market, one we will cover in another post one day soon.

Today’s market size is the volume of paper consumed by the U.S. book industry in 2006 and 2010.

Geographic reference: United States
Year: 2006 and 2010
Market size: 1.76 million tons and 1.16 million tons respectively
Source: Jim Milliot, “Keeping the Green in Publishing,” Publishers Weekly, July 22, 2013, pages 5-6, available online here. The rate of decline in value of output by U.S. Paper and Newsprint Mills was calculated from figures published by the U.S. Census Bureau in its Annual Survey of Manufacturers, (ASM) series of reports, “Value of Product Shipments,” and specifically, data reported under NAICS codes 322121 and 322122. The ASM data are available online here.
Original source: Book Industry Environmental Trends and U.S. Census Bureau
Posted on September 10, 2013

Newspapers

Newspapers

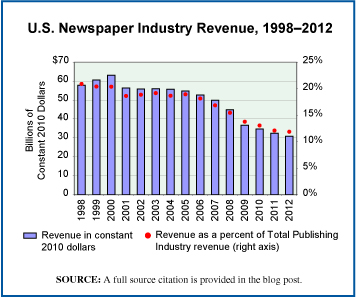
The news this week about The Washington Post being purchased for $250 million by Amazon founder Jeff Bezos made us want to update an earlier post about the newspaper industry, here. And so, we present today’s market size post, including a chart that shows U.S. newspaper industry revenues, annually, since 1998. Clearly, an industry going through significant change.

Geographic reference: United States
Year: 2000 and 2012
Market size: $50.29 billion and $32.04 billion respectively
Source: “Table 3.0.1 Information Sector Services (NAICS 51) — Estimated Revenue for Employer Firms: 1998 Through 2004,” Service Annual Survey, April 2006, page 24, available online here, and annual updates of the same which are available on the Census Bureau’s site here.
Original source: U.S. Census Bureau
Posted on August 9, 2013

Trade Books

The Association of American Publishers (AAP) tracks the sales of its members. It has had an increasingly difficult task in tracking sales over the last decade or so, as the industry deals with dramatic changes in distribution networks (bookstores), in the product itself (print versus digital) and in the rise of self-publishing. The AAP report on 2012 sales shows a 7.4% improvement in the sale of trade books over 2011. Trade books are defined as those intended for general readership and are sold through a general retail outlet—whether fiction or nonfiction, print or e-book, and/or brick-and-mortar stores or online sales. The total value of trade book sales in 2012 was, however, far short of that reached in 2007, the peak year for sales during the first decade of the new century.

Today’s market size is based on the sale of trade books, published by the large and middle-sized American book publishers—AAP members—in 2007 and 2012.

Geographic reference: United States
Year: 2007 and 2012
Market size: $8.53 billion and $6.53 billion respectively
Source: “Today’s Lunch: Weak December Doesn’t Spoil 2012 Trade Gain of 7.4 Percent,” article in the April 11, 2013, Publishers Lunch newsletter. Access to the newsletter’s website is here. The data on 2007 sales comes from “Association of American Publishers 2009 S1 Report — Estimated Book Publishing Industry Net Sales 2002-2009,” available online here.
Original source: Association of American Publishers
Posted on April 12, 2013

Newspapers

Annual revenue generated by the newspaper industry in the United States fell again in 2010, following a pattern seen throughout the last decade. The most recent Service Annual Survey, published by the U.S. Census Bureau, shows a decline in revenues from 2005 to 2010 for the newspaper publishing industry of 30 percent, and this represents a loss of revenue before inflation. The loss, when adjusted for inflation, was 42 percent.

Today’s market size is the size of the newspaper industry in the United States based on annual revenues in 2010.

Geographic reference: United States
Year: 2010
Market size: $34.7 billion
Source: “Table 3.0.1 Information Sector (NAICS 51)—Estimated Revenue for Employer Firms: 2005 through 2010,” Service Annual Survey, February 2, 2012, available online here.
Posted on February 20, 2012

Textbooks

An announcement is expected on Thursday, January 19th, from Apple Corporation having to do with their plans in the area of electronic textbooks. As one might imagine, much attention is being paid to this news by the academic world and the publishing world alike.

Today’s market size is an estimated total value of textbook sales in the United States based on a quote from Steve Jobs in the recently published biography about him by Walter Issacson. A brief look at the Census Bureau’s data on the topic suggests that the estimate is reasonable. The Census Bureau figure is provided here as well.

Geographic reference: United States
Year: 2007 and 2010
Market size: $7.06 billion in 2007 (Census data) and $8 billion (Jobs quote from 2010 which appears in the biography Steve Jobs
Source: “Sector 51: Information: Industry Series: Preliminary Product Lines by Kind of Business for the United States: 2007,” 2007 Economic Census, available here. The Jobs quote is from an article by Roger Yu in USA Today, titled “Technology, Costs, Lack of Appeal Slow E-textbook Adoption,” published on January 16, 2012 and available here.
Original source: U.S. Census Bureau
Posted on January 18, 2012

Books

During this season of gift-giving, books are one category of gift that has seen some growth in recent years. The publishing industry is going through significant changes as it adjusts to huge shifts in the world of publishing, originating for the most part from the digitizing of its products and the move to selling electronically, whether traditional books or digitized books.

Today’s market size is the size of the U.S. book publishing industry based on net sales revenues. The market sizes listed below are based on traditional publisher sales— regardless of the format of the books sold—but do not include sales made by self-publishers or some very small imprints.

Geographic reference: United States
Year: 2008 and 2010
Market size: $26.5 and $27.9 billion respectively
Source: “BookStats Overall Highlights,” a report by the Association of American Publishers and made available online here.
Original source: Association of American Publishers
Posted on December 23, 2011

“e-Learning” Hardware and Software

The use of computers and other technological devices in the classroom has long been a source of debate among educators. Equipping schools with the most cutting edge technology is costly and the benefits of these expenditures in actually teaching students is not always evident. Nonetheless, in a world in which computers are ubiquitous the desire to have our children use modern technology with confidence helps to drive growth in the market for “e-learning” devices and software.

Today’s market size is a forecast of the value of the e-learning sub-sector of “the global education market” in the year 2015.

Geographic reference: World
Year: Forecast for 2015
Market size: $69 Billion
Source: “Brave New World: The Changing Landscape of Education and Technology,” April 2010, a report posted online by the firm Spire Research & Consulting and available here.
Original source: Marijk van der Wende, “The Role of US Higher Education in the Global E-Learning Market,” Center for Higher Education Policy Studies (CHEPS), Research & Occasional Paper Series, University of California, Berkeley, 2002
Posted on September 14, 2011

Higher Education Publishing

Higher education publishing includes “multiplatform course learning systems and materials for college and university students and faculty.” From 2008 to 2010, net revenue in this area of publishing saw annual growth of 15.5% and 6.6%, respectively. This segment of the publishing world has long known that during times of economic slowdown many people try and make the best of a bad situation and go back to school. Data show the net revenue for 2010.

Geographic reference United States
Year: 2010
Market Size: $4.55 billion
Source: Association of American Publishers, “BookStats Publishing Categories Highlights,” 2011, available online here and Association of American Publishers, “BookStats and Publishing Industry Glossary,” 2011, available online here.
Original source: BookStats
Posted on September 1, 2011

K-12 School Publishing

K-12 school publishing includes a wide range of learning tools for students and teaching aids for teachers in both public and private schools. Unlike other publishing, revenue in this category is affected by federal and state government funding. After dropping 12.4% from 2008 to 2009, net revenue increased 7.1% from 2009 to 2010. Data show the net revenue in 2010.

Geographic reference: United States
Year: 2010
Market size: $5.51 billion
Source: The Association of American Publishers, “BookStats Publishing Categories Highlights,” 2011, available online here.
Original source: BookStats
Posted on August 31, 2011

Streaming Video

Netflix and Hulu are two services that allow their customers to stream videos. A March 2011 Nielsen survey found that a majority of Netflix users who stream videos watch them on their TVs through gaming consoles, while a majority of Hulu users stream video on their computers.

Data are the number of videos streamed in the United States in May 2011. This was an all-time high.

Geographic reference: United States
Year: May 2011
Market size: 15 billion videos
Source: The Associated Press, “Half of Netflix Use Done on Consoles,” Lansing State Journal, July 31, 2011, page 4E

Coupons

In 2010, 332 billion coupons were issued in the United States, 88% of them were in newspaper inserts. Of those 332 billion, a mere 1%, or 3.3 billion, were redeemed. The data show the estimated total amount saved by consumers who redeemed coupons.

Geographic reference: United States
Year: 2010
Market size: $3.7 billion
Source: Jean Chatzky, “How You Can Become a Coupon Queen,” USA Weekend, July 29-31, 2011, pages 6-7, 9
Original source: NCH Marketing
Posted on August 11, 2011

Catholic Diocesan Newspapers and Magazines

Today’s market size is a measure of the market for Catholic diocesan newspapers and magazines measured in circulation figures. The figures are rounded.

Geographic reference: United States and Canada
Year: 2010
Market size: 13 million households
Source: Sam Ludero, “Bishop: Newspapers Need Attention, Still Have Major Role,” The Catholic Times, July 2 – July 8, 2011, page 1
Original source: Catholic Press Association’s official directory
Posted on July 14, 2011 — Happy Bastille Day to our French friends!

Financial Information

The market for financial information can be defined in many ways. Most often it is understood to be the market used by investors who wish to study the stock market with an eye on decisions related to whether to invest in, and when to invest in, a particular company’s stock, a fund of stocks, or a particular industrial sector. The leaders in the field of financial information are Thomson Reuters and Bloomberg. Today’s market size is the estimated total worldwide of money spent on financial information in 2008.

Geographic reference: World
Year: 2008
Market size: $23.01 billion
Source: “Burton-Taylor Data Indicates Challenging Year for Thomson Reuters, Bloomberg and Financial Information/Analysis Market,” Press Release dated February 18, 2009 and available online here.
Original source: Burton-Taylor International Consulting L.L.C.

Online Sale of Books & Magazines

One of the industries being most buffeted by the transition to e-commerce is publishing. For decades book publishers have used a network of book retailers as their primary means of getting books to the general public. With the advent of e-commerce this began to change. One can see clearly the speed with which this shift has altered the bookselling landscape. Amazon was started in 1994 and by 2010 it became the largest retailer of books in the United States. The previous book retailing leaders, Barnes & Noble and Borders (which entered bankruptcy reorganization this month) have scrambled to adjust to the new world of selling books while independent booksellers continue to hang on for dear life, declining in number every year as they have since the 1980s with the rise of Barnes & Noble and Borders.

Further complicating this dynamic shifting within the book world is the fact that books and magazines themselves are reasonably easily digitized. This means that the Internet provided a means not only to place orders for books and magazines but to instantly receive them in a digital format. While the shift to e-books is still young—representing less than 9% of the trade book market in 2010—it is a vibrant part of the publishing business and is coloring many of the actions taken by publishers and booksellers alike as they try and adapt to the new realities of the retail landscape for books, magazines, and all printed material.

For anyone interested in more statistics on this subject, we studied it closely last year and have a series of posts on the subject at another of our sites, the Dwarf Planet Press blog site, available here.

Geographic reference: United States
Year: 2003 and 2008
Market size: Sales: $2.06 and $5.14 billion respectively, an increase of 149%.
Source: “Table 1055. Electronic Shopping and Mail-Order Houses—Total and E-Commerce Sales by Merchandise Line,” Statistical Abstract of the United States: 2011, U.S. Census Bureau, page 663, available online here in a spreadsheet format, and here as a PDF file.
One word of clarification to help prevent any confusion about just what is being presented here. The data in the source table are provided in two columns per year, the first one called “Total,” and the second is “E-Commerce”. The column headed “Total” refers to the total sales for the industry “Electronic Shopping and Mail-order Houses,” [NAICS 4541], and the second column is the e-commerce portion of that industry’s total. Do not confuse the “Total” column for a measure of total sales of the product line listed in that row. It is, rather, the total sales of that product line made electronically and through mail-order houses.
Original source: U.S. Department of Commerce, Bureau of the Census.

Market for Books, Print Books

When it comes to sales growth rates, completely new products have a vast advantage over mature products. Within the book business, eBooks are the new thing right now. As the sale of eBooks continue to rise quickly, many wonder what impact they will have on the sale of printed books. The market sizes listed here are for print books, pBooks if you will, and do not include eBook or audiobook sales.

Geographic reference: United States
Year: 2003 and 2009
Market size: $22.2 billion and $23.4 billion respectively
Source: Association of American Publishers, 2009 S1 Report, February 2010, page 2 available online here.
Original source: AAP and Management Practice