Moving Services

Have you moved to a new residence in the past year? If you have, you’re not alone. According to the U.S. Census Bureau, nearly 32.4 million people changed residences from 2017 to 2018. While this might seem like a high number, as a percentage of the total population, it’s the lowest it has been in at least 70 years. From 1948 through the mid-1960s, the percentage of the population who moved during the year stayed steady around 20%, then declined from the mid-1960s to the 1980s, spiking briefly to 20.2% in 1984-1985. Since then the percentage of movers has trended downward, reaching 10.1% in 2017-2018. Most were interstate moves, 60.51%, but this was down from 65.51% a year earlier. According to the U.S. Census Bureau’s Current Population Survey, most people move to establish a new household or for other family reasons.1 Moving due to a new job or job transfer ranked third.

Today’s market size shows the total revenues for moving services in the United States. Companies in this industry transport used household, institutional, or commercial furniture and equipment via local or long-distance truck, as well as provide related packing and storage services. Various sources provide a wide range of total revenue figures. The American Moving and Storage Association states that annual revenues in this industry total $12.6 billion. IBISWorld reports revenues of $17.9 billion in 2019. The figure stated below is from Dun & Bradstreet. Nearly 70% of the revenue results from local and long-distance transportation services, followed by warehousing and storage services (20.2%). Packing and packaging services account for 7.5% of the total. Leading companies in this industry include UniGroup, which owns United Van Lines and Mayflower Transit; SIRVA, which owns Allied Van Lines and northAmerican Moving Services; and Atlas Van Lines. However, nearly 50% of companies in this industry are small businesses, employing fewer than 5 people. Only 8.5% of companies employ 100 people or more.

1 Other family reasons unrelated to establishing a new household or change in marital status. Change in marital status ranked fifth after moving to be closer to a job.

Geographic reference: United States
Year: 2019
Market size: $15 billion
Sources: “Moving Services Industry Profile,” Dun & Bradstreet First Research, June 3, 2019 available online here; “CPS Historical Migration/Geographic Mobility Tables,” U.S. Census Bureau, November 27, 2018 available online here; “About Our Industry,” American Moving and Storage Association available online here; Michael C., “Moving Trends & Relocation Industry Analysis,” Movers Development, May 10, 2019 available online here; “Moving Services Industry Insights From D&B Hoovers,” D&B Hoovers available online here; “Moving Services Industry in the US – Market Research Report,” IBISWorld, July 2019 available online here.
Image source: Clker-Free-Vector-Images, “movers-packing-box-light-vase-24403,” Pixabay, April 3, 2012 available online here.

Online Dating

Online dating

For many finding a spouse or someone to have a long-term relationship with is difficult. From the 1940s through the 2000s a large percentage of people met their significant other through friends. In addition, many couples met in bars and restaurants, at college, church, and their workplaces. When meeting people through these avenues failed, some people decided to expand their social network in nontraditional ways. Over the years this has included placing personal ads in newspapers, signing up for computer dating, and using online dating services.

What was likely the first personal ad appeared in 1695 in the Collection for the Improvement of Husbandry and Trade, a periodical published in London, England. A 30-year old gentleman wanted to “willingly match himself to some Good Young Gentlewoman that has a fortune of £3,000 or thereabouts.” Over the centuries, personal ads became commonplace in newspapers, including for most of the 20th century, however; few marriages resulted. In the United States, only about 1% of relationships that led to marriage began with couples meeting via these ads.

Before the Internet, in the 1960s and 1970s, several companies offered computer dating services. Applicants would fill out questionnaires and mail them to the company, then their responses would be compared to responses from other applicants via a computer. A person would need to wait days or weeks for a packet of information to arrive in the mail if the computer found one or more matches.

In the 1990s, personal computers and access to the World Wide Web became more prevalent and graphical browsers became more popular. In 1995, match.com became the first company to offer an online service similar to newspaper personal ads and computer dating services. For a fee users would be allowed to post profiles online—a picture, biographical information, and answers to a questionnaire—and then be able to browse the profiles of other users and contact those with whom they were interested in dating. Match.com’s initial target audiences were the gay and lesbian community and technology professionals. Women, in particular, were also encouraged to sign up with the belief that if there were a large pool of women to choose from, men would then be willing to sign up for the service also. In 2004, Guinness World Records recognized Match.com as the largest online dating site, with 15 million active members worldwide at the time and 42 million members registering with the service since its debut in 1995. Since the late 1990s, thousands of other companies have offered their own online dating services, both for the general public and catering to specific groups based on political views, religious beliefs, hobbies, lifestyle or profession. In 2010, more than 20% of opposite-sex couples met online. The internet overtook churches, neighborhoods, classrooms, and offices as a more popular place for couples to meet. That same year, nearly 70% of same-sex couples met online.

As usage of personal computers and laptops gave way to mobile devices and smartphones, online dating apps flourished. In 2013, Tinder became the first online dating app that introduced a simple interface for accepting or rejecting a potential partner: swipe right for “yes” and swipe left for “no”. If two people swiped right, they were given each other’s contact information. Location-based services became part of some apps. Users could be matched with others who frequent the same public places, such as restaurants, bars, or concert venues. While some of these online services and apps have a reputation for facilitating hookups rather than long-term, meaningful relationships, 84% of users surveyed said they use these sites to find romantic relationships. Only 24% reported looking for hookups. In 2018 in the United States, nearly one in six relationships that led to marriage started through an online dating service or app. More than half of adults aged 18-34 know someone who uses online dating and a third know someone who entered into a long-term relationship as a result. College graduates and those earning more than $75,000 per year are most likely to know someone who uses online dating and who has entered a long-term relationship after meeting someone online.

More than 260 million people worldwide and tens of millions of people in the United States have tried online dating, and yet there is still a stigma attached. A Pew Research Center survey in 2015 found that 23% of people thought that those who use online dating services are desperate. However, this is down from 29% in 2006.

Today’s market size shows the total revenues of online dating services worldwide. Revenues for Match Group, which owns Tinder, match.com, and 40 other similar businesses totaled $1.3 billion in 2017, more than a quarter of the global revenue for the entire industry.

Geographic reference: World
Year: 2018
Market size: $4.6 billion
Sources: “Putting the Data into Dating,” The Economist, August 18, 2018, pages 19-21; “History of the Web Browser,” Wikipedia, December 18, 2018 available online here; “Match.com,” Wikipedia, December 16, 2018 available online here; Louise Matsakis, “Tinder’s Days as a Hookup App May Be Over,” Wired, April 23, 2018 available online here; “Timeline of Online Dating Services,” Wikipedia, September 4, 2018 available online here; John Hendel, “Old, Weird Tech: Computer Dating of the 1960s,” The Atlantic, February 14, 2011 available online here; Aaron Smith and Monica Anderson, “5 Facts About Online Dating,” FactTank: News In the Numbers, Pew Research Center, February 29, 2016 available online here; “Online Dating,” Statista available online here; Aaron Smith, “15% of American Adults Have Used Online Dating Sites or Mobile Dating Apps,” Pew Research Center, February 11, 2016 available online here; Hayley Matthews, “27 Online Dating Statistics & What They Mean for the Future of Dating,” DatingNews.com, June 15, 2018 available online here.
Image source: Athree23, “heart-love-keyboard-enter-button-3698156,” Pixabay, October 2018, available online here.

Fortune-Telling Industry in South Korea

fortune telling tarot cardsWhat will the future hold? A question many of us ask ourselves, especially at this time of the year. While most people just ponder this question idly, many in South Korea seek out more definitive answers, they believe, from fortune-tellers who offer services such as face-, palm-, and tarot card reading and saju, an ancient practice of analyzing the cosmic energy at the hour, day, month, and year of a person’s birth from Chinese astrological records and texts. Saju and face-reading are recognized academic pursuits in South Korea.

According to Paik Woon-san, head of the Association of Korean Prophets, there are more than 300,000 fortune-tellers in South Korea and 150,000 shamans, many of whom offer fortune-telling services. Two-thirds of people surveyed by Trend Monitor, a marketing firm, said that they visit a fortune teller at least once a year. Most visit between December and February to learn what is foretold for their lives in the new year. The practice of going to soothsayers is passed down within families. It is “one possible way by which to make sense of the world,” says Andrew Eungi Kim, a professor at Korea University.

Today’s market size shows the estimated revenue earned in the fortune-telling industry in South Korea according to the Korea Economic Daily, a newspaper.1 Whether people seek out fortune-tellers for entertainment or for decision-making guidance, some who may have sought face-to-face interactions at brick-and-mortar businesses are now downloading mobile apps. Handasoft’s most popular fortune-telling app, Jeomsin, has been downloaded more than 3 million times.

1 The source does not provide a date. It states, “[T]he otherworldly in South Korea will soon be a 4trn won ($3.7bn) business”. The editors of this blog interpret “soon” to mean in 2018 or 2019. The source article was written in February 2018.

Geographic reference: South Korea
Year: 20181
Market size: $3.7 billion (4 trillion won)
Source: “In South Korea Fortune-Telling Will Soon Be a $3.7bn Business,” The Economist, February 24, 2018 available online here.
Image source: MiraCosic, “tarot-cards-magic-fortune-telling-991041,” Pixabay, October 16, 2015 available online here.

Home Health Care Services

With an aging population it will come as no surprise to most people that the home health care services industry has seen steady growth over the last decades and is forecast to see continued growth well into the next decade.

Today’s market size post is the revenue earned in 2002 and 2012 by all firms with employees in the business of providing home health care services in the United States. This industry [NAICS 6216] is defined as follows by the Census Bureau: “This industry comprises establishments primarily engaged in providing skilled nursing services in the home, along with a range of the following: personal care services; homemaker and companion services; physical therapy; medical social services; medications; medical equipment and supplies; counseling; 24-hour home care; occupation and vocational therapy; dietary and nutritional services; speech therapy; audiology; and high-tech care, such as intravenous therapy.”

Geographic reference: United States
Year: 2002 and 2012
Market size: $30.39 billion and $66.07 billion respectively
Sources: (1) “Table 8.1. Health Care and Social Assistance (NAICS 62)—Estimated Revenue for Employer Firms: 2002 Through 2010,” Service Annual Survey 2010, February 2012, page 151, available online here. (2) “Table 1 – Selected Services Estimated Quarterly Revenue for Employer Firms Fourth Quarter 2003 Through Fourth Quarter 2012,” Annual Benchmark Report for Services through 2012, a link to which is available on the U.S. Census Bureau’s website, here.
Original source: U.S. Department of Commerce, Bureau of the Census
Posted on November 13, 2013

Map Apps

According to IHS Automotive, one in four U.S. cars now comes with a navigation system. Globally, installations of dashboard navigation systems are estimated to reach 13.8 million by the end of 2013. Typically, automakers charge between $500 to more than $2,000 for these systems. Even standalone GPS systems tend to cost hundreds of dollars. In addition to high cost, these systems come preloaded with maps and are not connected to the internet, thereby making them more difficult to update. In some cases, a trip to the dealership is necessary.

In contrast, smartphone and tablet map apps are internet-connected, easy to update, often give real-time traffic information and in some cases can be downloaded for free. In 2012, 47% of car owners said that they used a smartphone map app while driving, up from 37% in 2011. Makers of dashboard navigation systems have taken notice. General Motors’ OnStar, Garmin, and TomTom all have created map apps of their own, ranging in price from $36 to $150. In some cases, these apps run both on mobile devices and on a car’s dashboard.

Today’s market size is the number of map app downloads in the U.S. in May 2013, an 11% increase from the total downloaded in May 2012.

Geographic reference: United States
Year: May 2013
Market size: 79.1 million
Source: Keith Naughton, “OnStar, Garmin Try to Keep Pace with Waze, Other Free Navigation Apps,” Bloomberg Businessweek, July 25, 2013, available online here.
Original source: ComScore
Posted on August 13, 2013

Plastic Surgery

Procedures that fall under the umbrella of plastic or cosmetic surgery include minimally intrusive procedures such as laser hair removal and injections of Botulinum toxin or collagen. They also include more extensive, often reconstructive procedures that are necessary to restore a person after an accident, animal bite, or surgery to remove a tumor, for example.

Today’s market size is the number of, and estimated total spent on, cosmetic surgical procedures performed in the United States in 2012. This includes all surgical procedures but does not include the minimally-intrusive procedures such as chemical peels, laser hair removal nor soft tissue filling procedures. In terms of spending, cosmetic surgeries make up 55.6% of the total spent on all cosmetic procedures and in terms of number of procedures, surgeries account for 10.9% of all procedures.

Geographic reference: United States
Year: 2012
Market size: 1,594,526 surgeries valued at $6.12 billion
Source: 2012 Plastic Surgery Statistics Report, “2012 Average Surgeon/Physician Fees,” American Society of Plastic Surgeons, 2013, page 20, available online here.
Posted on May 3, 2013

Face-Lift Market

Some people choose to undergo cosmetic surgery because of perceived economic benefits to being more attractive. Some simply feel that they will be happier if they are more attractive according to society’s standards of beauty. Today’s market size shows the amount Americans spent on face-lifts in 2010.

Geographic reference: United States
Year: 2010
Market Size: $845 million
Source: Abigail Tucker, “How Much is Being Attractive Worth?” Smithsonian, November 2012, page 18, also available online here.
Posted on January 4, 2013

Video Games

According to the Entertainment Software Association, 72 percent of households in the United States own a video game machine. Initially video games were targeted to males, but by 2010 48 percent of gamers were female. And, although nearly all children aged 12-17 play video or computer games, the average gamer is 37 years old. Nearly one-third of gamers are older than 50.

Data show the amount consumers spend on video games in the United States. To provide some perspective, in 2010, worldwide motion picture ticket sales totaled $31.0 billion. Figures for 2012 are projected.

Geographic reference: United States
Year: 2010 and 2012
Market Size: $25.1 billion and $70.0 billion
Source: Thomas L. McDonald, “Get in the Game,” The Catholic Times, October 1-7, 2011, page 6
Original Source: Entertainment Software Association
Posted on October 20, 2011

The Business of Weddings

Today’s market size is an estimate of the size of the entire wedding industry in the United States—we take some license in using the word “industry” here. The things included in measuring the size of the wedding industry are many, from planning, apparel and jewelry through the ceremony, flowers, food, reception and honeymoon.

Geographic reference: United States
Year: 2010
Market size: $47.2 billion
Source: Toon Van Beeck and George Van Horn, “Wedding Bells are Ringing,” The RMA Journal, December 2010-January 2011, page 22-27, available online here.
Original source: IBISWorld
Posted on October 5, 2011

Nonemployer Professional, Scientific and Technical Services

We recently posted the size of the professional, scientific and technical services market in the United States, here, and today we add detail to that market post by offering the size of a subset of the market. Today we show the revenue for all nonemployer firms in this service industry which represents 8.6% of the total revenue generated by professional, scientific and technical service providers in 2009. Most nonemployer firms are individual proprietorships but some are partnerships and even corporations. The point is, they have no paid employees. There were 21 million such firms in the United States in 2009, 18.7 million of them were individual proprietorships.

Geographic reference: United States
Year: 2009
Market size: $118.3 billion
Source: “2009 Nonemployer Statistics: Geographical Area Series: Nonemployer Statistics by Legal Form of Organization: 2009,” one of the many offerings on the Census Bureau’s American FactFinder platform, available here.
Original source: U.S. Census Bureau
Posted on September 13, 2011

Professional, Scientific and Technical Services

Professional Services

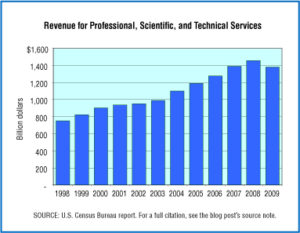
The sector of the U.S. economy that has been growing most strongly over the last decades is the Service Sector. The service sector includes all those who provide services instead of goods so, accountants, architects, computer programmers, consultants, doctors, hair stylists, lawyers, teachers and truckers to name but a few. The Census Bureau divides the Service Sector into eleven major categories and our market size today is one of those: Professional, Scientific and Technical Services, an industry whose revenues in 2009 represented 21.6% of all Service Industry revenues.

Over the period shown in the graph, 1998—2009, businesses providing professional, scientific and technical services saw their revenue grow by 85.3% which is 42.7% ahead of inflation.

Geographic reference: United States
Year: 1998 and 2009
Market size: $751.3 billion and $1,378.3 billion
Source: Services Annual Survey 2009, “Tables 1.1 Selected Service Industries – Estimated Revenue for Employer and Nonemployer Firms: 2005 through 2009,” and “Table 1.2 Selected Service Industries – Estimated Revenue for Employer Firms: 2005 through 2009,” pages 4 and 6, February 2011, available online here. Data in the graph are from earlier editions of this report series, links to which are available on a Census Bureau web page here.
Original source: U.S. Department of Commerce, Bureau of the Census

Time Banks

In the 1980s while at the London School of Economics and Political Science, Dr. Edgar S. Cahn, a civil rights lawyer and activist, conceived the time banking system, a modern-day bartering system. For each hour members provide services to other members, they are credited with one hour of time that they can then use to request services from other members. Cahn came back to the United States to implement his idea and time banks popped up all across the USA in inner city neighborhoods over the next decade.

Soon Japan took interest and by the mid-1990s interest was building in the United Kingdom. The first time bank in the United Kingdom was started in 1998. According to TimeBanking UK, there are currently hundreds of time banks—although in a modified version from what Cahn conceived—operating in Japan. In the United Kingdom there are 105 active time banks and 131 in development. Since then, time banking has become popular in many more countries.

The market size presented below represents the number of time banks in the United States that are members of TimeBanks USA (founded by Edgar S. Cahn) and the MI Alliance of Timebanks.

Geographic reference: United States
Year: 2011
Market size: 92
Source: “TimeBanks USA Member Directory,” TimeBanks USA, available online here; “TimeBanks throughout Michigan,” MI Alliance of Timebanks, available online here; “About > History,” TimeBanking UK, available online here; “About Time Banking UK,” TimeBanking UK, available online here; “‘TimeBanks’ Sprouting Up in Metro Detroit,” CBS Detroit, June 22, 2011, available online here.

Cosmetic Surgery

In China, even a small percentage of the population can be a very large number. This may explain how, according to the source, China is now the third largest national consumer of cosmetic surgery when calculated by the number of procedures performed annually. Today’s market size is the estimated value of cosmetic surgical procedures performed in China last year.

Geographic reference: China
Year: 2010
Market size: $2.3 billion
Source: LaFraniere, Sharon, “For Many Chinese, New Wealth and a Fresh Face,” The New York Times, April 24, 2011, page 6
Original source: Chinese Government estimates

e-Filing in the United States

Individual income tax returns were due for 2010 yesterday. A large number of these tax returns are now filed electronically. In 2010 e-filing accounted for 69.3% of all individual income tax forms filed for the tax year 2009. Today’s market size is the number of those returns filed as of December 31, 2010. The IRS expects this figure to rise for coming tax years. Of the returns filed electronically last year, 35.3% were filed by the filer him or herself and the remaining 64.7% were filed by a professional preparer.

Geographic reference: United States
Year: 2010
Market size: 98,740,000 individual tax returns for tax year 2009
Source: “2010 Filing Season Statistics,” an online report made available online by the
IRS here.
Original source: U.S. Internal Revenue Service

Sleep Clinics and Centers

Sleep for many is an illusive thing, making life very difficult and for some few the inability to sleep can be so complete that it leads to death. This fatal and extremely rare sleeping disease is called Fatal Familial Insomnia (IFF). Thankfully, for most people suffering from sleep disorders, there are a variety of remedies that may be tried to isolate the cause of the problem and then treat it. This is done, for the most troubled sleepers, in sleep clinics and centers. The market size listed below is an industry estimate of what those clinics and sleep centers will earn in 2011. Another interesting item related to sleep, in 2008, 56 million prescriptions for sleeping pills were written in the United States, representing a sharp increase over the preceding years.

Wishing you sweet dreams.

Geographic reference: United States
Year: 2011
Market size: $4.5 billion
Source: Max D. T., “The Secrets of Sleep,” National Geographic, May 2010, page 81.

Diagnostic Testing Laboratories

The market for all things medical appears to be on a steady rise in the United States and the services of diagnostic testing laboratories no exception. According to the source article, one of the hot trends in this industry is genetic-testing which is done by scanning the DNA of a “consumer” in order to check for any signs of irregularity that may be a pointer to potential and specific diseases or health conditions to which the consumer may be at higher risk than the general public. The government has begun to look at this industry more closely, as these tests can offer results that are contradictory or misleading.

Based on our earlier market size posts on the diagnostic laboratory industry, we assume that this market size includes both medical testing laboratories as well as diagnostic imaging services, which are listed in detail here.

Geographic reference: United States
Year: 2009
Market size: $60 billion
Source: Wall Street Journal, July 23, 2010, page B1.
Original source: Washington G-2 Reports

Fortune Telling Services

A desire to know the future, to be able to make decisions with a firmer idea of what is to come, is a desire one finds in most human communities. According to the Pew Forum on Religion and Public Life, 1 in 7 Americans consulted a psychic or fortuneteller in 2009. The market size presented below is the amount spent by Thais annually on visits to traditional fortune tellers.

Here’s hoping 2011 is a very good year!

Geographic reference: Thailand
Year: 2008
Market size: $63 million
Source: “When the Spirits Talk, As They Frequently Do, Thais Are Eager to Listen,” The New York Times, January 1, 2011, page A1.
Original source: Kasikorn Research Center in Bangkok.