Enzymes

enzymes in laundry detergent
Laundry detergent. Enzymes in laundry detergent allow clothes to be washed in cold water.
Geographic reference: World
Year: 2019 and 2027
Market size: $9.9 billion and $17.2 billion, respectively
Sources: “Enzymes Market Size, Share & Trends Analysis Report by Application (Industrial Enzymes, Specialty Enzymes), by Product (Carbohydrase, Proteases, Lipases), by Source, by Region, and Segment Forecasts, 2020 – 2027,” Grand View Research Report Summary, March 2020 available online here; “Enzymes Market Size Worth $17.2 Billion by 2027 | CAGR 7.1%: Grand View Research, Inc.,” CISION PR Newswire, March 16, 2020 available online here; Sindhu Raveendran, et. al., “Applications of Microbial Enzymes in Food Industry,” Food Technology & Biotechnology, March 2018 available online at the U.S. National Library of Medicine, National Institutes of Health here; JanMaarten van Dijl and Michael Hecker, “Bacillus Subtilis: From Soil Bacterium to Super-secreting Cell Factory,” Microbial Cell Factories, January 14, 2013 available online here; “A Global Fermentation Approach,” Leaf by Lesaffre available online here; “Specialty Enzymes Market Worth $6.6 Billion by 2025,” MarketsandMarkets Press Release, April 20, 2020 available online here.
Image source: habelfrank, “washing-powder-detergent-1500058,” PIxabay, July 7, 2016 available online here.

Enzymes are proteins that act as catalysts. Enzymes in the body run cellular processes and convert food to energy and to building blocks for proteins, lipids, nucleic acids, and some carbohydrates. Industrial enzymes such as proteases, amylases, lipases, and others are used in various applications: in the food and beverage industry, in detergents, animal feed, biofuels, textiles, pulp and paper, nutraceuticals, personal care products and cosmetics, wastewater treatment, and medications. In 2018, 60% of industrial enzymes on the market were proteases. In Europe, 900 tons of protease enzymes are used for detergents alone every year.

Today’s market size shows the global enzyme revenues for 2019 and projected for 2027. Microorganism-based enzymes comprised the vast majority of the industrial enzyme market in 2019, about 85%, followed by animal-based and plant-based enzymes. Microorganisms are preferred as a source due to their more predictable and controllable enzyme content. This type of enzyme can also be produced in a cost-effective manner with less space and time necessary than animal-based or plant-based enzymes. There are three types of microorganism-based enzymes: bacterial, fungal, and yeast. Bacterial enzymes are mostly sourced from Bacillus. They’re used in food and detergent and in pharmaceutical applications to diagnose diseases, promote wound healing, and kill disease-causing microorganisms. Fungal enzymes are used in the preparation and production of soy sauce, beer, baked goods, processed fruits, and dairy products. Yeast is used in beer, baked goods, and industrial ethanol production.

Increased investment in biotechnology research for the development of specialty enzymes for medicinal and diagnostic purposes is one of the main factors driving product demand globally. Increasing demand from the food and beverage, biofuel, animal feed, and home cleaning sectors along with the growing consumption of functional foods will contribute to the growth in the market through 2027. By region, growing biofuel production in North America and Europe, as well as increasing meat production in Europe and the Russian Federation, are expected to contribute to growth in these regions. Enzymes are used extensively in meat processing to improve the tenderness of the meat. Europe was third behind China and North America in meat production in 2018. The top three companies in this industry—Novozymes, DuPont Danisco, and DSM— claimed more than 75% of the market in 2019.1 Other major companies in this industry include BASF SE, Associated British Foods PLC, Chr. Hansen Holding A/S, and Advanced Enzyme Technologies.

1 Source: Grand View Research. The press release from CISION PR Newswire mentioning the same Grand View Research report states that the top 3 companies are Novozymes, DuPont Danisco, and BASF SE.

Paper Manufacturing

The production of paper of all types in the United States fell, as did most production activity, during the recession of 2007–2009 but regained most of the losses by 2011. The industry also adjusted to lower demand by increasing exports and reducing imports, a pattern seen in many industries over the past six years. Between 2007 and 2011 paper production fell and then regained all but 0.1% of its 2007 total while paper exports rose 26.2% and exports fell by 7.2%.

Today’s market size is the value of U.S. paper manufacturer shipments in 2007 and 2011.

Geographic reference: United States
Year: 2007 and 2011
Market size: $176.12 billion and $175.88 billion respectively
Source: “General Statistics: Statistics for Industry Groups and Industries: 2011 and 2010,” Annual Survey of Manufactures, available on the Census Bureau’s American FactFinder website here. Data for NAICS 322-Paper Manufacturing from U.S. International Trade Statistics, database also produced and made available online by the Census Bureau, here.
Original source: U.S. Department of Commerce, Bureau of the Census
Posted on April 16, 2014

Newsprint

Newsprint

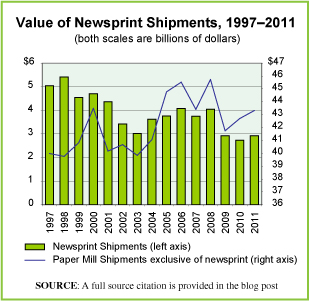
Newsprint is a grade of paper used primarily for printing newspapers, advertising inserts and advertising mailers. It comes not in sheets but in huge, long rolls for use in web offset, letterpress, and flexographic printers. As the digitizing of information has advanced, it will come as no surprise to see that the demand for newsprint has been on the decline. We made a graph to show how the value of newsprint shipments by the paper industry have fared over the last fifteen years in the United States. The newsprint industry is designated as NAICS 322122 by the U.S. Census Bureau.

Since the majority of newsprint is used in the production of newspapers, the decline of the newspaper industry is mirrored in the decline of newsprint production. Among the factors causing a decline in the newspaper industry are a declining readership, particularly that of young adults, the rise of digital editions for which paid subscriptions are far less, and the decline in advertising revenue that has resulted as advertisers’ budgets are being split among a growing number of media outlets, many online. For figures on the newspaper industry, check our earlier posts on that market, here.

Today’s market size is the value of U.S. newsprint shipments at the wholesale level in 1998 (a peak year for shipments) and 2011. Worth noting is the fact that declines in newsprint have exceeded declines in newspaper circulation during this period—46% decline in newsprint shipments versus 21% decline for daily newspaper circulation—suggesting that the papers that are in circulation are not only fewer than before, but have fewer pages as well.

Geographic reference: United States
Year: 1998 and 2011
Market size: $5.42 billion and $2.92 billion respectively
Source: “Value of Shipments for Product Classes,” Annual Survey of Manufactures, editions: 2001, 2005, 2008 and 2011. This series of reports is produced by the U.S. Bureau of the Census in all non Economic Census years. The reports are available online through the Census Bureau’s American FactFinder system, here. Newspaper circulation data are from “Newspaper Circulation Volume,” Newspaper Association of America, September 4, 2012, available online here.
Original source: First Research and the U.S. Bureau of the Census
Posted on September 12, 2013

Paper Consumption

While the use of paper and paper products has not declined significantly—despite much talk in the 1990s of a coming paperless society—the publishing industry is using less paper. According to a new industry report, paper consumption by the book industry declined by 34% from 2006 to 2010, due in part to the great recession and in part to increasing sales of e-books. This information comes from a report whose primary purpose was to track the book publishing industry’s overall environmental impact on the world. Another item highlighted in the report is the increasing quantity of recycled material in the paper that is used by the industry. According to the report, the use of recycled fiber by the book publishing industry rose from 5% of all fiber in 2004 to 24% in 2010.

By way of placing this information in the context of the larger paper industry, it is worth noting that during the period covered in the Book Industry Environmental Trends report, the total value of product shipments made by U.S. Paper and Newsprint Mills dropped by 6.2%, from $45.5 billion in 2006 to $42.7 billion in 2010. In 2006, newsprint represented 7% of the value of all paper mill product shipments and by 2010 that percentage had fallen to 3.6%. But, a discussion of newsprint takes us into a complex niche within the paper market, one we will cover in another post one day soon.

Today’s market size is the volume of paper consumed by the U.S. book industry in 2006 and 2010.

Geographic reference: United States
Year: 2006 and 2010
Market size: 1.76 million tons and 1.16 million tons respectively
Source: Jim Milliot, “Keeping the Green in Publishing,” Publishers Weekly, July 22, 2013, pages 5-6, available online here. The rate of decline in value of output by U.S. Paper and Newsprint Mills was calculated from figures published by the U.S. Census Bureau in its Annual Survey of Manufacturers, (ASM) series of reports, “Value of Product Shipments,” and specifically, data reported under NAICS codes 322121 and 322122. The ASM data are available online here.
Original source: Book Industry Environmental Trends and U.S. Census Bureau
Posted on September 10, 2013

Newspapers

Newspapers

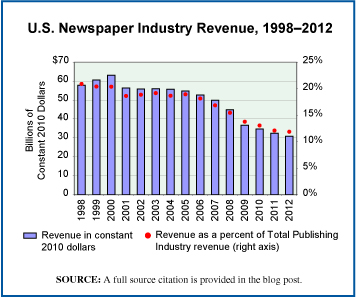
The news this week about The Washington Post being purchased for $250 million by Amazon founder Jeff Bezos made us want to update an earlier post about the newspaper industry, here. And so, we present today’s market size post, including a chart that shows U.S. newspaper industry revenues, annually, since 1998. Clearly, an industry going through significant change.

Geographic reference: United States
Year: 2000 and 2012
Market size: $50.29 billion and $32.04 billion respectively
Source: “Table 3.0.1 Information Sector Services (NAICS 51) — Estimated Revenue for Employer Firms: 1998 Through 2004,” Service Annual Survey, April 2006, page 24, available online here, and annual updates of the same which are available on the Census Bureau’s site here.
Original source: U.S. Census Bureau
Posted on August 9, 2013

Woody Biomass

As fuel prices rise, demand for alternative energy sources naturally grows. One such alternative energy for those burning fossil fuels in an industrial application is to burn woody biomass instead. Not surprisingly, pulp and paper manufacturers—many of whom are vertically integrated and thus own their primary input material, wood—around the world are using more woody biomass to fuel their own industrial applications.

Today’s market size is the volume of woody biomass—bark, sawdust, wood chips, forest residues and the like—used by the pulp and paper industry globally in 2009.

Geographic reference: World
Year: 2009
Market size: 1,400 trillion British Thermal Units which is roughly equal to 75 million oven dried metric tons.
Source: “Biomass Market Update – 4Q/2009,” Wood Resource Quarterly – 4Q/2009, page 10, available online here.
Original source: Wood Resources International
Posted on October 3, 2011

Disposable Diapers

Any parent with a small child knows that diapers are big business. The use of disposable diapers is highest in industrialized countries and together these countries account for most of this market, the U.S. alone accounting for nearly 20% of the global market according to the source. Today’s market size is an estimate of the size of the global diaper market in 2005 and 2010. The estimated size for 2010 is based on a forecast for that year made in advance. More recent estimates suggest that the global market surpassed $30 billion in 2010

Geographic reference: World
Year: 2005 and 2010
Market size: $22.2 and $26.6 billion respectively
Source: “Stratagist,” a report published in May 2009 by Feed-back.com, Market Analysis With Context and Perspective, available online here.
Original source: Euromonitor International and Global Industry Analysts

Sodium Sulfate

Sodium sulfate is an inorganic chemical that looks like a white powder. Its chemical symbol is NA2 SO4. Sodium sulfate is used in the production of many products. Soaps and detergents account for the largest single share (35%) of its consumption. Other end uses of sodium sulfate include glass manufacturing which accounts for 18% of consumption, the paper and pulp industry uses 15%, and textile production accounts for 4% of consumption in the United States. The remaining 28% of consumption is divided among many smaller consuming end users.

The market size presented below is the estimated total value of all natural and synthetic sodium sulfate sold in 2010.

Geographic reference: United States
Year: 2010
Market size: $42 Million
Source: “Sodium Sulfate Statistics Information,” part of an annual series titled Mineral Commodities Summaries, published by the U.S. Geographical Survey and available online here.
Original source: U.S. Department of the Interior, USGS

Book Wholesalers

The distribution network through which books get from the publisher to the reader is one that has been going through enormous change over the last few decades. First, the big box bookstores moved into a space previously occupied by smaller retailers. Then, Amazon got into the business and started serving as both a wholesaler and a retailer, but one without a store front, operating entirely online. Since then, the rise of the electronic book, or e-book, has further altered the way that books make their way to the reader. The landscape for book distribution seems to be in a state of constant change these days, much as the music industry experienced a decade ago. The figures that follow are for the industry designated by the NAICS code 42-4920: Book, Periodical, and Newspaper Merchant Wholesalers.

Geographic reference: United States
Years: 1997, 2002 and 2007
Market size: Number of Establishments: 3,257; 3,464 and 2,789 respectively.
Market size: Sales: $33.63; $30.90 and $28.32 billion respectively.
Market size: Employment: 89,309; 76,072 and 63,511 respectively.
Source: “Sector 42: EC0742I2: Wholesale Trade: Industry Series: Preliminary Comparative Statistics for the United States (2002 NAICS Basis): 2007 and 2002,” 2007 Economic Census, available online here. The data from 1997 are from the 1997 Economic Census.
Original source: U.S. Department of Commerce, Bureau of the Census.

Retail Arts & Crafts Supplies Market

This market is very decentralized, the top three retailers accounting for only 16% of the market. Those leading retailers are Michaels Stores, Jo-Ann Fabrics, and A.C. Moore.

Geographic reference: United States
Year: 2008
Market size: $31 billion
Source: “Deutsche Bank High Yield & Leveraged Finance Conference,” October 1, 2009
Original source: CHA, equity research and public filings