Methanol

methanol fuel
Methanol is a toxic, colorless, flammable liquid. It used to be called wood alcohol because it’s a byproduct of the destructive distillation of wood, a process by which wood is heated to a high temperature in the absence of oxygen in order to extract various chemicals. Now it’s made using natural gas in a catalytic industrial process. Methanol can also be made from coal, biomass, landfill gas and power plant or industrial emissions. Methanol has been one of the most widely used industrial chemicals since the 1800s.

Today’s market size shows methanol revenues for 2018, 2020 and 2027.1 Data for 2027 is projected. According to the Methanol Institute, global demand for methanol increased at a compound annual growth rate of 5.9% from 2014 to 2019. Production takes place on 5 continents and in the Middle East. There are 90 plants with a combined production capacity of 110 million metric tons worldwide. Forty percent of the methanol consumed is used for emerging energy applications and about 33% is used in the production of formaldehyde. Formaldehyde is used in the production of resins, glues and various plastics. It’s also used to produce acetic acid which is used in the production of polyester fibers and PET plastics. The newest and growing use for methanol is in the production of light olefins ethylene and propylene. Ethylene is used in the production of packaging and nonpackaging film, PET plastics, PVC and polystyrene. Propylene is used as an alternative to propane and as a fuel gas in the chemical and plastics industries. Most methanol to light olefin production is done in China.

Emerging energy applications for methanol include automobile fuel, marine fuel, DME, biodiesel, fuel cells, electricity and boilers and cookstoves.2 China leads the world in using methanol as an automotive fuel. Currently, a majority of passenger cars in China are fueled by M15, a blend of 85% gasoline and 15% methanol. Since 2012 China has been participating in a pilot program to study the efficacy of using 100% methanol. In the last few years, 470,000 buses, trucks and taxis have been converted to run on either 100% methanol (M100) or a blend of 85% methanol and 15% gasoline (M85). In March 2019, China issued a policy paper encouraging the broad adoption of M100 as a vehicle fuel. Australia, Egypt, Iceland, and Israel also have programs testing the viability of using methanol as a transportation fuel. The United States researched using methanol as fuel in the 1980s and 1990s. Ford, GM, and Chrysler produced methanol-fueled versions of popular car models and sold them at the same price as gasoline-powered models. By 1997 there were 15,000 methanol-fueled vehicles on the road with 100 fueling stations in California alone. But, once the price of gasoline dropped below the price of methanol, the automakers stopped producing methanol-fueled vehicles. Despite this, with more than 200 million miles driven, methanol-fueled vehicles proved to be a viable alternative to gasoline-powered vehicles.

Why methanol? Renewable methanol, made from agricultural waste, forestry residues, municipal solid waste, and carbon dioxide from industrial exhaust, lowers carbon emissions by 65-95% when compared to fossil fuels. According to the Danish Department of Energy, carbon dioxide emissions from methanol on a well-to-wheel basis are the lowest of all alternative fuels, including battery-electric. Carbon dioxide emissions totaled 176g/km for gasoline engines, 178g/km for hydrogen, 142g/km for hybrid engines, 132g/km for diesel, 98g/km for battery-electric, and 83g/km for methanol. Renewable methanol fuel also has lower emissions of nitrogen oxides and volatile organic compounds and contains no benzene, toluene, ethylbenzene, and xylene. These last four cancer-causing chemicals in gasoline emissions do not biodegrade easily and can contaminate groundwater. And, while methanol emissions do contain toxic formaldehyde, if a heated catalytic converter is used, the levels meet or exceed California’s strict Ultra Low Emission Vehicle emission targets. With ground transportation accounting for close to 73% of all transportation greenhouse gas emissions in Europe alone in 2015, widespread adoption of methanol-fueled vehicles can have a dramatic effect on lowering carbon emissions and reducing the effects of climate change.

In 2019, three regions of the world accounted for approximately 75% of methanol consumption globally. More than half of global consumption was in China, followed by Eastern Europe and the United States. The industry is fragmented with the top 10 companies having less than 30% of global capacity. The leading producer of methanol is Methanex. Other top companies include SABIC, Celanese Corp., Eastman Chemical Co., BASF SE, and Atlantic Methanol among others. Methanex, SABIC, QAFAC, and GPIC produce low carbon methanol. BASF, BioMCN, Enerkem, New Fuel, and Nordic Green produce bio-methanol. Renewable methanol is produced by Carbon Recycling International and Innogy. More than 30 companies are involved in the research and development of low carbon methanol, bio-methanol, and renewable methanol.

1 Source for 2018 and 2027 data: “The Global Methanol Market to Garner $56,151 Million by 2027,” AB Newswire Press Release, March 17, 2020 available online here. Source for 2020 data: “Global Methanol Market 2020 : Industry Outlook, Top Countries Data, Comprehensive Insights, Growth and Forecast 2026,” MarketWatch Press Release, February 5, 2020 available online here.
2 DME stands for dimethyl ether. It’s used as a replacement for propane in liquid petroleum gas and can be used as a replacement for diesel fuel in transportation.

Geographic reference: World
Year: 2018, 2020 and 2027
Market size: $34.5 billion, $36.85 billion and $56.2 billion, respectively
Sources: “The Global Methanol Market to Garner $56,151 Million by 2027,” AB Newswire Press Release, March 17, 2020 available online here; “Global Methanol Market 2020 : Industry Outlook, Top Countries Data, Comprehensive Insights, Growth and Forecast 2026,” MarketWatch Press Release, February 5, 2020 available online here; “Energy,” Methanol Institute available online here; “The Methanol Industry,” Methanol Institute available online here; Tammy Klein, Methanol: A Future-Proof Fuel, Methanol Institute, February 2020 available online here; “The Chemical,” Methanol Institute available online here; “Methanol,” Chemical Economics Handbook, December 2019, IHS Markit press release available online here; Renewable Methanol Report, ATA Markets Intelligence S.L. on behalf of the Methanol Institute, December 2018 available online here; “Methanol Fuel in the Environment,” Methanol Fuels available online here; “Ethylene Uses and Market Data,” Independent Commodity Intelligence Services, December 9, 2010 available online here; “Methanol Market Size, Share, Demand, Trends, Industry Analysis, Statistics Worldwide 2026 | BASF SE, SABIC, Eastman,” MarketWatch Press Release, March 5, 2020 available online here; “Propylene,” Industrial Gases available online here.
Image source: Paul Brennan, “pumping-gas-fuel-pump-industry-gas-1631634,” Pixabay, August 31, 2016 available online here.

Alternative-Fuel Vehicles

When one thinks of alternative fuels for vehicles, one might think of diesel, ethanol, or even compressed natural gas, but recently vehicles running on propane have entered the market. According to Todd Mouw, vice president of sales and marketing for Roush CleanTech, a manufacturer of engines that run on propane, propane is “… cleaner than gasoline and diesel. We have a lot of it (in the U.S.) and … it’s easy to integrate into a Ford truck or school bus.” In fact, all three major school bus manufacturers in the United States offer propane-powered school buses to school districts.

Today’s market size is the number of propane-powered vehicles on the road. In comparison, we also include the number of vehicles on the road powered by compressed natural gas.

Geographic reference: United States
Year: 2016
Market size: More than 143,000 propane-powered vehicles
Market size: Approximately 153,000 compressed natural gas powered vehicles
Source: Snavely, Brent, “Alternative-Fuel Buses Carry Roush,” Lansing State Journal, January 8, 2017, page 18A
Original source: Roush CleanTech and Natural Gas Vehicles for America

Silica Sand for Hydraulic Fracturing

Sand

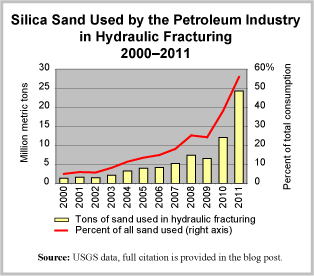
Yesterday’s post on the size of the world market for silica sand got us to thinking. So, we dug around in the U.S. Geological Survey’s Minerals Yearbook, to see if we could clearly see any trends in the use of silica sand in the United States. What we found was clear indeed and we present it here in a graph.

Overall, silica sand consumption has increased 62% from 2000 to 2011. The use of silica sand by the petroleum industry, for hydraulic fracturing, has grown 1,674%. The use of silica sand in oil and gas fracking operations was a relatively steady 5% of the overall demand for decades and began to rise in the mid-2000s. By 2011, it reached 56% of total demand for silica sand in the United States. Final data on 2012 are not yet available but all signs show that the trend seen in the graph has continued apace.

Today’s market size is the value of silica sand used in oil and gas hydraulic fracturing operations in the United States in 2001 and in 2011.

Geographic reference: United States
Year: 2001 and 2011
Market size: $47.5 million and $1.33 billion respectively
Source: Thomas P. Dolley, “Silica [Advanced Release]” Tables 1 and 6, 2011 Minerals Yearbook, March 2013, pages 66.1-66.10, USGS, available in PDF format here. Data from Tables 1 and 6 of the Silica chapter of each annual Minerals Yearbook from 2000 through 2010 were used and may be accessed at the USGS web site here.
Original source: U.S. Department of the Interior, U.S. Geological Survey (USGS)
Posted on January 31, 2014

Silica Sand

Sand is made up, primarily, of very small quartz (silicon dioxide, or SiO2) crystals. Quartz is one of the most common minerals found on the Earth’s surface, so it is both an easily found mineral and one we use in many, many ways. Sand is used in water filtration, in glass manufacturing, in industrial casting, as an abrasive in many applications, in producing concrete, in adding texture to slick roads, and as a filler in children’s sand boxes. Silica sand, however, has a higher price than the sand usually used to help on deicing roads and making concrete. This is because it is a purer sand, having the composition and grain-size distribution required for industrial applications. Silica sand has well-rounded, consistently sized granules of almost pure quartz grains.

The demand for silica sand has been rising steadily for years now. Globalization—if you will forgive such a sweeping generalization—is one of the main reasons, as is the increased demand worldwide for glass (think HD TVs, tablets and cell phones), and the significant increase in the use of hydraulic fracturing in the oil and gas industry. The hydraulic fracturing process for oil and gas extraction takes a mixture of silica sand (often called frac sand), water and chemicals and injects this mixture into a well under very high pressures. Small cracks form in the bedrock and the sand in the mixture helps to prop open these tiny fissures. From the fissures, conduits form that increase the flow of fluids and gas within the well.

Today’s market size is the value of silica sand sold worldwide in 2011 and a forecast for its value in 2016.

Geographic reference: Worldwide
Year: 2011 and a forecast for 2016
Market size: $6 billion and $9.2 billion respectively
Sources: (1) World Industrial Silica Sand, a brochure to promote an industrial study produced by The Freedonia Group and published in October 2012. The brochure is available online here. (2) “Industrial Silica Sand FAQs,” Minnesota Department of Natural Resources, last updated on October 31, 2012 and available here.
Posted on January 29, 2014

Oil Drilling Rigs

OilRigs

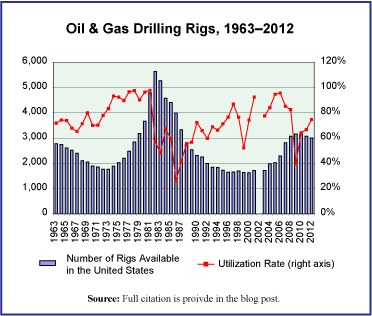
The rising demand for oil on the global scale has been an engine of growth for more than a decade for the oil and gas drilling equipment industry. Since 2005, in the United States alone, 1,538 newly constructed oil drilling rigs were brought into the market valued at approximately $53 billion. We offer a graphic that shows the number of rigs available in the U.S. market annually and the percent of utilization of those rigs for a fifty year period.

Today’s market size is the number of oil drilling rigs available to the market in 2012, of which 94% are land-based drills and 6% are drills for use in offshore applications.

Geographic reference: United States
Year: 2012
Market size: 3,006 oil drilling rigs
Source: “U.S. Rig Census Historical Data, 1955-2012,” National Oilwell VARCO Downhole’s 59th Annual Rig Census, November 2012, page 10, available online here.
Original source: IHS Drilling Data, RigData, ODS-Petrodata, and WorldOil.com
Posted on October 16, 2013

Petroleum Product Imports from Egypt

Petroleum from Egypt

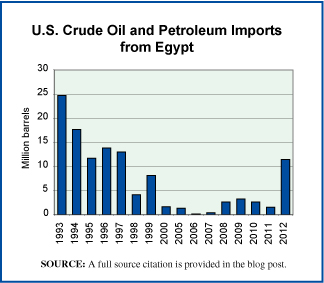
The graph to the right shows crude oil and petroleum product imports to the United States from Egypt, from 1993 through 2012. The trade in petroleum products is one that is strongly influenced by geopolitical concerns. The rise in imports from Egypt into the United States in 2012 may well be seen, at least in part, as an attempt by the United States to help stabilize that country after its revolution of 2011.

Egypt’s domestic consumption of its fuel has been rising steadily for decades as its population increased rapidly. Consequently, its exports of petroleum products (from crude oil to fuel ethanol) declined. However, when one of its major industries, tourism, was devastated by the upheavals of 2011 and continued political unrest in wake of the revolution, Egypt has been forced to increase exports in other areas as much as possible in order to meet its foreign currency debt payment obligations.

Today’s market size is the number of barrels of crude oil and petroleum products imported by the United States from Egypt, in 2012.

Geographic reference: United States and Egypt
Year: 2012
Market size: 11.44 million barrels, or 0.29% of all such imports into the United States that year.
Source: “U.S. Imports by Country of Origin,” a detailed statistical presentation on “Petroleum & Other Liquids,” dated March 15, 2013, published by the U.S. Energy Information Administration. The table is available online here.
Original source: U.S. Energy Information Administration
Posted on April 18, 2013

Fossil Fuel Subsidies

Since the turn of the century the price of crude oil has risen sharply, the result of increasing demand for a commodity whose supply cannot increase quickly enough to meet demand. The dynamics of the petroleum market are becoming more clearly those of a market for something with a finite supply. This may seem obvious since petroleum in the form of crude oil is a finite product but for the 130 years before 2000, oil markets did not follow this pattern. The oil market was more elastic, reacting more quickly to rising and falling demand. This is because during that first 130 years of the oil age, the more easily and inexpensively accessible oil was being extracted, making the market function more like that of a commodity with nearly endless supply. As we have entered a period in which global oil production has plateaued, despite rising demand, prices have risen sharply and they are likely to continue to rise as growing demand outpaces supply.

Today’s market size looks at the amount spent globally on fossil fuel consumption subsidies. These are defined by the International Energy Agency (IEA) as “any government action directed primarily at the energy sector that lowers the price paid by energy consumers.” According to the IEA, changes in international fuel prices are chiefly responsible for differences in subsidy costs from year to year. The 30% year-over-year increase in the amount spent on fossil fuel consumption subsidies in 2011 closely tracked the sharp rise in international fuel prices.

Geographic reference: World
Year: 2011
Market size: $523 billion
Source: John Parnell, “IEA: Fossil Fuel Subsidies Increased 30% in 2011,” Climate Home, December 11, 2012, available online here.
Original source: International Energy Agency (IEA)
Posted on January 17, 2013

Helium, Grade-A

Helium production and consumption

For those not involved in one of the industries in which helium is an input, the term may conjure images of party balloons. But, helium is used in a variety of industrial applications. In the United States its end users break down in the following categories: 32% for cryogenic applications; 18% for pressurizing and purging applications; 13% is used for welding; 18% for controlled atmospheres; 4% for leak detection; 2% for breathing mixtures and the remaining 13% for other applications, like party balloons.

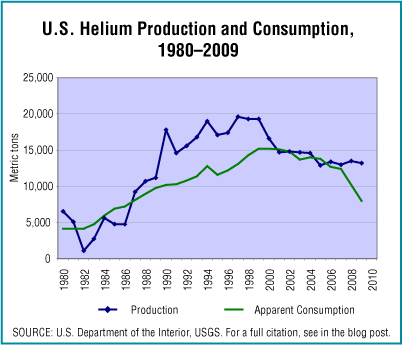
Today’s market size is the estimated value of domestically extracted grade-A helium in 2010. The graphic shows production and apparent consumption figures for a period of 30 years, from 1980 to 2010. Apparent consumption is a calculated figure based on production, plus imports, less exports plus or minus change in stock.

Geographic reference: United States
Year: 2010
Market size: $730 million
Source: “Helium Statistics and Information,” part of a series of reports on different minerals and commodities produced by the U.S. Geological Survey and available online here.
Original source: U.S. Department of the Interior, U.S. Geological Survey (USGS)

Minerals in Wyoming

Taxable value of WY minerals

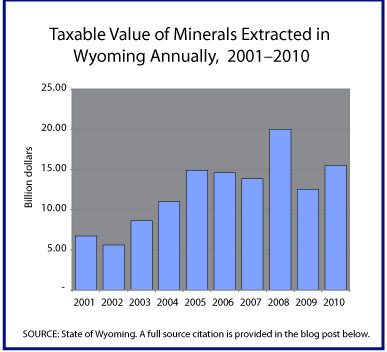
Mining and extraction industries in Wyoming saw a significant decline in 2009 after peaking in 2008 for the decade but 2010 saw a strong recovery over 2009. The graph shows taxable value for all minerals extracted annually in Wyoming from 2001 through 2010. Wyoming’s mineral wealth is providing the state with a strong base for recovery from the recession that began in December 2007.

Today’s market size is the total value of all minerals extracted in 2010. The minerals included in this total are oil, natural gas, coal, bentonite, trona, uranium, sand and gravel.

Geographic reference: United States
Year: 2001 and 2010
Market size: $6.74 and $15.49 billion respectively
Source: Barron, Joan, “State’s Mineral Valuation Booms,” Casper Star Tribune, June 1, 2011, page 1.
Original source: State of Wyoming

Peat

Peat poruction and consumption

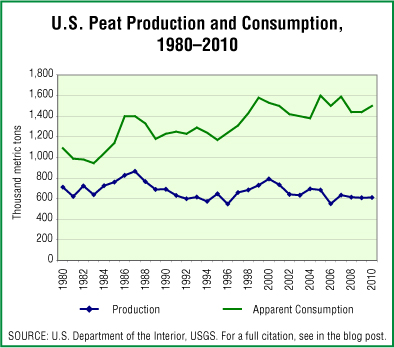
Peat is a natural and renewable organic material that is grown in shallow wetlands, primarily in the Northern Hemisphere. It is used widely as a plant-growth medium because of its unusual ability to both retain water and promote drainage. Peat also has industrial uses as a filtration medium to remove toxins in water processing and as an effective absorbent used in the clean-up of fuel and oil spills.

Today’s market size is the estimated f.o.b. plant value of marketable peat from plants in the United States. The graphic provides a look at peat production and consumption over a thirty year period, from 1980 to 2010.

Geographic reference: United States
Year: 2010
Market size: $16 million
Source: “Peat, Statistics and Information,” Mineral Industry Survey, a series of reports produced by the U.S.Geological Survey, made available online and last updated on May 19, 2011. Here is a link to the USGS site.
Original source: U.S. Department of the Interior, USGS

Crude Oil Supply

Based on a report recently issued by the U.S. Energy Information Administration, the supply of crude oil for U.S. energy needs, from all sources, is anticipated to decline between 2009 and 2025. On a per capita basis this decline is rather large, 15.3%. This is because the population is projected to increase by 16.4% between 2009 and 2025 while the supply of crude oil is forecast to decline by 1.39%. Obviously, new sources of petroleum supply will be (are) in high demand, not to mention all other forms of energy.

Today’s market size is the daily supply in millions of barrels per day (mbpd) of crude oil in the United States, for 2009 and projected for 2025.

Geographic reference: United States
Year: 2009 and 2025
Market size: In 2009, 14.33 mbpd and in 2025, 14.13 mbpd
Source: “Table C4. Liquid Fuel Supply and Disposition,” Annual Energy Outlook 2011, With Projections to 2035, April 2011, page 175, available online here.
Original source: U.S. Department of Energy, Energy Information Administration

Petroleum Products

This market size covers petroleum product production and is based on wholesale prices. It can be broken into five product categories, each listed here with its respective share of the market as a percentage, in parentheses: gasoline (51.23%); light fuel oils (32.97%); jet fuel (11.20%); heavy fuel oils (4.14%); and kerosene, excluding jet fuel (0.46%).

Geographic reference: United States
Year: 2008
Market size: $678.1 billion
Source: Annual Survey of Manufactures, 2008, March 30, 2010 available online here.
Original source: U.S. Bureau of the Census

White Oil Market

White oil is a highly refined product used in the production of medical products, consumer products, cosmetics and food products. Calumet and Sonneborn are two leading companies in the production of white oil.

Geographic reference: United States
Year: 2009
Market size: $450 million
Source: Houston Chronicle, October 23, 2009, page 1
Original source: Petroleum Trends International

Wax Market

Market size is based on projections. Petroleum waxes dominate the market representing nearly half (47.4%). Synthetic waxes make up 44.9% of the market and natural waxes the remaining 7.7%.

Geographic reference: United States
Year: 2008
Market size: $2.47 billion
Source: Rubber World, June 2009, page 10
Original source: Freedonia Group

Market for Chemicals Used in Oil Drilling

Many specially designed chemicals are used in drilling for and extracting oil. These include what are called stimulation chemicals (35%), drilling fluids (34%), production chemicals (12%) and all others (19%).

Geographic reference: United States
Year: 2008
Market size: $8.6 billion
Source: Oilfield Chemicals, September 2009 available online here.
Original source: Freedonia Group