Vinyl Records

vinyl records
While in-store celebrations of Record Store Day have been postponed due to the coronavirus pandemic, RSD Drops, special titles coming to participating indie record stores, will take place on June 12 and July 17 of 2021.
Geographic reference: United States
Year: 2006, 2013, and 2020
Market size: $15.7 million, $210.7 million, and $619.6 million, respectively

For much of the 20th century, vinyl records dominated the recorded music industry. The first commercially-available long-playing vinyl record was introduced by RCA Victor in 1930. Even when other forms of recorded music were available in the 1970s, vinyl still held a majority of the market. In 1975, LP/EP sales accounted for 62.2% of sales, with vinyl singles garnering another 8.9% of the market. In the 1980s, as cassette tapes became more popular and compact discs (CDs) were introduced, sales of vinyl records plummeted from 71.1% of sales in 1980 to 8.8% of sales in 1989. 

Cassette tapes, introduced in the 1960s, offered music aficionados portability and durability. Consumers could record their favorite music from the radio to create on-the-go playlists and custom mixtapes. In 1983, the first CD players were sold in the United States. Initially few albums were released on the format and players retailed for $1,000; however, by 1988 CDs were so popular they outsold vinyl albums. CDs would go on to outsell cassette tapes in 1991.

Vinyl records did not completely disappear. In 1993, vinyl record sales totaled 300,000 units, or 1.6% of total recorded music sales volume and 0.1% of revenue. For much of the 1990s and early-to-mid 2000s, vinyl sales hovered around 1 million units, with peak sales of 1.5 million units sold in 2000. By 2005, CD sales in two major retail outlets were eclipsed by iTunes downloads as consumers found it more convenient and accessible to download music to their very small and portable iPods, some versions of which could store 2,000 or more songs. As popular as digital downloads were, streaming service revenue outpaced its sales by 2015. By 2018 many major retailers such as Best Buy and Target were discontinuing sales of CDs, but CDs still maintained a presence in 2020, selling 31.6 million units.

Meanwhile starting in 2006, vinyl record sales were increasing in popularity, especially among Millennials. Sales soared from 900,000 units in 2006 to 22.9 million units in 2020. Had it not been for a shortage of vinyl in 2020, sales may have gone higher. By 2020, vinyl record sales reached 5.1% of the $12.2 billion recorded music market (6.4% by volume), up from 0.1% in both revenue and volume in 2006.

What were the most popular vinyl LPs of the last decade? Abbey Road by the Beatles was number one, with 558,000 units sold between 2010 and 2019. Others in the top 8 include Dark Side of the Moon by Pink Floyd (376,000 units), Guardians of the Galaxy soundtrack (367,000), Legend by Bob Marley and the Wailers (364,000), Back to Black by Amy Winehouse (351,000), Thriller by Michael Jackson (334,000), Sgt. Pepper’s Lonely Hearts Club Band by the Beatles (313,000), and Rumours by Fleetwood Mac (304,000). For the first half of 2020, the top selling vinyl album was When We All Fall Asleep, Where Do We Go? by Billie Eilish.

Note: All sales figures are for new vinyl records.

Sources: “U.S. Sales Database,” The Recording Industry Association of America, 2021 available online here; Dillon Wallace, “When Did CDs Take a Front Seat to the Cassette Tape,” Aperture available online here; Aldo Svaldi, “Victrola Has Moved HQ to Denver,” Denver Post, March 18, 2021, pp. A9 and A11; “LP/Vinyl Album Sales in the United States from 1993 to 2019,” Statista, January 8, 2021 available online here; Joshua P. Friedlander, “Year-End 2020 RIAA Revenue Statistics,” February 2021 available online here; The Vintage Record, “The History of Vinyl,” American History Now, January 27, 2014 available online here; DJ Rob, “The Skinny (Or Maybe the Fat) on Vinyl in 2020 — and the Ten Best Selling Vinyl Records of 2020 So Far…” DJRobblog.com, July 11, 2020 available online here; Paul Riismandel, “More New CDs Than Vinyl Records Were Sold in 2020, Yet Again,” Radio Survivor, March 4, 2021 available online here; Felix Richter, “Classics Dominate LP Sales in the U.S.,” Statista, August 27, 2020 available online here; Felix Richter, “The Vinyl Comeback Continues,” Statista, January 15, 2021 available online here; Felix Richter, “From Tape Deck to Tidal: 30 Years of US Music Sales,” The Wire, March 7, 2021 available online here.
Image source: AliceKeyStudio, “turntable-vinyl-sound-music-1208177,” Pixabay, February 19, 2016 available online here.

Independent Record Labels

record label

What do Adele, Radiohead, and Tobacco have in common? They all have signed with independent record labels sometime in their careers.

According to the Association of Independent Music, an independent record label is one in which 50% or less of the company is owned by a major record company, its affiliates, or its subsidiaries. The three major record companies are Universal Music Group, Sony Music Group, and Warner Music Group. Even if an independent record label is not owned by one of the majors, in some cases it may not be totally independent of them. Some independents partner with major record labels to boost promising artists and distribute the music they produce. In 2017, 22.4%1 of the music produced by independent record labels were distributed by major record labels.

In the United States, independents’ share of music sales, licensing and other revenues totaled 32.2% in 2017. Independent publishers’ market share was higher, 41.2%. Globally, independents’ share of the music recording industry reached 39.9%, with some countries’ shares outpacing major labels. Independent record labels in South Korea garnered 83% of the market in 2017 and in Japan, 63%.

The industry is fragmented. There are more than 500 independent record labels in the United States alone, representing every genre of music. Well-known artists, as well as lesser-known musicians, have signed with independent labels throughout the years. Many artists generally get their start at independent labels and a majority stay. Globally, 77% of artists renewed with their label in 2017. In the United States, 84% did.

Today’s market size shows the total independent record label revenues for 2017 worldwide. This represented 11.3% year-over-year growth, higher than for the major record labels (+9.7%) and the industry overall (+10.2%). Fans tend to be loyal to independent artists and are more likely to buy album LPs, CDs, and cassettes, which generate higher revenue than streaming. Independent labels comprised slightly more than 39% of physical album sales. Independents’ share of streaming was 28.3%.

Wait, cassettes? Yes, cassettes. “People still want to hold something, look at images, see it move,” said Stephen Bishop, founder of cassette label Opal Tapes. In recent years, cassettes have made a comeback. Although still a minuscule amount of overall revenue, sales doubled from 2016 to 20172 in the United Kingdom alone, with a 90% increase in the first half of 2018. According to Nielsen Music, in the United States, cassette album sales increased from 178,000 units in 2017 to 219,000 in 2018.3 Releasing an album on cassette gives an emerging artist a way to release a limited-edition album with a creative presentation for less cost than releasing it on vinyl. But, it’s not just lesser-known artists doing this. The top-selling album on cassette in the first half of 2018 in the U.K. was Kylie Minogue’s Golden.

1 Based on revenue.
2 From 10,912 units sold in 2016 to 22,011 in 2017.
3 In 2018, this was less than two-tenths of a percent of overall album sales.

Geographic reference: World
Year: 2017
Market size: $6.9 billion
Sources: Wintel Worldwide Independent Market Report 2018, December 2018 available online here; Paul Resnikoff, “Collectively, Indie Labels Are Now Bigger Than Any Major Label,” Digital Music News, May 20, 2018 available online here; “Labels and DIY Artists,” Association of Independent Music available online here; “Who Is A2IM?” available online here; “Forget The Vinyl Revival: The Cassette Tape Revival is in Full Flow, Honest,” Louder, November 27, 2018 available online here; Eoin Murray, “Why the Cassette Revival Is Essential for Electronic Music,” DJ, September 21, 2018 available online here; Rob Copsey, “The Official Top 20 Best-Selling Cassettes of 2018 So Far,” Official Charts, July 25, 2018 available online here; Joyce, Joe Price, Alex Gardner, “33 Independent Record Labels You Should Know,” Complex, July 26, 2017 available online here; Keith Caulfield, “U.S. Cassette Album Sales Grew 23% in 2018, Aided by Britney Spears, ‘Guardians,’ Twenty One Pilots & More,” Billboard, January 17, 2019 available online here.
Image source: AliceKeyStudio, “turntable-vinyl-sound-music-1208177,” Pixabay, February 19, 2016 available online here.

Streaming Music Services

streaming musicHave you listened to music today? If you have you probably streamed it. In 2017, total U.S. music industry revenue was $8.7 billion, 65% of which came from streaming music services. Revenues from streaming services increased 217% from 2014 to 2017. The number of subscribers to paid streaming music services increased 358% during this time period, topping out at 35.3 million in 2017. Despite revenue and number of subscribers increasing, streaming music services are losing between $27 million and $426 million per year. How are musicians faring? On average, the top streaming services pay between $0.019 and $0.0007 per play in 2018. As a result, musicians need their songs streamed between 77,500 and 2.1 million times per month, depending on platform, in order to make a minimum wage.1
Today’s market size shows the amount of revenue earned in 2014 and 2017 from streaming music services in the United States. As of March 2018, the top streaming services in terms of the number of users worldwide were YouTube (1 billion users), Spotify (159 million), Pandora (81 million), Apple Music (36 million) and Amazon (20 million).

1 Minimum wage according to the source is $1,472 per month.

Geographic reference: United States
Year: 2014 and 2017
Market size: $1.8 billion and $5.7 billion respectively
Sources: Joshua P. Friedlander, “News and Notes on 2017 RIAA Revenue Statistics,” The Recording Industry Association of America, March 22, 2018 available online here; “Money Too Tight to Mention?” Information is Beautiful, March 3, 2018 available online here; Chris Cooke, “US Record Industry Revenues Up to $8.72 Billion Thanks to All Your (Mainly Premium) Streams,” CMU, March 23, 2018 available online here.
Image source: FirmBee, “mobile-phone-iphone-music-616012,” Pixabay, January 30, 2015 available online here.

Expenditures on Reading Materials

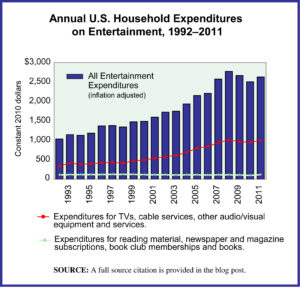
The U.S. Bureau of Labor Statistics (BLS) carries out an annual survey of millions of households to track what they spend money on, by category. The resulting data has been collected over decades and seeing the trends that these data expose over time is very interesting.

The graph presented here is made with BLS data from this survey series. It shows inflation-adjusted household expenditures on all categories of entertainment, as well as two subsets of expenditures, (1) those for TVs, audio/video equipment and services, such as cable subscriptions and (2) expenditures for reading material. The full category of entertainment expenditures is broad and includes things such as:

—Fees to attend concerts, sporting events, movies, and sporting clubs/fraternal organizations.
—TVs, radios and other audio/video equipment as well as subscriptions for cable, premium TV and the like.
—Pets, toys and hobbies, as well as all the services and equipment related to those.
—Bikes, athletic shoes, and equipment for camping, exercising, fishing, and all sports, as well as boats and docking fees, fireworks, pinball machines and video consoles.

Today’s market size is the average spent by U.S. households on reading material in 1994 and in 2011. The figures do not include expenditures for any textbooks or reading material purchased as part of a formal educational program. The transition to digital which is taking place in most areas of publishing is not well tracked by this BLS survey series. It is unclear from studying the survey results, for example, whether or not all online subscriptions to newspapers and magazines are consistently captured in the expenditure category “Reading.” Over time this will change as time allows data collection organizations, like the BLS, to adjust to the digital transition. Data collection organizations can only adjust as quickly as the industries they cover—in this case, the publishing industry—adjust to such dramatic changes.

Geographic reference: United States
Year: 1994 and 2011
Market size: $165 and $115 respectively. These figures translate to a national gross household spending on reading materials for each of those years of $16.86 billion and $14.06 billion respectively
Source: “Consumer Expenditure Survey,” Multiyear Tables: 1992-99 Multiyear Table, 2000-05 Multiyear Table, and 2006-11 Multiyear Table, all available on the Bureau of Labor Statistics website here.
Original source: U.S. Department of Labor, Bureau of Labor Statistics, Consumer Expenditure Surveys
Posted on May 9, 2013

Musical Instruments

Manufacturer product shipments

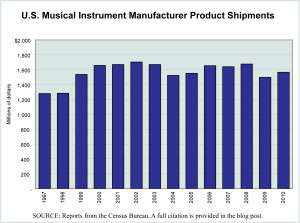
In a recent New York Times article about leading electric guitar maker, Fender, we found the size of the retail sales figure for musical instruments in the United States. But, it made us think, what about musical instrument manufacturing in the United States? It turns out that U.S. musical instrument manufacturers are weathering the 2007–2009 recession and slow recovery since reasonably well.

The graph presents data from the U.S. Census Bureau on musical instrument manufacturer product shipments annually from 1997 through 2010. The value of U.S. made musical instruments grew, if slightly, over this period. When compared with the value of musical instrument imports, we look at a different time period, 2000 to 2010. Over the first decade of the new century, the value of U.S. made musical instruments fell by 5.5% while the value of musical instrument imports fell 7.0%.

Today’s market size is the value of all musical instrument sales in the United States in 2011. Please note that the figures in the graphic are not retail sales, rather values based on wholesale values.

Geographic reference: United States
Year: 2011
Market size: $6.5 billion
Source: Janet Morrissey, “Aiming To Stay Plugged In,” September 30, 2012, The New York Times, page B1. The graphic was produced with data from the “Annual Survey of Manufactures: General Statistics: Statistics for Industry Groups and Industries: 2010 and 2009,” and earlier “Annual Survey of Manufacturer” reports on the industry, NAICS 339992 Musical Instrument Manufacturing. The Census Bureau data are available online through their American FactFinder website, here.
Original source: Music Trades
Posted on October 9, 2012

Headphone Market

The arrival of a new, high-end, expensive and very fashionable headphone has stirred up the market for headphones. Headphones are a reasonably mature product segment which was infused with energy over recent years by earbuds that are commonly used with MP3 players of all sorts as well as cell phones and other small recording devices. But it was the arrival on the scene of the headphone, Beats by Dr. Dre, that reinvigorated the market most recently, the sales of which account for nearly a quarter of the market size listed below. Celebrity meets audio equipment and the market expands. Increased hearing loss in adolescents may be part of the unseen price being paid.

Geographic reference: United States
Year: 2011
Market size: $2 billion
Source: “Headphones With Swagger (and Lots of Bass),” The New York Times, Sunday, November 20, 2011, page B1, available online here. Also, “One in Five U.S. Adolescents Has Hearing Loss, Researchers Find,”
Bloomberg.com, August 17, 2010, available online here.
Original source: NPD Group and Journal of the American Medical Association
Posted on November 21, 2011

Vinyl Records Market

Could it be, as some sources are now reporting, that the vinyl record of the past is coming back? The ease of digital sound recording and the distribution of music digitally appeared to have made earlier music recording formats extinct. Now it appears that vinyl records are making a comeback, at least as a niche market.

Today’s market size is an estimated total number of vinyl records sold in the United States in 2007 and in 2010, a significant portion of which are newly pressed vinyl recordings.

Geographic reference: United States
Year: 2007 and 2010
Market size: 988,000 units and 2.8 million units respectively
Source: David Giffels, “Building a House of Wax,” The New York Times Magazine, October 23, 2011, page 28, available online here. Amira Jensen, “Dust off the Turntable: Record Sales Jump,” ABC News / On Campus, April 6, 2009, available online here.
Original source: Neilsen Company
Posted on October 26, 2011

Home Entertainment Market

Home Entertainment Spending, 2000-2010

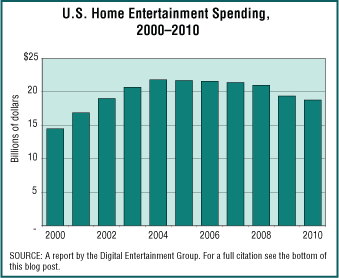
Today’s market size is the value of spending on the home entertainment segment related to films and all forms of videos that are rented and purchased, on DVD, CD, and downloaded electronically. The graph shows how this market has fared for the first decade of this century and shows that even the strong home entertainment segment has seen declines during the recession that started in December 2007. Actually, spending in this market peaked in 2004 and 2005 and has declined slightly every year since then.

Geographic reference: United States
Year: 2010
Market size: $18.8 billion
Source: “DEG Year-End 2010 Home Entertainment Report,” a report produced by the industry-funded nonprofit corporation Digital Entertainment Group. The report is available online here.

Music Stores

To be precise, the figures below are for the industry designated by the Census Bureau as Prerecorded Tape, Compact Disc and Record Stores [NAICS 45-1220]. Now, the very name of this industry will likely explain why it has seen such precipitous declines over the last decade… since music is now so often purchased online and downloaded as an electronic file. It also serves as an extreme example of a retailing segment that is having to grapple with a major shift in how business is done.

Geographic reference: United States
Year: 1997 and 2007
Market size: Number of Establishments: 8,158 and 4,102 respectively.
Market size: Sales: $7.37 and $3.51 billion respectively.
Market size: Employment: 66,623 and 28,685 respectively.
Source: “Sector 44: EC0744I2: Retail Trade: Industry Series: Preliminary Comparative Statistics for the United States (2002 NAICS Basis): 2007 and 2002,” 2007 Economic Census, available online here. The data from 1997 are from the 1997 Economic Census, after conversion of the data to a NAICS 2002 basis.
Original source: U.S. Department of Commerce, Bureau of the Census.

Publishing of Catholic Liturgical Music

Data show the number of Catholic liturgical music publishers in the United States in 2010. Those publishers include GIA Publications, OCP Publications, and World Library Publications, a division of J.S. Paluch.

Geographic reference: United States
Year: 2010
Market size: 3
Source: Mark Pattison, “Site Lets Liturgical Music Composers Sell Songs Directly to Musicians,” The Michigan Catholic, May 28, 2010, page 26

DVD Audio and Super Audio CD Market

Data show shipments of titles in the DVD Audio and Super Audio CD formats. While these formats provide higher-quality audio than CDs or MP3s they are losing market share rapidly.

Geographic reference: United States
Year: 2003 and 2009
Market size: 1,700,000 and 200,000 respectively
Source: Joseph Plambeck, “In Mobile Age, Sound Quality Steps Back,” The New York Times, May 9, 2010 available online here.
Original source: Recording Industry Association of America