3D Printing Construction

Geographic reference: World
Year: 2020 and 2028
Market size: $7.08 million and $1.03 billion, respectively

3D printers have come a long way since they were invented by Charles W. Hull in the mid-1980s. 3D printing, also known as additive manufacturing, involves laying down material, layer by layer, to form three-dimensional objects. The instructions to do this come from digital files created using computer-aided design or computer-aided manufacturing software. The files can also be created using a 3D scanner. While much of 3D printing is used to create product models and prototypes, final products are also being made, from toys to auto parts to prosthetic devices. And, more recently, houses and other infrastructure. In January 2021, the first neighborhood of 3D printed houses was being built in California. In April 2021, a couple in the Netherlands became Europe’s first tenants of a fully 3D printed house. Venice is home to the first 3D printed concrete footbridge and Amsterdam is home to the first 3D printed steel footbridge.

The advantages of 3D printing in the building sector include high accuracy, increased efficiency, reduced labor cost, and greater speed in construction. Some houses can be built in two or three weeks at a 40% lower cost. 3D printing also allows builders to construct complex building structures that would be difficult or impossible the traditional way. In addition, 3D printing construction is more eco-friendly than traditional building methods. According to the World Green Building Council, the building and construction sector produces 39% of all carbon emissions. However, 3D printing methods can prevent up to 2,000 kg of carbon dioxide from entering the atmosphere per house built. It also produces up to 10 times fewer waste products than traditional building methods.1 Major disadvantages hindering adoption of this technology on a wider scale are the high cost of investment in both equipment and materials,2 lack of skilled labor, limitation of the machinery, and concerns about the intellectual property rights of the structural designs.

Two of the most used methods of 3D printing construction are extrusion and powder bonding. Extrusion accounted for a greater than 61% revenue share in 2020. This method is mostly used for on-site construction. It uses traditional construction materials such as geopolymers, concrete, cement, clay, and plaster. Powder bonding is expected to see significant growth through 2028 as demand for faster, simpler, and more accurate methods for creating complex formwork increases. 

Concrete had the highest revenue share in 2020, 32%. 3D concrete printing is used as an alternative to traditional concrete construction to reduce cost, labor, and time. Metal is expected to experience substantial growth through 2028. Metal 3D printing is used primarily for designing facade nodes and other connectors. It’s also used for bridge construction. 

The construction of commercial, residential, and industrial buildings accounted for more than 73% of revenue in 2020; the other 27% was from infrastructure. The Asia-Pacific region held a 38% revenue share in 2020, the highest in the world. Major companies in this market include COBOD International A/S, Yingchuang Building Technique Co. Ltd., XtreeE, Apis Cor, WASP S.r.l., CyBe Construction, Sika AG, MX3D, Contour Crafting Corp., ICON Technology Inc., and Constructions -3D. Some developers and construction companies are partnering with 3D printing companies to strengthen their market share and increase their offerings. For example, 3Strands, a Kansas City developer, partnered with ICON to build 2- and 3-bedroom homes in Texas. Other companies are focusing on innovative product offerings to attract clients. Yingchuang Building Technique built the first 3D printed bus stop in Jinshan Garden, China. It was made using recycled waste material.

The 3D printing construction sector is a minuscule part of the overall $11.5 trillion global construction market and is expected to still be a tiny part of the overall market in the future, despite anticipated growth of more than 14,500% from 2020 to 2028. But, as the demand for green affordable housing and environmentally-friendly business practices grows and the supply of construction workers shrinks, 3D printing construction may take up an increasingly larger share of the overall construction market. 

1 According to Mighty Buildings, a builder of modern 3D printed prefabricated buildings.
2 Industrial scale 3D printers used in construction, some measuring 20 feet high, 140 feet wide, and 120 feet long, cost more than half a million dollars. Materials used for these printers cost considerably more than traditional building materials.

Sources: “3D Printing Construction Market Size, Share & Trends Analysis Report by Construction Method (Extrusion, Powder Bonding), by Material Type, by End User (Building, Infrastructure), by Region, and Segment Forecasts, 2021 – 2028,” Grand View Research Report Overview, July 2021 available online here; “3D Printing Construction Market Size Worth $1,034,096.7 Thousand by 2028: Grand View Research, Inc.,” CISION PR Newswire, July 22, 2021 available online here; “Global Construction Market Expected to Reach $16.6 Trillion by 2025, Growing at a CAGR of 7% – ResearchAndMarkets.com,” Business Wire, March 9, 2021 available online here; Rosie Frost, “These 3D Printed Net-Zero Buildings Could Be the ‘Future of Housing’,” euronews.green, April 1, 2021 available online here; Sam Lubell, “3D-Printing Is Speeding Up the Automation of Construction,” Metropolis, February 15, 2021 available online here; Matt Hickman, “World’s First 3D-printed Steel Bridge Debuts in Amsterdam’s Red Light District,” The Architect’s Newspaper, July 21, 2021 available online here; Tony Hoffman, “3D Printing: What You Need to Know,” PC Mag, July 1, 2020 available online here; Daniel Boffey, “Dutch Couple Become Europe’s First Inhabitants of a 3D-printed House,” The Guardian, April 30, 2021 available online here.
Image source: Mebner1, “printer-3d-pressure-3d-printing-1455166,” Pixabay, June 15, 2016 available online here.

Moving Day

Bar Chart

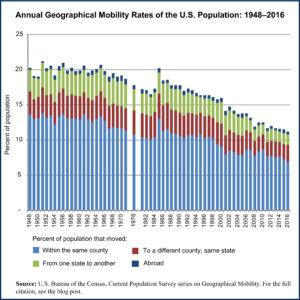
Today we are looking at the number of people who make a residential move in the United States each year. This is a measure of geographical mobility and has been tracked by the U.S. Census Bureau annually for decades. Using their data we produced a graph showing the annual percent of the U.S. population aged one year or more that moved from one place to another each year.

Americans think of themselves as a very mobile people, both in terms of economic mobility as well as actual, physical mobility. And yet, in truth, we are less mobile than we were in the past. As the data in the graph show, we actually move far less often now than in the past. The trend is towards fewer moves and moves of shorter distance.

There are many reasons for this change, from an aging population to less regional diversity in the growing service industries than existed in the manufacturing sector. An increasing use of occupational licensing practices and a declining rate of job changing in the United States also contribute to this change. (Yes, contrary to popular thought, we actually change jobs more infrequently than in the past.)

Some analysts see the declining rate of geographical mobility in the United States as one of the reasons behind a declining rate of productivity growth. Others see it as just another consequence of decreased median income growth. What is clear is the fact that we are staying put at much higher rates now than we did thirty years ago.

For those interested in reading more about this topic, we provide a link to further reading about it under the source note below.

Geographic reference: United States
Year: 1976 and 2016
Market size: 36.8 million (17.7% of the population) and 35.1 million (11.2%)
Source: “Table A-1. Annual Geographical Mobility Rates, By Type of Movement: 1948-2016,” Current Population Survey, Historical Migration/Geographic Mobility Tables, November 15, 2016, available here.
Original source: U.S. Department of Commerce.
Further reading: Tyler Cowen, “The Unseen Threat to America: We Don’t Leave Our Hometowns,” Time, February 22, 2017, available online here.

Home Sales

Housing

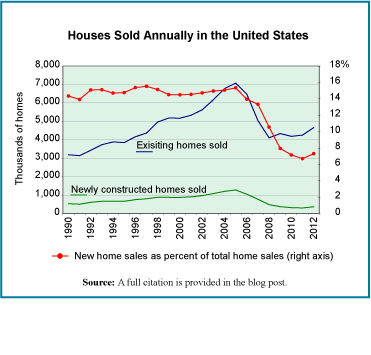
The residential housing market in the United States is beginning to show signs of recovery five years after the market crashed. While signs of recovery are there in the number of houses selling as well as the prices they are selling for, confidence in these signs appears to be weak and many in the real estate industry fear that a rise in interest rates could cause the housing market recovery to stall.

The graph shows home sales in the United States by number of new and existing homes sold annually. The percent of total sales made up of the sale of newly constructed homes is shown in red.

Today’s market size is the number and approximate value of newly constructed homes that were sold in 2005 (the peak year in terms of number of homes sold) and in 2012.

Geographic reference: United States
Year: 2005 and 2012
Market size: 1.283 million units for a value of $381.1 billion in 2005 and 364 thousand units in 2012 with a value of $107.5 billion
Source: “New Residential Sales, Historical Data,” U.S. Census Bureau, last updated on August 12, 2013, available online here.
Original source: U.S. Bureau of the Census and National Association of Realtors
Posted on September 30, 2013

Detroit Housing Stock

Much has been written in the national press about Detroit over the last week and in the wake of that city’s filing for bankruptcy protection on July 18th. The debates about how the situation was allowed to get so bad and what is to be done now have been lively. For those of us who live in the shadow of this once great city, none of this is new. These debates have raged here for years, and the march to insolvency has been a long one, like a Greek tragedy playing out in slow motion. It is the true scope of the challenge that is difficult for those not familiar with Detroit to fully understand.

Today’s market size post is the size of the housing market in the City of Detroit, more specifically, the total number of housing units in that city. The figure provided includes housing units that are not habitable. In fact, when one calculates the percentage of housing units in Detroit that are actually occupied the number is only around 20%. To further place this housing stock figure into context, the population of the city is also provided below as is the median sale price of a home in Detroit.

Geographic reference: Detroit
Year: 2011
Market size: Housing Units: 1,886,537
Market size: Population: 701,500 (2012)
Market size: Median Home Sale Price: $9,568 (in May of 2013 this median price had risen to $11,100)
Source: [1] “Detroit (city), Michigan,” State and County QuickFacts, a presentation of current U.S. Census data originally made available online here. For updated Census data, see the Further reading section below. [2] JC Reindl, “Chapter 9 Unlikely to Hurt Home Prices,” Detroit Free Press, July 21, 2013, page B1. [3] Charles B. Stockdale, Douglas A. McIntyre and Michael B. Sauter “American’s Ten Sickest Housing Markets,” NBCNews.com, August 5, 2011, available online here.
Original source: U.S. Census Bureau, S&P/Case-Shiller and Realcomp
Further reading: “Selected: Detroit city, Michigan; Michigan,” Quick Facts, U.S. Census Bureau available online here; “Detroit city, Michigan,” American FactFinder, U.S. Census Bureau available online here; “Detroit, MI Schools,” AreaVibes available online here.
Posted on July 23, 2013

Garage Storage and Organization

Products purchased to help organize the garage constitute the fastest growing segment of the home storage and organization market. In recent years, the garage has become more than just a place to park cars. Only 35% of garages made to fit at least two cars have room for more than one. While many homeowners use their garage for storage, there’s a growing segment of the population that use their garage as an extension of their home — installing granite floors, wide-screen televisions, and state of the art sound systems.

Data show the projected size of the garage storage and organization market in the United States in 2015. That year, the total home storage and organization market is expected to reach $9 billion, which means that the garage segment will represent nearly a fifth of the total market. Managing all of our stuff has become a real job and for some, a business.

Geographic reference: United States
Year: 2015
Market size: $2 billion
Source: Jayne O’Donnell, “Garages Can Be a Man – Or Woman – Cave,” Detroit Free Press, April 21, 2013, available online here.
Original source: Freedonia Group
Posted on April 25, 2013

Windows

Window manufacturers have been hit hard by the decline in new home construction. Today’s market size is the total number of windows shipped by manufacturers in the United States for use in new construction in 2005 and an estimate of what that number will be for 2011. Leading manufacturers of window include Anderson Corp.; Atrium Windows and Doors; Jeld-Wen, Inc.; Marvin Windows and Doors; and Pella Corp.

Geographic reference: United States
Year: 2005 and 2011
Market size: 34.1 million and 11.9 million units respectively
Source: Andrew Martin, “In Company Town, Cuts but No Layoffs,” The New York Times, September 25, 2011, page B1 and B10, available online by a different title here.
Posted on October 19, 2011

Home Equity Lines of Credit

Home equity lines of credit, also known as second liens, are part of the overall financial sector and part of the troubled housing sector as well. The bursting of the housing bubble in early 2008 started what became a worldwide financial crisis which is still destabilizing financial markets around the globe to this day. The housing market in the United States is still very unstable with an estimated 23% of mortgage holders owing more on their mortgages than the current value of the asset for which the loan was acquired (e.g. they are underwater). Of mortgaged properties that are underwater, approximately 40% also carry a home equity line of credit worth an average per property of $65,000. We should expect to see continued write-downs within the banking industry related to the housing crisis for some time to come.

Today’s market size is the value of bank holdings in home equity loans as of the first quarter of 2011.

Geographic reference: United States
Year: First quarter of 2011
Market size: $624 billion
Source: Gretchen Morgenson, “2nd Loan, 2nd Wave of Losses,”, The New York Times, July 17, 2011, page B1.

Reverse Mortgages

A reverse mortgage is a loan mechanism that allows the owner of a home to borrow against the value of that home. This is done while the homeowner and borrower continues to live in the home, maintains the home and pays the taxes owed on the home and property. To qualify for such a loan the borrower must be at least 62 years of age.

While the first reverse mortgage established in the United States purportedly dates back to 1961 it was the housing bubble of the last decade that brought this form of lending to the public’s attention. And, as with so many things that blossomed during the distortions of the real estate bubble, the bloom is off the rose of reverse mortgages. The two largest providers of reverse mortgages exited the business during 2011.

Today’s market size is the dollar volume of the reverse mortgage business in the United States in 2001 and 2010. Worth noting is the fact that while these two points in time show a significant increase in this business, the peak came in 2009.

Geographic reference: United States
Year: 2001 and 2010
Market size: $0.5 and $10.3 billion respectively
Source: Tara Siegel Bernard, “2 Big Banks Exit Reverse Mortgage Business,” The New York Times, June 18, 2011, page B1, available online here.
Original source: Reverse Market Insight

Manufactured Home Dealers

Data presented are revenues for 2010. The industry did well during the housing boom, but since then has faltered. Over the entire period from 2000 to 2010, the industry declined 73.7 percent and is expected to decline another 62 percent from 2010 to 2016.

Geographic reference: United States
Year: 2010
Market size: $4.5 billion
Source: Phil Izzo, “Top 10 Dying Industries,” The Wall Street Journal, March 28, 2011, available online here.
Original source: IBIS World

Bricks

Today we look at the market size of another construction materials industry that has been hard hit by the housing crisis in the United States. The market size being presented here, for two different years, is the number of standard brick equivalents or SBEs shipped by the industry per year. It is worth noting that the interim years, between 1995 and 2009, saw strong sales and shipments—in the range of 8 to 9 billion SBEs—but did not skyrocket quite as much as some other construction material sectors.

Geographic reference: United States
Year: 1995 and 2009
Market size: 7.0 billion and 3.7 billion SBEs respectively.
Source: “Boral USA, Analyst Visit,” a presenation, table 60, September 2009.
Original source: Boral Ltd. and Brick Industry Association

Mortgage Debt Nationally

Mortgage Debt Nationally, 1960 to 2009

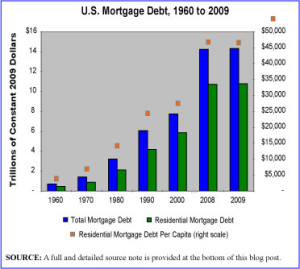
It should not come as a surprise to see that the U.S. has dramatically increased its national, total mortgage debt over the last few decades and in particular over the last decade. The graphic presented here shows the increase in national mortgage debt from 1960 to 2009. The most striking leaps in indebtedness are seen in the period since 2000. While not surprising since we all now understand that the last decade was indelibly marked by a housing bubble, it is sobering to see just how high that debt really is, well after the bubble has burst.

The graphic depicts inflation-adjusted dollars so what we see here is the increase in mortgage debt AFTER INFLATION. Just for fun, the graphic also shows—with an orange dot per year—residential mortgage debt on a per capita basis, using the right scale on the chart. We are certainly an indebted people.

Geographic reference: United States
Year: 2009
Market size: $14.3 trillion, of which $10.8 trillion is residential mortgage debt as opposed to commercial or agricultural mortgage debt.
Source: “Table 1191 — Mortgage Debt Outstanding by Type of Property Holder: 1952–2009,” Statistical Abstract of the United States: 2011, available online here.
Original source: Board of Governors of the Federal Reserve System, “Federal Reserve Statistical Release, Z.1, Flow of Funds Accounts of the United States,” March 2010, available online here.
Full source note for graphic: “Table 1191 — Mortgage Debt Outstanding by Type of Property Holder: 1952–2009,” Statistical Abstract of the United States: 2011; Population data 1960-1970: “No. HS-1. Population: 1900-2002,” available online here; Population data 1980-2009: “Table 7. Resident Population by Sex and Age: 1980 to 2009,” Statistical Abstract of the United States: 2011, page 11 available online here. The price deflator series used to convert current dollars to constant 2009 dollars came from two spreadsheets. For 1960: “Table 7.14. Chain-Type Quantity and Price Indexes for Gross Domestic Product by Sector,” Bureau of Economic Analysis, February 28, 2003 available online here; For 1970-2009: “Table B-6. —Chain-type quantity indexes for gross domestic product, 1962-2010,” Economic Report of the President: 2011 Spreadsheet Tables, U.S. Government Printing Office, available online here.

Number of Repossessed Homes

During the housing market crisis we have read many and often contradictory accounts of just how many homes are in foreclosure, or the number of homes being foreclosed upon, or the number of home mortgages in a delinquent state. The process of foreclosing on a delinquent mortgage is a lengthy one and the measures being spoken of in the media so often refer to measurements at different stages in this process. What we present here are the number of homes that were repossessed by the bank, the number of home foreclosures that reach the endgame in three different years.

Geographic reference: United States
Year: 2008, 2009 and 2010 (estimate)
Market size: 862,000, 918,000 and 980,000 housing units respectively
Source: “Record U.S. Foreclosures in 2009,” an article on the World Socialist Web Site, available online here. The 2010 figure was taken from “Number of Homes Taken by Lenders Tumbles,” SFGate.com a news site sponsored by Hearst Communications Inc. and available online here.
NOTE: A new RealtyTrac Press Release came out on January 13, 2011 and has been reported on by the AP here. The AP report states that over one million homes were repossessed in 2010. This heavily repeated figure is all over the news, blogospher, and Internet yet, oddly, we have been unable to obtain an actual figure of repossessed homes from a thorough search of the RealtyTrac web site. So, we shall leave our originally presented estimate as is.
Original source: RealtyTrac Inc.

Homes

After looking at the number of vacant homes in the United States, we turn to a measure of all houses in the country. The market size number presented below includes all single-family attached and detached units as well as apartments and condominiums, it is the total of all residential housing units.

This market size is broken out by type of housing unit in this way: Single family detached homes, 63.4%; single family attached (townhouses and the like), 5.5%; apartments and condominiums in 2 to 4 unit buildings, 7.8%; units in 5 to 9 unit buildings, 4.9%; units in buildings with 10 to 19 units, 7.4%; apartments and/or condominiums in buildings with 20 or more units, 7.4%, and manufactured/mobile homes, 6.8%.

Geographic reference: United States
Year: 2009
Market size: 130,112,000 housing units
Source: “Housing Units—Characteristics by Tenure and Region: 2009,”
Statistical Abstract of the United States: 2011, Table 983, U.S. Census Bureau, page 616.
Original source: U.S. Department of Commerce, Bureau of the Census.

Vacant Houses

In this year’s edition of the always useful Statistical Abstract of the United States, a publication we turn to often in our work, we found the number of vacant housing units (single-family attached and detached units as well as apartments, all capable of occupancy year-round).

Geographic reference: United States
Year: 2009
Market size: 13,688,000 units
Source: “Housing Units—Characteristics by Tenure and Region: 2009,” Statistical Abstract of the United States: 2011, Table 983, U.S. Census Bureau, page 616.
Original source: U.S. Department of Commerce, Bureau of the Census.

Prefabricated Wooden Buildings

This post shows the size of the manufacturer’s market for prefabricated stationary wood buildings sold in precut packages. It is the value of these building packages to the manufacturer and doesn’t include the costs of transportation.

Geographic reference: United States
Year: 2002 and 2008
Market size: $668.5 million and $407.8 million respectively
Source: Annual Survey of Manufactures 2008, March 30, 2010, available online here and the Annual Survey of Manufacturers 2003.
Original source: U.S. Bureau of the Census

Shared Ownership Communities

The market sizes listed show the number of shared ownership communities. These communities include condominiums, cooperatives, and homeowners association communities. In 2010, 24 million families and 60 million individuals lived in shared ownership communities. Collectively, these homeowners paid $41 billion in assessments. The rise in number of such communities is an interesting trend for a society that holds individuality in such high esteem.

Geographic reference: United States
Year: 1965 and 2010
Market size: 1,000 and 300,000 respectively
Source: Steve Bergsman, “Read Fine Print Before Buying Into Community,” Mlive.com, June 25, 2010 available online here.