Gaming Software

The production of video game software is part of the larger software publishing industry, a small part but a growing part. Based on the report used as our source here, cited below, and data from the U.S. Census Bureau on the industry as a whole, in 2010 the gaming software revenue portion of the larger software industry accounted for 6.7% of the total. Today’s market size is the estimated revenue of the largest 220 companies active in the entertainment and games software industry in the United States.

Geographic reference: United States
Year: 2010
Market size: $10 billion
Source: “Entertainment & Games Software Industry Profile,” last updated on November 7, 2011. This is a report being sold by First Research on the website here.
Original source: First Research
Posted on November 18, 2011

Vinyl Records Market

Could it be, as some sources are now reporting, that the vinyl record of the past is coming back? The ease of digital sound recording and the distribution of music digitally appeared to have made earlier music recording formats extinct. Now it appears that vinyl records are making a comeback, at least as a niche market.

Today’s market size is an estimated total number of vinyl records sold in the United States in 2007 and in 2010, a significant portion of which are newly pressed vinyl recordings.

Geographic reference: United States
Year: 2007 and 2010
Market size: 988,000 units and 2.8 million units respectively
Source: David Giffels, “Building a House of Wax,” The New York Times Magazine, October 23, 2011, page 28, available online here. Amira Jensen, “Dust off the Turntable: Record Sales Jump,” ABC News / On Campus, April 6, 2009, available online here.
Original source: Neilsen Company
Posted on October 26, 2011

Video Games

According to the Entertainment Software Association, 72 percent of households in the United States own a video game machine. Initially video games were targeted to males, but by 2010 48 percent of gamers were female. And, although nearly all children aged 12-17 play video or computer games, the average gamer is 37 years old. Nearly one-third of gamers are older than 50.

Data show the amount consumers spend on video games in the United States. To provide some perspective, in 2010, worldwide motion picture ticket sales totaled $31.0 billion. Figures for 2012 are projected.

Geographic reference: United States
Year: 2010 and 2012
Market Size: $25.1 billion and $70.0 billion
Source: Thomas L. McDonald, “Get in the Game,” The Catholic Times, October 1-7, 2011, page 6
Original Source: Entertainment Software Association
Posted on October 20, 2011

Online Poker

Gambling moved onto the Internet as soon as a reliable means of exchanging funds was available on that network. One could call this industry an early adopter of e-commerce. The rules of the game, however, are not always clear and vary from country to country and jurisdiction to jurisdiction which complicates things for a system that spans geographies. Nonetheless, according to those following the market, it is a lucrative one.

Today’s market size is an estimated total number of dollars gambled through online poker sites by Americans in 2010.

Geographic reference: United States
Year: 2010
Market size: $16 billion
Source: Janet Morrissey, “Poker Inc. To Uncle Sam: Shut Up and Deal,” The New York Times, October 9, 2011, page B1, available online here.
Original source: PokerScout.com
Posted on October 18, 2011

Spectator Sports

Today’s market size is the estimated total of revenue brought in by professional or semi-professional sports teams or clubs primarily engaged in participating in live sporting events—baseball, basketball, football, hockey, soccer, and jai alai games—before a paying audience. These establishments may or may not operate their own arena, stadium, or other facility for presenting these events. This is an industry that did not see a decline in revenues year-over-year during the recent recession, though its rate of growth did slow a bit.

Geographic reference: United States
Year: 2009
Market size: $20.64 Billion
Source: “Table 9.1. Arts, Entertainment, and Recreation Services (NAICS 71) — Estimated Revenue for Employer Firms: 2001 Through 2009,” Service Annual Survey: 2010, the report on NAICS Sector 71 is available online here.
Original source: U.S. Census Bureau
Posted on October 7, 2011

The Business of Weddings

Today’s market size is an estimate of the size of the entire wedding industry in the United States—we take some license in using the word “industry” here. The things included in measuring the size of the wedding industry are many, from planning, apparel and jewelry through the ceremony, flowers, food, reception and honeymoon.

Geographic reference: United States
Year: 2010
Market size: $47.2 billion
Source: Toon Van Beeck and George Van Horn, “Wedding Bells are Ringing,” The RMA Journal, December 2010-January 2011, page 22-27, available online here.
Original source: IBISWorld
Posted on October 5, 2011

Major League Baseball Tickets

The 2011 Major League Baseball postseason has begun but statistics have yet to be published to reveal the official number of regular season MLB tickets that were sold this season. Therefore, we look to last year for the size of audiences at MLB games for today’s market size post. Projections early in 2011 forecast a slight increase in ticket sales for 2011.

Go Tigers!

Geographic reference: United States
Year: 2010
Market Size: $73.1 million tickets sold
Source: David Simmons, “Early Ticket Sales and Attendance Projections for MLB in 2011,” Bizofbaseball.com, April 13, 2011, available online here.
Original Source: Business of Sports Network
Posted on October 4, 2011

Amusement Parks

Within the economic sector Arts, Entertainment, and Recreation Services is the Amusement Park Industry. It is defined by the U.S. Census Bureau as an industry covering establishments, known as amusement or theme parks, primarily engaged in operating a variety of attractions, such as mechanical rides, water rides, games, shows, theme exhibits, refreshment stands, and picnic grounds. These establishments may lease space to others on a concession basis. The sector as a whole saw the revenues of employer firms grow by 40.7% between 2001 and 2009. Amusement parks fell shy of this growth rate, growing by a still healthy 34.58% over this period and exceeding the rate of inflation by 13.44%.

Today’s market size is the revenue earned by amusement and theme parks in the United States in 2001 and 2009.

Geographic reference: United States
Year: 2001 and 2009
Market size: $8.64 and $11.62 billion respectively
Source: “Table 9.1. Arts, Entertainment, and Recreation Services (NAICS 71) — Estimated Revenue for Employer Firms: 2001 Through 2009,” Service Annual Survey: 2010, the report on NAICS Sector 71 is available online here.
Original source: U.S. Census Bureau
Posted on September 29, 2011

Bowling Alleys

Today’s market size is a measure of the revenue generated by bowling alleys in the United States in 2001 and in 2009. While it is not a flashy or “extreme” sport, based on bowling alley revenues, it is holding its own in the overall arts and entertainment sector of the economy.

Geographic reference: United States
Year: 2001 and 2009
Market size: $2.88 and $3.11 billion respectively
Source: “Table 9.1. Arts, Entertainment, and Recreation Services (NAICS 71) — Estimated Revenue for Employer Firms: 2001 Through 2009,” Service Annual Survey: 2010, the report on NAICS Sector 71 is available online here.
Original source: U.S. Census Bureau
Posted on September 28, 2011

Pinball Machines

Pinball was a popular form of entertainment in the 1970s through the early 1990s. During this time period, there were five different companies producing 100,000 machines per year. Since then, video games have replaced pinball as a popular pastime. Many businesses such as arcades and bars, where pinball machines were commonplace, saw reduced revenue and decided to get rid of the machines and replace them with video games.

In 2011, Stern Pinball, based in Chicago, Illinois, was the only remaining pinball manufacturer in the world. From 1999 to 2009, the number of pinball machines in commercial locations dropped from 360,000 to 79,000. Data show pinball industry revenues in 1999 and 2009.

Geographic reference: United States
Year: 1999 and 2009
Market Size: $1.1 billion and $275 million respectively
Source: Olivia Oran, “Pinball Fights to Survive in an ‘Angry Birds’ World,” The Street, September 19, 2011, available online here.
Original source: Vending Times
Posted on September 23, 2011

Commercial Casinos

According to a report put out by the American Gaming Association the commercial casino business in the United States, in 2010, employed 340,564 people and paid $7.59 billion in direct gaming taxes. Commercial casinos as a category include Tribal Casinos as well as privately held land-based casinos, river-based casinos and horse racing tracks which are now referred to in the industry as racetrack casinos. While the industry saw year-over-year revenue declines in 2008 and 2009, by 2010 it was recovering.

Today’s market size is the gross gaming revenue earned in the United States by all commercial casinos. By way of comparison, it is worth noting that total commercial casino revenues in 2008 equaled 67.2% of total lottery ticket sales by all government entities ($53.7 billion). Gaming is quite a big business…

Geographic reference: United States
Year: 2002, 2007 (peak year) and 2010
Market size: $28.07, $37.52 and $34.60 billion respectively
Source: “U.S. Commerical Casino Revenue Shows Slight Improvement in 2010,” Casino Journal, June 7, 2011, BNP Media, available online here.
Original source: American Gaming Association
Posted on September 19, 2011

Marinas

Those offering services to boaters by operating docking and/or storage facilities for pleasure craft owners are Marinas. Some marinas offer additional services such as repair and maintenance services as well as retailing of fuel and marine supplies. The states within the United States with the largest marina industries, in order, are Florida, New York, California, Michigan and Massachusetts.

Today’s market size is the estimated revenues from all marinas in the United States in 2009.

Geographic reference: United States
Year: 2009
Market size: $3.3 billion
Source: “Table 9.1. Arts, Entertainment, and Recreation Services (NAICS 71) — Estimated Revenue for Employer Firms: 2001 Through 2009,” Service Annual Survey: 2010. The report on NAICS Sector 71 is available online here.
Original source: U.S. Census Bureau
Posted on September 9, 2011

Streaming Video

Netflix and Hulu are two services that allow their customers to stream videos. A March 2011 Nielsen survey found that a majority of Netflix users who stream videos watch them on their TVs through gaming consoles, while a majority of Hulu users stream video on their computers.

Data are the number of videos streamed in the United States in May 2011. This was an all-time high.

Geographic reference: United States
Year: May 2011
Market size: 15 billion videos
Source: The Associated Press, “Half of Netflix Use Done on Consoles,” Lansing State Journal, July 31, 2011, page 4E

State Fairs

All but two states in the U.S. host an annual state fair. These fairs originated as competitive venues for displaying and ranking of livestock and other agricultural products. The events usually also included competitive events for visitors, such as pie eating contests or contests of strength. The displaying of arts and crafts was also a common feature in early state fairs as it is today still. The earliest official State Fair was in Detroit Michigan. Sadly, Michigan is one of the two states which has discontinued its state fair in the last two years due to budgetary limitations. The other state is Nevada.

Minnesota—the 21st state in a ranking of states based on 2010 population—has consistently had the second ranked State Fair when measured by attendance in recent years.

Today’s market share is the size of the attendance at the 2010 Minnesota State Fair, celebrated between August 26 and September 6, 2010. This year’s Minnesota State Fair will run from August 25 through September 5, 2011.

Geographic reference: State of Minnesota
Year: 2010
Market size: 1.78 million visitors
Source: “Carnivalwarehouse.com’s 2010 Top 50 Fairs,” a ranking published annually by the source, originally Matt’s Carnival Warehouse, founded in 1997. A list of recent Top 50 lists with links to each is available online here.
Original source: Carnivalwarehouse.com

Golfing

Today we look at the size of the market for golfing related expenditures in Michigan, generated by the organization Executive Women’s Golf Association (EWGA). This nonprofit organization, founded in 1991, has the mission of connecting women with golf for both business advantage and fun.

Geographic reference: State of Michigan
Year: 2010
Market size: $1.1 million
Source: “Seeing Green, Golf Courses Increasingly Catering to Women and Families,” Corp!, July/August 2011, page 20
Original source: EWGA estimates

Visitors to Midtown Detroit

In recent years, Midtown Detroit has seen an economic revival. The area is a major destination for visitors to Detroit. The number one destination is the main branch of the Detroit Public Library, followed by The Detroit Institute of Arts across the street. Data show the annual number of visitors.

Geographic reference: Midtown Detroit, Michigan
Year: 2010
Market size: Nearly 1.9 million people
Source: Doug McInnis, “Talk of the Town: Midtown Detroit Undergoes an Economic Revival,” Wayne State, July 2011, pages 10-19
Original source: University Cultural Center Association.

Summer Camp

Today’s market size is the estimated annual number of people attending an organized camping experience of the sort run by the nation’s roughly 12,000 camp organizations. Of these organizations, about two-thirds are non-profits and the rest are privately owned. Most of the people attending camps are children enrolled in summer camps, camps which are tending increasingly towards specializations such as a focus on a particular sport, an artistic pursuit (e.g. music) or an academic area of study (e.g. science).

Geographic reference: United States
Year: 2011
Market size: 11 million
Source: Natasha Singer, “When S’Mores Aren’t Enough,” The New York Times, July 10, 2011, page B1.
Original source: American Camp Association

Fireworks

The sale of fireworks in the United States has been a healthy business for ten plus years now, showing little or no sign of decline during the recession of 2007–2009. In fact, according to the American Pyrotechnics Association, each year of the decade between 2000 and 2010 saw increased revenues for the industry, averaging 5.7% growth annually. In terms of explosive power, measured in pounds of explosive material, however, 2005 was the peak year.

Sales to the public, in general, make up approximately two-thirds of fireworks industry sales. The steadily rising sales in this industry are, in part, due to an increasing number of states that allow for the sale of fireworks. Only four states, as of January 2011, continue to ban the sale of fireworks. Restrictions on the use of fireworks are, however, more widespread.

Today’s market size is total fireworks industry revenue and total pounds of explosives sold in various years.

Geographic reference: United States
Year: 2000, 2005 and 2010
Market size: 2000 — $610 million and 152.2 million lbs.
Market size: 2005 — $880 million and 281.5 million lbs.
Market size: 2010 — $952 million and figures on the number of pounds of explosives that were sold are not yet available.
Source: “Fireworks Industry Facts & Figures,” a website with industry statistics offered by the American Pyrotechnics Association and available here.

Home Entertainment Market

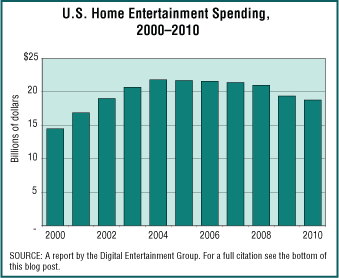
Home Entertainment Spending, 2000-2010

Today’s market size is the value of spending on the home entertainment segment related to films and all forms of videos that are rented and purchased, on DVD, CD, and downloaded electronically. The graph shows how this market has fared for the first decade of this century and shows that even the strong home entertainment segment has seen declines during the recession that started in December 2007. Actually, spending in this market peaked in 2004 and 2005 and has declined slightly every year since then.

Geographic reference: United States
Year: 2010
Market size: $18.8 billion
Source: “DEG Year-End 2010 Home Entertainment Report,” a report produced by the industry-funded nonprofit corporation Digital Entertainment Group. The report is available online here.

NASCAR Attendance

The first decade of this century has been one of great change for auto racing, the sport we call NASCAR (National Association for Stock Car Auto Racing). TV audience ratings have been falling and despite ticket price reductions, so has attendance at NASCAR races since peaking in 2006. The struggles of the auto industry in general may be part of the pall which seems to have fallen upon this sport. Some people blame changes made to increase the safety of the vehicles after the death of one of the sports’ most recognizable drivers, Dale Earnhardt Jr., during a race in 2001 for the declines in NASCAR audiences. Others suspect the recession is having a harder impact on fans of NASCAR than it is on fans of other sports. Whatever the cause, the sport is, for now, in decline.

Today’s market size is the estimated attendance at NASCAR races in the United States for the 2006 and 2010 seasons.

Geographic reference: United States
Year: 2006 and 2010
Market size: 4.6 and 3.6 million respectively
Source: Nate Ryan, “Action on Track Isn’t Helping NASCAR Attendance, Ratings,” USA Today, February 18, 2011, page 2A.
Original source: NASCAR estimates