Enzymes

enzymes in laundry detergent
Laundry detergent. Enzymes in laundry detergent allow clothes to be washed in cold water.
Geographic reference: World
Year: 2019 and 2027
Market size: $9.9 billion and $17.2 billion, respectively
Sources: “Enzymes Market Size, Share & Trends Analysis Report by Application (Industrial Enzymes, Specialty Enzymes), by Product (Carbohydrase, Proteases, Lipases), by Source, by Region, and Segment Forecasts, 2020 – 2027,” Grand View Research Report Summary, March 2020 available online here; “Enzymes Market Size Worth $17.2 Billion by 2027 | CAGR 7.1%: Grand View Research, Inc.,” CISION PR Newswire, March 16, 2020 available online here; Sindhu Raveendran, et. al., “Applications of Microbial Enzymes in Food Industry,” Food Technology & Biotechnology, March 2018 available online at the U.S. National Library of Medicine, National Institutes of Health here; JanMaarten van Dijl and Michael Hecker, “Bacillus Subtilis: From Soil Bacterium to Super-secreting Cell Factory,” Microbial Cell Factories, January 14, 2013 available online here; “A Global Fermentation Approach,” Leaf by Lesaffre available online here; “Specialty Enzymes Market Worth $6.6 Billion by 2025,” MarketsandMarkets Press Release, April 20, 2020 available online here.
Image source: habelfrank, “washing-powder-detergent-1500058,” PIxabay, July 7, 2016 available online here.

Enzymes are proteins that act as catalysts. Enzymes in the body run cellular processes and convert food to energy and to building blocks for proteins, lipids, nucleic acids, and some carbohydrates. Industrial enzymes such as proteases, amylases, lipases, and others are used in various applications: in the food and beverage industry, in detergents, animal feed, biofuels, textiles, pulp and paper, nutraceuticals, personal care products and cosmetics, wastewater treatment, and medications. In 2018, 60% of industrial enzymes on the market were proteases. In Europe, 900 tons of protease enzymes are used for detergents alone every year.

Today’s market size shows the global enzyme revenues for 2019 and projected for 2027. Microorganism-based enzymes comprised the vast majority of the industrial enzyme market in 2019, about 85%, followed by animal-based and plant-based enzymes. Microorganisms are preferred as a source due to their more predictable and controllable enzyme content. This type of enzyme can also be produced in a cost-effective manner with less space and time necessary than animal-based or plant-based enzymes. There are three types of microorganism-based enzymes: bacterial, fungal, and yeast. Bacterial enzymes are mostly sourced from Bacillus. They’re used in food and detergent and in pharmaceutical applications to diagnose diseases, promote wound healing, and kill disease-causing microorganisms. Fungal enzymes are used in the preparation and production of soy sauce, beer, baked goods, processed fruits, and dairy products. Yeast is used in beer, baked goods, and industrial ethanol production.

Increased investment in biotechnology research for the development of specialty enzymes for medicinal and diagnostic purposes is one of the main factors driving product demand globally. Increasing demand from the food and beverage, biofuel, animal feed, and home cleaning sectors along with the growing consumption of functional foods will contribute to the growth in the market through 2027. By region, growing biofuel production in North America and Europe, as well as increasing meat production in Europe and the Russian Federation, are expected to contribute to growth in these regions. Enzymes are used extensively in meat processing to improve the tenderness of the meat. Europe was third behind China and North America in meat production in 2018. The top three companies in this industry—Novozymes, DuPont Danisco, and DSM— claimed more than 75% of the market in 2019.1 Other major companies in this industry include BASF SE, Associated British Foods PLC, Chr. Hansen Holding A/S, and Advanced Enzyme Technologies.

1 Source: Grand View Research. The press release from CISION PR Newswire mentioning the same Grand View Research report states that the top 3 companies are Novozymes, DuPont Danisco, and BASF SE.

Petroleum Product Imports from Egypt

Petroleum from Egypt

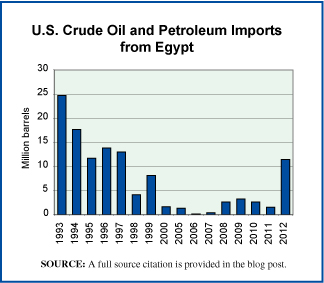
The graph to the right shows crude oil and petroleum product imports to the United States from Egypt, from 1993 through 2012. The trade in petroleum products is one that is strongly influenced by geopolitical concerns. The rise in imports from Egypt into the United States in 2012 may well be seen, at least in part, as an attempt by the United States to help stabilize that country after its revolution of 2011.

Egypt’s domestic consumption of its fuel has been rising steadily for decades as its population increased rapidly. Consequently, its exports of petroleum products (from crude oil to fuel ethanol) declined. However, when one of its major industries, tourism, was devastated by the upheavals of 2011 and continued political unrest in wake of the revolution, Egypt has been forced to increase exports in other areas as much as possible in order to meet its foreign currency debt payment obligations.

Today’s market size is the number of barrels of crude oil and petroleum products imported by the United States from Egypt, in 2012.

Geographic reference: United States and Egypt
Year: 2012
Market size: 11.44 million barrels, or 0.29% of all such imports into the United States that year.
Source: “U.S. Imports by Country of Origin,” a detailed statistical presentation on “Petroleum & Other Liquids,” dated March 15, 2013, published by the U.S. Energy Information Administration. The table is available online here.
Original source: U.S. Energy Information Administration
Posted on April 18, 2013

Fossil Fuel Subsidies

Since the turn of the century the price of crude oil has risen sharply, the result of increasing demand for a commodity whose supply cannot increase quickly enough to meet demand. The dynamics of the petroleum market are becoming more clearly those of a market for something with a finite supply. This may seem obvious since petroleum in the form of crude oil is a finite product but for the 130 years before 2000, oil markets did not follow this pattern. The oil market was more elastic, reacting more quickly to rising and falling demand. This is because during that first 130 years of the oil age, the more easily and inexpensively accessible oil was being extracted, making the market function more like that of a commodity with nearly endless supply. As we have entered a period in which global oil production has plateaued, despite rising demand, prices have risen sharply and they are likely to continue to rise as growing demand outpaces supply.

Today’s market size looks at the amount spent globally on fossil fuel consumption subsidies. These are defined by the International Energy Agency (IEA) as “any government action directed primarily at the energy sector that lowers the price paid by energy consumers.” According to the IEA, changes in international fuel prices are chiefly responsible for differences in subsidy costs from year to year. The 30% year-over-year increase in the amount spent on fossil fuel consumption subsidies in 2011 closely tracked the sharp rise in international fuel prices.

Geographic reference: World
Year: 2011
Market size: $523 billion
Source: John Parnell, “IEA: Fossil Fuel Subsidies Increased 30% in 2011,” Climate Home, December 11, 2012, available online here.
Original source: International Energy Agency (IEA)
Posted on January 17, 2013

Portable Generators

The recent hurricane that did so much damage along the northeastern coast of the United States has caused a spike in the sale of portable generators that convert fuel—gasoline, diesel, natural gas, propane, etc.—into electric power. These systems are often referred to as Gensets and two of the leading manufacturers of such systems are Cummins and Caterpillar. Today’s market size is the value of the portable generator market worldwide in 2011 and the forecasted value by 2020.

Geographic reference: World
Year: 2011 and 2020
Market size: $12 billion and $22.3 billion respectively
Source: “Research and Markets: Diesel and Gas Generator, 2012 – Global Market Size, Segmentation and Equipment Market Share to 2020,” BusinessWire, August 30, 2012, available online here.
Original source: GlobalData
Posted on November 12, 2012

Solar Panels

On May 17, 2012, the U.S. Commerce Department announced the imposition of antidumping tariffs on solar panels imported to the United States from several Chinese companies. China exports 95% of the solar panels it makes worldwide. In the United States, Chinese-made solar cell imports more than doubled between 2010 and 2011 while the wholesale price of solar cells in the United States continued a multi-year fall. The price of solar panels is based on their electrical capacity. In 2008, the average price per watt of capacity was $3.30 and in January 2012 that price had fallen to $1.20. The lower prices have fueled the market and led to quickly rising installations but they have also crippled the domestic panel manufacturing industry. Therefore, the new tariffs are welcomed by one part of the industry—manufacturers—and disliked by another—installers.

Today’s market size is the value of solar cells imported to the United States from China in 2011.

Geographic reference: United States
Year: 2011
Market size: $3.1 billion
Source: Keith Bradsher and Diane Cardwell, “Chinese Solar Panels Face Big Tariffs,” New York Times, May 18, 2012, page B1, available online here. Also from Keith Bradsher, “U.S. Solar Panel Makers Say China Violated Trade Rules,” New York Times, October 19, 2011, available here.
Original source: U.S. Department of Commerce
Posted on May 22, 2012

Woody Biomass

As fuel prices rise, demand for alternative energy sources naturally grows. One such alternative energy for those burning fossil fuels in an industrial application is to burn woody biomass instead. Not surprisingly, pulp and paper manufacturers—many of whom are vertically integrated and thus own their primary input material, wood—around the world are using more woody biomass to fuel their own industrial applications.

Today’s market size is the volume of woody biomass—bark, sawdust, wood chips, forest residues and the like—used by the pulp and paper industry globally in 2009.

Geographic reference: World
Year: 2009
Market size: 1,400 trillion British Thermal Units which is roughly equal to 75 million oven dried metric tons.
Source: “Biomass Market Update – 4Q/2009,” Wood Resource Quarterly – 4Q/2009, page 10, available online here.
Original source: Wood Resources International
Posted on October 3, 2011

Minerals in Wyoming

Taxable value of WY minerals

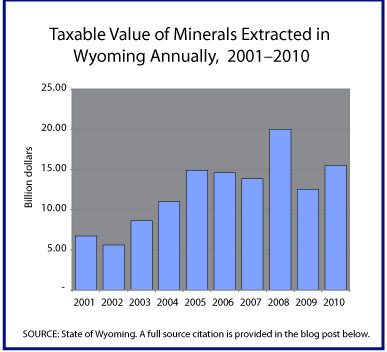
Mining and extraction industries in Wyoming saw a significant decline in 2009 after peaking in 2008 for the decade but 2010 saw a strong recovery over 2009. The graph shows taxable value for all minerals extracted annually in Wyoming from 2001 through 2010. Wyoming’s mineral wealth is providing the state with a strong base for recovery from the recession that began in December 2007.

Today’s market size is the total value of all minerals extracted in 2010. The minerals included in this total are oil, natural gas, coal, bentonite, trona, uranium, sand and gravel.

Geographic reference: United States
Year: 2001 and 2010
Market size: $6.74 and $15.49 billion respectively
Source: Barron, Joan, “State’s Mineral Valuation Booms,” Casper Star Tribune, June 1, 2011, page 1.
Original source: State of Wyoming

Crude Oil Supply

Based on a report recently issued by the U.S. Energy Information Administration, the supply of crude oil for U.S. energy needs, from all sources, is anticipated to decline between 2009 and 2025. On a per capita basis this decline is rather large, 15.3%. This is because the population is projected to increase by 16.4% between 2009 and 2025 while the supply of crude oil is forecast to decline by 1.39%. Obviously, new sources of petroleum supply will be (are) in high demand, not to mention all other forms of energy.

Today’s market size is the daily supply in millions of barrels per day (mbpd) of crude oil in the United States, for 2009 and projected for 2025.

Geographic reference: United States
Year: 2009 and 2025
Market size: In 2009, 14.33 mbpd and in 2025, 14.13 mbpd
Source: “Table C4. Liquid Fuel Supply and Disposition,” Annual Energy Outlook 2011, With Projections to 2035, April 2011, page 175, available online here.
Original source: U.S. Department of Energy, Energy Information Administration

“Other” Renewables

In yesterday’s market size post we looked at nonhydropower renewable sources of electricity. These renewables are usually broken into four categories: wind, geothermal, solar and other. So, what does this “other” include? This category covers a wide range of methods for generating electricity and what follows is only a partial list of them: waste incineration, wood burning, connecting exercise bicycles in gyms to capture the kinetic energy they generate during spinning classes, and the harnessing of elephants and/or oxen to a grinding wheel used to turn a series of interlocking turbines. While each of these methods represent a small fraction of all electric production, together they accounted for 6.8% of renewable electricity generation in 2007.

For a thorough discussion of these many methods of generating electricity, and statistics for their prevelance in the United States, the LaMarotte blog has a wonderful post on the topic, available here.

Geographic reference: World
Year: 2007
Market size: 235 billion kilowatt hours
Source: “Table 12. OECD and Non-OECD Net Renewable Electricity Generation by Energy Source, 2007-2035,” International Energy Outlook 2010, report available online here.
Original source: U.S. Energy Information Administration (EIA)
Happy April Fools Day!

Electricity from Renewables

Renewable Energy Sources Worldwide

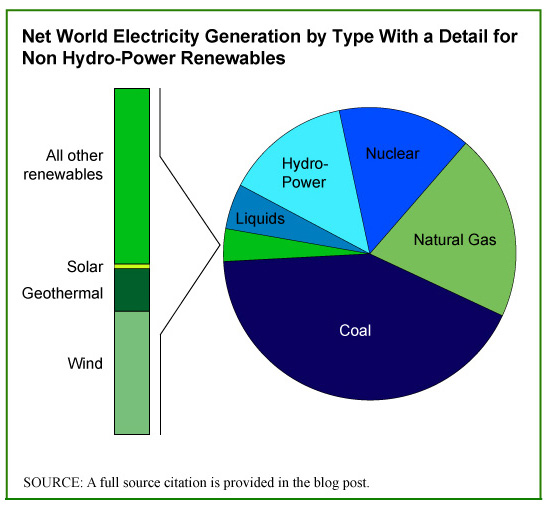
Hydroelectric power plants are the largest producers of electricity from renewable sources. As we saw in yesterday’s Market Size post, they represented 15.97% of world electricity production in 2008. That same year, electricity produced by all other renewable sources accounted for 2.4% of electricity generated. While responsible for only a small percentage of all electricity generation now, renewable sources are forecast to grow steadily through 2035 at which point the nonhydropower portion will account for 7.26% of global production.

The pie chart shows how electricity is generated worldwide and provides a detail of the small pie slice that represents nonhydropower renewables. The renewable energy source that is forecast to grow most quickly in the next decade is solar.

Please note that the Energy Information Administration (EIA) projections exclude electricity generated by so-called off-grid sources, thus renewable energy consumed at the site of production. Energy produced by solar panels installed, for example, on a private home for the sole and exclusive use of the residents of that home is not counted in the EIA projections. If, however, those solar panels are tied into the public electric grid, then the electricity they generate is accounted for in the EIA projections. Time will tell how significant these off-grid electricity generation resources become.

Geographic reference: World
Year: 2007 and 2035
Market size: 463 and 2,554 billion kilowatt hours respectively (please note this is the size of electicity generation from nonhydropower renewable sources)
Source: “Table 12. OECD and Non-OECD Net Renewable Electricity Generation by Energy Source, 2007-2035,” International Energy Outlook 2010, report available online here.
Original source: U.S. Energy Information Administration (EIA)

Hydroelectric Power

The production of electricity with hydroelectric power plants represents 80% of all renewable electric power generation worldwide. Hydro plants work by using the flow of water to turn a turbine, which then turns a metal shaft in an electric generator, which is the motor that produces electricity. Hydroelectric power plants accounted for 15.97% of all electric power produced worldwide in 2008.

In the United States, 6% of electricity is generated in hydro plants, a relatively small percentage compared with other nations. The ability to use hydroelectric power plants to generate electricity is, of course, to a large extent a matter of having the resources needed to harness water’s power. Paraguay, for example, produces 100% of its electricity—as well as electricity enough to export—from hydroelectric power plants while Saudi Arabia has no hydroelectric power generation. A chart which shows the top twenty countries in the world based on their production of hydropower and based on the same source material is presented on the blog, LaMarotte, here.

Geographic reference: World
Year: 2008
Market size: 2,998 Billion Kilowatt hours
Source: “Table 1387. Net Electricity Generation by Type and Country: 2008,” Statistical Abstract of the United States: 2011, page 867, available online here.
Original source: U.S. Energy Information Administration (EIA)

Nuclear Power Plants

Energy Pie Chart

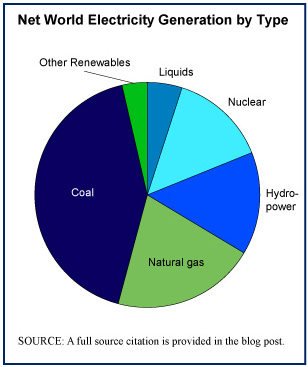
Electricity is generated in a variety of ways which are broken down into the six categories presented in the pie chart to the right. Each method of generating electricity has its pros and cons, its costs, risks, benefits, and advantage, all of which are much debated as we grapple with how best to produce electricity for a world whose demand for it grows annually. And growth in consumption is likely to speed up with the transition from the internal combustion engine to electric-powered vehicles (no pun intended).

Nuclear power plants accounted for 13.8% of global electricity generation in 2008. Nations who use nuclear power generation for the largest percentages of their electricity needs include France (78%), Belgium (55.8%), and Ukraine (47.1%). To see a nice chart of the top twenty leading nuclear power dependent nations, visit the LaMarotte blog, here.

Worth noting is the fact that Japan is among the twenty nations who depend most on nuclear power to generate its electricity. It comes in 10th on that list with 23.7% of its electricity generated at nuclear power plants in 2008.

Geographic reference: World
Year: 2008
Market size: 2,590 billion kilowatt hours
Source: “Table 1387. Net Electricity Generation by Type and Country: 2008,” Statistical Abstract of the United States: 2011, page 867, available online here. The data used to make the pie chart are for 2008 and come from the EIA’s International Energy Outlook 2010, available online here.
Original source: U.S. Energy Information Administration (EIA)

Electric Power Generation

By way of noting this year’s “Earth Hour” (May 26, 2011)—as well as the ongoing challenges being faced by the Japanese as they struggle to get a damaged nuclear power plant stabilized—this week our market size items will all be related to electric energy markets.

We are voracious consumers of electricity, particularly in the industrialized world where even many toothbrushes plug into an electric outlet. Today’s market size is the size of the world’s capacity for generating electricity. Tomorrow we’ll start breaking this down by how the electric power is generated, with coal, hydroelectric dam, nuclear plant, solar panels, etc.

Geographic reference: World
Year: 2008
Market size: 18,778.7 billion kilowatt hours
Source: “Table 1387. Net Electricity Generation by Type and Country: 2008,” Statistical Abstract of the United States: 2011, page 867, available online here.
Original source: U.S. Energy Information Administration

Coal Mining Industry

The United States has the largest proven coal reserves in the world. The market size presented here is based on employment within the U.S. coal mining industry.

Geographic reference: United States
Year: 2009
Market size: 87,755 people
Source: “Annual Coal Report, 2009,” October 1, 2010.
Original source: Energy Information Administration, U.S. Department of Energy

Hydroelectric Power Market

Over the period 2002 to 2007, the cost of energy rose steadily, as did the revenues generated by those companies in the business of extracting (in the case of fossil fuels), processing, moving, storing, and selling energy. For that reason, it is surprising to see that hydroelectric power generation in the United States actually saw a decline in revenues, as well as employment over the period. In 2002 the hydroelectric power generation industry employed 6,360 people and in 2007 it employed only 3,795.

Geographic reference: United States
Year: 2002 and 2007
Market size: $2.73 billion and $2.24 billion respectively
Source: “2007 Economic Census: Sector 22: Utilities: Preliminary Comparative Statistics for the United States 2007 and 2002,” July 31, 2009, available online here.
Original source: U.S. Bureau of the Census

Petroleum Products

This market size covers petroleum product production and is based on wholesale prices. It can be broken into five product categories, each listed here with its respective share of the market as a percentage, in parentheses: gasoline (51.23%); light fuel oils (32.97%); jet fuel (11.20%); heavy fuel oils (4.14%); and kerosene, excluding jet fuel (0.46%).

Geographic reference: United States
Year: 2008
Market size: $678.1 billion
Source: Annual Survey of Manufactures, 2008, March 30, 2010 available online here.
Original source: U.S. Bureau of the Census

Size of the Market for Soy-Based Chemicals

Soy-based chemicals are used in the following industries: biodiesel (61%), foods and beverages (16%), plastics (10%) and all others (13%). The success of the soy chemicals industry is dependent on the continued penetration of biodiesel, as well as the adoption of alternatives to traditional, petrochemical-based materials in the manufacture of industrial products. Methyl soyate is by far the most established soy chemical due to its current dominance of the biodiesel market, although it will begin to face competition from other raw materials. Methyl soyate is also finding greater use as a solvent in a variety of markets, including cleaning products as well as paints and coatings. Other soy oil derivatives, such as polyols, will benefit from corporate initiatives to use more renewable feedstocks, as well as from consumer demands for “greener” products, particularly in the plastics (e.g., foam products) and paint and coatings markets.

Geographic reference: United States
Year: 2008
Market size: $1.9 billion
Source: Soy Chemicals, September 2009 available online here.
Original source: Freedonia Group

Market for Chemicals Used in Oil Drilling

Many specially designed chemicals are used in drilling for and extracting oil. These include what are called stimulation chemicals (35%), drilling fluids (34%), production chemicals (12%) and all others (19%).

Geographic reference: United States
Year: 2008
Market size: $8.6 billion
Source: Oilfield Chemicals, September 2009 available online here.
Original source: Freedonia Group