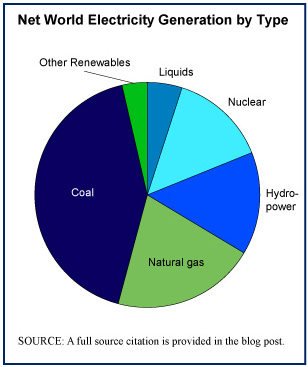
Electricity is generated in a variety of ways which are broken down into the six categories presented in the pie chart to the right. Each method of generating electricity has its pros and cons, its costs, risks, benefits, and advantage, all of which are much debated as we grapple with how best to produce electricity for a world whose demand for it grows annually. And growth in consumption is likely to speed up with the transition from the internal combustion engine to electric-powered vehicles (no pun intended).
Nuclear power plants accounted for 13.8% of global electricity generation in 2008. Nations who use nuclear power generation for the largest percentages of their electricity needs include France (78%), Belgium (55.8%), and Ukraine (47.1%). To see a nice chart of the top twenty leading nuclear power dependent nations, visit the LaMarotte blog, here.
Worth noting is the fact that Japan is among the twenty nations who depend most on nuclear power to generate its electricity. It comes in 10th on that list with 23.7% of its electricity generated at nuclear power plants in 2008.
Geographic reference: World
Year: 2008
Market size: 2,590 billion kilowatt hours
Source: “Table 1387. Net Electricity Generation by Type and Country: 2008,” Statistical Abstract of the United States: 2011, page 867, available online here. The data used to make the pie chart are for 2008 and come from the EIA’s International Energy Outlook 2010, available online here.
Original source: U.S. Energy Information Administration (EIA)

