Podcasts

A podcast is an episodic audio program made available in digital format for downloading or streaming over the internet. The word podcast itself is an amalgamation of the “pod” in iPod and the “cast” in broadcast. Podcasts were first offered on Apple iTunes, for download on an iPod, in 2004. Then, more than 3,000 free podcasts were offered. The number of choices has grown considerably and continues to grow due to the low cost of entry into the medium. In the first 10 months of 2019 alone, 192,000 podcasts were launched. Today’s market size shows the number of podcasts worldwide in January 2020 and the number of episodes available for download.1 Podcast content can be heard in 155 countries and in more than 100 languages.

Along with the number of choices, the percentage of the U.S. population that is familiar with podcasting rose from 22% in 2006 to 70% in 2019.2 According to Edison Research and Triton Digital, 2019 was the first year that a majority of the U.S. population, 51% or an estimated 144 million people, reported ever listening to a podcast. Monthly listeners totaled 90 million while weekly listeners amounted to 62 million, or 22% of the population. This is more than triple the 7% of weekly listeners reported in 2013.3

Why do people listen to podcasts? Top reasons include: to learn new things, to be entertained, and to stay up-to-date with the latest topics. But many forms of media allow a person to do those things. Why podcasts? Listeners report that they like that they can do other things while listening, podcasts are portable, and they can listen wherever they are.

The potential of earning money from advertising motivates many to develop a podcast. Podcast advertising revenue in 2019 was expected to reach $679 million and is projected to climb to $863 million in 2020 and more than $1 billion in 2021. Popular podcasts charge between $10 and $50 for every thousand listeners, which is two or three times more expensive than the rate for broadcast radio. Do podcast advertisements work? Fifty-four percent of listeners surveyed reported that they were more likely or much more likely to consider brands advertised on podcasts. Only 7% of listeners reported that they were less likely or much less likely to consider brands advertised on that platform. The other 39% were neutral. Some large, well-known companies sponsor podcasts; others are producing their own.

Some podcasting apps and media companies such as Stitcher Premium, Luminary, and Slate Plus (affiliated with Slate Magazine) offer a small number of podcasts and exclusive content for a monthly fee. Heavy podcast users, those that listen 6 or more hours a week, and new listeners are more likely to pay for content.

Top podcast publishers by number of unique listeners in the United States for January 2020 include NPR (23.7 million unique listeners), iHeartRadio (21.9 million), Wondery (10.2 million), PRX (9.32 million), and The New York Times (9.26 million). Top podcasts: The Daily (published by The New York Times), NPR News Now (NPR), Up First (NPR), Stuff You Should Know (iHeartRadio), and The Ben Shapiro Show (Daily Wire). The most popular apps for downloading and streaming podcasts are Apple Podcasts, Spotify, Stitcher, SoundCloud and Google Podcasts.

1 The reported number of podcasts and episodes available vary by source. A November 2019 Forbes article noted: “There are now over 800,000 active podcasts with over 54 million podcast episodes currently available worldwide.”
2 U.S. population 12 years of age and older.
3 2013 was the first year for which there are data.

Geographic reference: World
Year: 2020
Market size: More than 850,000 (More than 30 million episodes)
Sources: Ross Winn, “2020 Podcast Stats & Facts (New Research from Jan 2020),” Podcast Insights, February 7, 2020 available online here; Brad Adgate, “Podcasting is Going Mainstream,” Forbes, November 18, 2019 available online here; Melissa Locker, “Apple’s Podcasts Just Topped 50 Billion All-Time Downloads and Streams,” Fast Company, April 25, 2018 available online here; The Infinite Dial 2019, Edison Research and Triton Digital, 2019 available online here; Brad Hill, “Edison/Triton: ‘Consequential Year’ for Podcasting in New Podcast Consumer Report,” Kurt Hanson’s Radio & Internet News, April 11, 2019 available online here; “Top Publishers,” Podtrac available online here; “Top Podcasts,” Podtrac available online here; Mia Breunissen, “27 Most Popular Podcast Apps,” We Edit Podcasts, June 19, 2019 available online here.
Image source: Jonathan Farber, “Podcasting Setup With Headphones, Desk and Professional Microphone,” Unsplash, September 4, 2019 available online here.

Video on Demand

video on demand streaming
Video on demand is a method of media distribution in which viewers can access a provider’s library of video content with or without a television set and without the constraints of a static broadcasting schedule as is the case with over-the-air programming. Video on demand can be offered through internet protocol television (IPTV) services or through over-the-top (OTT) media services. IPTV uses a dedicated, private network provided by an internet service provider to stream live television, pay-per-view, and video on demand content over the internet through a set-top box or “stick” device connected to a customer’s television or directly through an app on a smart TV that has wi-fi capabilities. IPTV content can also be viewed using apps on tablets and smartphones and on computers through a web browser or through video applications that can play M3U8 files. As of April 2019, there were an estimated 100 million IPTV subscribers worldwide.

While there are many legal IPTV providers such as Sling TV, Xfinity Flex, DirecTV Now, AT&T U-verse and Zattoo, to name a few, there are also many companies that provide content they are not licensed to sell. According to a 2017 Sandvine Intelligent Broadband Networks study, 6.5% of North American households have accessed a pirated IPTV service. Pirated IPTV services were valued at $840 million per year while traditional content providers lost $4.2 billion per year due to copyright infringement. In recent years, content providers have filed lawsuits against IPTV providers that transmit unauthorized content. In 2019, Set TV NOW, with more than 180,000 subscribers, was the first major IPTV provider to shut down. The judge ordered the company to pay DISH Network Corp. more than $90 million in damages. In November 2019, police raids in Spain, Italy, the Netherlands, France, and Bulgaria shut down Xstream-codes.com, a company that provided the software that ran many IPTV systems. Its 5,000 clients, IPTV providers, served more than 50 million customers around the world. In 2020, more lawsuits against these types of companies are expected in the United States and around the world. Lawsuits against companies that make the services possible such as website hosting companies, file hosting companies, and companies that process the payments are also expected.

OTT services use the open internet to stream their video on demand content. A customer’s internet service provider treats data packets for streamed content the same as data packets for any other content sent over the internet. As a result, the quality of the viewing experience depends on the speed and quality of the customer’s internet connection. Customers need either a set-top box, “stick” device, multipurpose device like a game console that can stream video content, or a wi-fi enabled smart TV to view content on their television sets. OTT content can also be viewed on computers, tablets, and smartphones.

There are three types of OTT services: advertising-based (AVOD), transaction-based (TVOD), and subscription-based (SVOD). Advertising-based services are free to use, but customers must watch commercials like they do when they watch over-the-air, cable or satellite TV. YouTube and DailyMotion are examples of AVOD services. Transaction-based services allow users to sign up for the service for free and then the amount they pay is dependent on the content they watch. iTunes is an example of a TVOD service. Subscription-based video on demand services may be the best-known type of OTT. A user pays a monthly or yearly fee to stream an unlimited amount of video content. Netflix and Hulu are two examples of subscription-based OTT services.

Today’s market size shows the total global revenues for video on demand services for 2019 and projected for 2024. OTT services have the highest market share with subscription-based service revenue expected to grow at the highest compound annual growth rate (CAGR) over this time period. Overall, the global video on demand market is expected to grow at a CAGR of 17.5%. According to analysts, growth in this industry will be due to increasing broadband internet access globally, including access to 4G and 5G technologies, and the increasing popularity of smartphones. Services that offer a large variety of content in different genres and languages will also contribute to growth in this industry. North America is expected to account for 40% of the revenue between 2019 and 2024, with the Asia-Pacific region claiming 30%, Europe 20%, Latin America 5% and the Middle East and Africa 5%. Leading companies include Netflix, Amazon, Google, YouTube, Apple, Roku, Vudu, Hulu, Huawei, and Fujitsu among others. In the Asia-Pacific region the following companies are expected to capture most of the market share: YouTube, iQiyi, Tencent Video, Youku, ByteDance, Netflix, Amazon, Hotstar, and Hulu Japan.

Geographic reference: World
Year: 2019 and 2024
Market size: $38.4 billion and $87.1 billion, respectively
Sources: The Video on Demand (VoD) Market Size is Expected to Grow from USD 38.9 Billion in 2019 to USD 87.1 Billion by 2024, at a Compound Annual Growth Rate (CAGR) of 17.5%,” CISION PRNewswire Press Release, January 28, 2020 available online here; “2017 Global Internet Phenomena,” Sandvine Intelligent Broadband Networks, October 27, 2017 available online here; “What is IPTV? Everything Cord Cutters Need to Know,” AntennaJunkies.com available online here; Luke Bouma, “IPTV Came Under Fire in 2019 & in 2020 It Maybe All Out War,” Cord Cutters News, January 1, 2020 available online here; Luke Bouma, “Dish Officially Announces Legal Action Against Two IPTV Services,” Cord Cutters News, January 19, 2018 available online here; Ali Ahmed Awan, “Understanding the Terms SVOD, AVOD, TVOD and the Difference Between VOD and OTT,” ClipBucket, March 7, 2019 available online here; Dan Price, “The Best Legal IPTV Service Providers in 2019,” MakeUseOf, December 4, 2019 available online here;
Image source: Glenn Carstens-Peters, Unsplash, June 10, 2019 available online here.

Information Sector

Info. SectorToday we’re looking at one sector of the U.S. economy, the Information Sector. This sector includes industries such as publishing, movie making, telecommunications, broadcasting, data processing, web hosting and all sorts of Internet activities associated with the dissemination of information. The sector is identified in the North American Industrial Coding System (NAICS) as sector 51 and includes the activities of 78 industries.

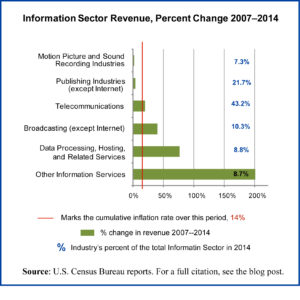
Total revenue for this sector grew by 26% from 2007 to 2014, making it one of the better-performing sectors within the larger Service Sector. Yet a closer look at the main groups in the Information Sector shows that their paths vary greatly over this period. The broadcasting industries and those related to the Internet saw real growth while the others saw little if any growth, considering that the cumulative inflation rate over this period was 14%.

The chart above shows the growth each of the industrial sectors within the Information Sector has had over the period at which we’re looking and includes a red line showing the cumulative rate of inflation over the period. Real growth only happened in the industries whose growth rate exceeded the cumulative rate of inflation.

Geographic reference: United States
Year: 2007 and 2014
Market size: $1.08 and $1.37 trillion respectively
Source: “Table 1: Estimated Revenue for Employer and Nonemployer Firms: 2007 through 2014,” 2014 Services Annual Survey, U.S. Census Bureau, January 28, 2016, available online here.
Original source: U.S. Department of Commerce, Bureau of the Census
Posted on May 24, 2016

Expenditures on Reading Materials

The U.S. Bureau of Labor Statistics (BLS) carries out an annual survey of millions of households to track what they spend money on, by category. The resulting data has been collected over decades and seeing the trends that these data expose over time is very interesting.

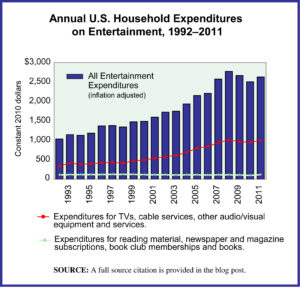
The graph presented here is made with BLS data from this survey series. It shows inflation-adjusted household expenditures on all categories of entertainment, as well as two subsets of expenditures, (1) those for TVs, audio/video equipment and services, such as cable subscriptions and (2) expenditures for reading material. The full category of entertainment expenditures is broad and includes things such as:

—Fees to attend concerts, sporting events, movies, and sporting clubs/fraternal organizations.
—TVs, radios and other audio/video equipment as well as subscriptions for cable, premium TV and the like.
—Pets, toys and hobbies, as well as all the services and equipment related to those.
—Bikes, athletic shoes, and equipment for camping, exercising, fishing, and all sports, as well as boats and docking fees, fireworks, pinball machines and video consoles.

Today’s market size is the average spent by U.S. households on reading material in 1994 and in 2011. The figures do not include expenditures for any textbooks or reading material purchased as part of a formal educational program. The transition to digital which is taking place in most areas of publishing is not well tracked by this BLS survey series. It is unclear from studying the survey results, for example, whether or not all online subscriptions to newspapers and magazines are consistently captured in the expenditure category “Reading.” Over time this will change as time allows data collection organizations, like the BLS, to adjust to the digital transition. Data collection organizations can only adjust as quickly as the industries they cover—in this case, the publishing industry—adjust to such dramatic changes.

Geographic reference: United States
Year: 1994 and 2011
Market size: $165 and $115 respectively. These figures translate to a national gross household spending on reading materials for each of those years of $16.86 billion and $14.06 billion respectively
Source: “Consumer Expenditure Survey,” Multiyear Tables: 1992-99 Multiyear Table, 2000-05 Multiyear Table, and 2006-11 Multiyear Table, all available on the Bureau of Labor Statistics website here.
Original source: U.S. Department of Labor, Bureau of Labor Statistics, Consumer Expenditure Surveys
Posted on May 9, 2013

Cable and Premium TV Market

Cable TV revenues

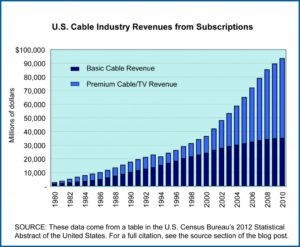
Economic data show that most industries in the United States saw declines of some sort during the recent recession and accompanying financial crisis of 2007—2009. One industry which appears to have weathered the downturn without noticeable declines is the pay television broadcasting industry. It is true that the growth they’ve seen may have been larger were it not for the economic downturn. Nonetheless, based on overall revenue, the industry’s growth trajectory has shown not a blip as can be seen in the chart.

Today’s market size post is based on industry revenues for cable services from basic and premium broadcasting as well as installation services and high-speed Internet access through cable lines.

Geographic reference: United States
Year: 2000 and 2010
Market size: $36.43 and 93.37 billion respectively
Source: “Table 1142. Cable and Premium TV—Summary: 1975 to 2010,” 2012 Statistical Abstract of the United States, December 2011, U.S. Census Bureau, page 717, available online here.
Original source: SNL Kagan, a division of SNL Financial L.C.
Posted on March 12, 2012

Cable Programming & Distribution

The U.S. economy is divided into large categories for the purpose of tracking economic activity and the “Information” sector of the economy is where such things as publishing, broadcasting and telecommunications reside. The rise of the digital age is having a major impact on the activities of this sector but for some, it is a very positive impact while for others the transition is more challenging. The cable business is one of the industries in this sector that is seeing robust growth in revenue and over the last five years has shown no sign of slowdown despite the recession and subsequent financial crisis of 2007-2009.

Today’s market size is the size of the U.S. cable program distribution and subscription programming industry in 2005 and 2010. These industries are designated with the following NAICS codes: 5152 (Cable and other subscription programming) and 5175 (Cable and other program distribution).

Geographic reference: United States
Year: 2005 and 2010
Market size: $117.1 and $176.5 billion respectively
Source: “Table 3.0.1 Information Sector (NAICS 51)—Estimated Revenue for Employer Firms: 2005 through 2010,” Service Annual Survey, February 2, 2012, available online here.
Posted on February 27, 2012

Ham Radio Operators

Amateur radio, also known as ham radio, uses a designated “radio frequency spectrum for purposes of private recreation, non-commercial exchange of messages, wireless experimentation, self-training, and emergency communication,” according to Wikipedia. Ham radio operations are coordinated by the International Telecommunication Union. Ham radio operators must demonstrate knowledge in electronics and regulations in order to obtain a license for their radio station. Once licensed, the ham radio operator can communicate with people throughout the world.

Amateur radio began in the late 19th Century. By the late 20th Century, the hobby’s
popularity was waning; however, in the early 21st Century, ham radio saw a surge in the number of enthusiasts. By 2010, the number of ham radio licenses in the United States had increased 60 percent since 1981. In 2007, the United States Federal Communications Commission stopped requiring knowledge of Morse Code in order to obtain a license. The increase in ham radio licenses has been attributed to this. In 2010 alone, there were 30,000 new applications for ham radio licenses.

Today’s market size is the total number of people that have ham radio licenses in the United States.

Geographic reference: United States
Year: 2010
Market Size: 700,000
Source: Matt Sepic, “Ham Radio Growing in the Age of Twitter,” NPR, April 5, 2010, available online here and “Amateur Radio,” Wikipedia, available online here.
Posted on December 9, 2011

BBC Funding

As a bit of a tip-of-the-hat to the royal wedding being celebrated today, we look at the company that will no doubt lead the rest in covering this event, the British Broadcasting Corporation, known around the world as the BBC. Today’s market size is the estimated total value of the annual licensing fee which is levied on every U.K. household that has a television set. This fee was established under law in 1922 and although controversial today, remains in place. The sum collected makes up approximately 80 percent of the BBC’s annual budget.

Geographic reference: United Kingdom
Year: 2010
Market size: £3.6 billion (approximately $5.6 billion based on the exchange rate at the end of 2010)
Source: Lyall, Sarah and Eric Pfanner, “The Beeb Is Struggling to Tighten Its Belt,” The New York Times, April 24, 2011, page B1.
Original source: BBC