Marinas

Those offering services to boaters by operating docking and/or storage facilities for pleasure craft owners are Marinas. Some marinas offer additional services such as repair and maintenance services as well as retailing of fuel and marine supplies. The states within the United States with the largest marina industries, in order, are Florida, New York, California, Michigan and Massachusetts.

Today’s market size is the estimated revenues from all marinas in the United States in 2009.

Geographic reference: United States
Year: 2009
Market size: $3.3 billion
Source: “Table 9.1. Arts, Entertainment, and Recreation Services (NAICS 71) — Estimated Revenue for Employer Firms: 2001 Through 2009,” Service Annual Survey: 2010. The report on NAICS Sector 71 is available online here.
Original source: U.S. Census Bureau
Posted on September 9, 2011

Retail Shrinkage

Retail shrinkage is the loss suffered by retailers as a result of shoplifting by customers and/or employees, supplier fraud and inventory miscounts. Those in the field of security work may see the size of retail shrinkage as a sort of market size, the maximum amount that could be saved for a retailer if deterrent measures were taken to eliminate all such losses.

Today’s market size is the estimated value of all retail shrinkage in the United States in 2010.

Geographic reference: United States
Year: 2010
Market size: $37.1 billion
Source: Andrew Allentuck, “Security Cameras, Detection is Also Deterrence,” The Costco Connection, September 2011, page 21.
Original source: National Association for Shoplifting Prevention
Posted on September 8, 2011

Paper Clips

Paper Clip

Many attempts have been made over the years to improve upon the design of the paper clip. So far it has proven very difficult to design something that works better and can be made more economically than the ubiquitous twist of wire we know as the standard paper clip.

It may come as a surprise to many to find out that most paper clips sold in the United States are still also made in the United States. Import tariffs, which have been in place on paper clips since 1994, have helped to keep a robust domestic manufacturing business alive and well bucking the trend towards off-shoring so prominent since the late 1990s.

The number of paper clips sold in the United States annually is high and makes one wonder, what do we do with all those paper clips, particularly in the “paperless society”? According to the source and a quick survey of our offices, here’s a list of uses, other than holding papers together, to which we put paper clips: hanging Christmas ornaments; restarting electronic devices that have tiny little restart buttons; cleaning our fingernails/ears (with apologies); linking them into a chain while chatting on the phone, and temporarily holding up a ripped hem.

Today’s market size is an industry estimate of the number of paper clips sold annually in the United States.

Geographic reference: United States
Year: 2010
Market size: 11 billion clips
Source: James R. Hagerty, “Mousetraps, Maybe, but Can You Build a Better Paper Clip?” The Wall Street Journal, online edition of August 29, 2011, available here.
Posted on September 7, 2011

MHealth

The term “mHealth” is one being used to help define a category of medical services and devices and a growing part of the healthcare industry. It stands most simply for mobile health care, more fully “emerging mobile communications and network technology for healthcare.”

This market encompasses the use of mobile technology in the service of providing health care. It includes all those applications which combine body sensors with mobile or static devices designed to monitor a patient’s vital signs or some specific bodily function. The infrastructure behind these devices is also part of the category. An example of such a device is an electrode patch which may be worn by a patient and automatically sends the monitoring center information about the patient while he or she is on-the-go. The information is sent by a tiny radio transmitter built into the epidermal electronic device.

Today’s market size is the estimated size of the market for mHealth products in 2010 and a forecast for the size in 2014. Please note, however, that this market has yet to be well defined and as a result various research firms have come up with widely disparate projections of its size. The source listed below provides a link to an article explaining this problem more fully, titled “mHealth predictions: $1.9B, $4.4B, $4.6B?” Defining the market is key!

Geographic reference: United States
Year: 2010 and a forecast for 2014
Market size: $1.5 and $4.6 billion respectively
Source: “Market Size Projections for mHealth and Wireless Health,” Wireless Health Strategies, March 19, 2010, available online here.
Original source: CSMG, a division of TMBG Global
Posted on September 06, 2011

Auto Sales in August

The business pages of major papers all over the United States today are reporting on U.S. auto and light truck sales in August 2011. What is interesting is the fact that based on a commonly used reporting technique—namely to compare sales in one month with the sales in that month one year earlier—sales in August 2011 look very good. They were 7.5% more than sales of autos and light trucks in August 2010 and 1.2% greater than sales in July 2011. The trend is definitely positive.

However, in times of sudden economic slowdown, or times of recovery after a precipitous decline these sorts of comparisons can be misleading. Daniel Gross put this situation very colorfully in a 2010 Slate article on the auto industry, saying “comparing August 2010 to August 2009 is a little like comparing today’s home run totals to those racked up in seasons when the sluggers were on steroids and the ball was juiced.” Worth noting is the fact that U.S. auto sales averaged 16 million units annually between 2000 and 2007. Based on sales through August of 2011, annual sales are estimated to reach 12.5 million for the year. The industry has been changed greatly by the last recession.

Geographic reference: United States
Year: August 2011
Market size: 1.07 million automobiles and light trucks
Source: Nick Bunkley, “Car Buyers Unfazed by Storms, Financial and Tropical, in August,” The New York Times, September 2, 2011, page B1, and Daniel Gross, “A Successful Turn,” Slate, September 2, 2010, available online here.
Original source: MotorIntelligence.com
Posted on August 9, 2011

Higher Education Publishing

Higher education publishing includes “multiplatform course learning systems and materials for college and university students and faculty.” From 2008 to 2010, net revenue in this area of publishing saw annual growth of 15.5% and 6.6%, respectively. This segment of the publishing world has long known that during times of economic slowdown many people try and make the best of a bad situation and go back to school. Data show the net revenue for 2010.

Geographic reference United States
Year: 2010
Market Size: $4.55 billion
Source: Association of American Publishers, “BookStats Publishing Categories Highlights,” 2011, available online here and Association of American Publishers, “BookStats and Publishing Industry Glossary,” 2011, available online here.
Original source: BookStats
Posted on September 1, 2011

K-12 School Publishing

K-12 school publishing includes a wide range of learning tools for students and teaching aids for teachers in both public and private schools. Unlike other publishing, revenue in this category is affected by federal and state government funding. After dropping 12.4% from 2008 to 2009, net revenue increased 7.1% from 2009 to 2010. Data show the net revenue in 2010.

Geographic reference: United States
Year: 2010
Market size: $5.51 billion
Source: The Association of American Publishers, “BookStats Publishing Categories Highlights,” 2011, available online here.
Original source: BookStats
Posted on August 31, 2011

Veterinary Services

A sleepy looking Katie the Beagle

The downturn in the U.S. economy has not spared many but there is always some variation in how such a sharp economic slowdown hits some industries versus others. Veterinarians are among those who often see their base business less impacted than others. While dealing with declining revenues in 2009, veterinary service providers saw a decline of only 0.6% between 2008 and 2009. Of the 27 5-digit NAICS (North American Industrial Classification System) industries in the professional services sector, the veterinary services industry was one of four that saw revenues decline by 0.6% or less between 2008 and 2009. Many other professional service providers saw revenues decline by 15% or more.

Today’s market share is based on the estimated revenues earned by veterinary service providers in the United States in 2009.

Geographic reference: United States
Year: 2009
Market size: $25.64 billion
Source: “Table 6.1. Professional, Scientific, and Technical Services (NAICS 54) – Estimated Revenue for Taxable Firms: 2001 Through 2009,” page 1 and 2 of an extract from Service Annual Survey: 2009, available online here.
Original source: U.S. Bureau of the Census
Posted on August 30, 2011

Dietary Supplements

There is a large market for dietary supplements in the United States. This market includes a wide variety of ingestible products designed to do things such as help you lose weight, increase sexual desire, increase muscle mass, reduce cholesterol, increase brain function, and others yet. Vitamins and multivitamins are part of this market but drugs that need and carry a Federal Drug Administration approval are not.

Geographic reference: United States
Year: 2005 and 2010
Market size: $21.3 and $28.1 billion respectively
Source: Natasha Singer, “Here’s to Your Health, So They Claim,” New York Times, Sunday Business, August 28, 2011, page 1, available online here.
Original source: Nutrition Business Journal

Compact Discs

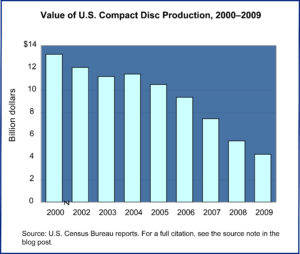
US Production of CDsCompact discs, or CDs, appeared on the recording media scene and rapidly became the standard, demand for them growing in leaps and bounds. But their position as market leader was a passing thing. As digital recording media they are still used but in ever smaller numbers, as the graphic shows. Part of the decline in production is the result of production going overseas. But a shift in how we record and store digital information is the primary cause for the decline of CDs.

Today’s market size is the value of U.S. manufacturer shipments of CDs in 2009. These values refer to blank CDs, to the storage media and not products later sold and distributed on that compact disc media.

Geographic reference: United States
Year: 2009
Market size: $4.27 billion
Source: “Table 1139. Recording Media—Manufacturers Shipments and Value: 2000 to 2009,” Statistical Abstract of the United States: 2011, January 20, 2011, page 716, available online here.
Original source: U.S. Census Bureau

Czech Cement

Cement production in the Czech Republic has shown signs of a recovery in the first half of 2011. Today’s market size is the estimated total production of cement in Czechoslovakia in 2011.

Geographic reference: Czech Republic
Year: 2011
Market size: 3.3 million metric tons
Source: “Production Rise is Not the End of Czech Tunnel,” Global Cement Weekly, August 24, 2011, page 2, available online here.
Original source: Jan Hrozek, Chairman of the Ceskomoravsky Cement Company
Posted on August 25, 2011

Medical Marijuana

As of March 2011 there were laws in seven U.S. states that made it legal to sell and use marijuana for medicinal purposes. Those states were California, Colorado, Michigan, Montana, New Mexico, Oregon, and Washington. Four additional states and the District of Columbia are scheduled to open markets for medical marijuana before the end of 2011: Arizona, Maine, New Jersey and Rhode Island. The laws regulating the sale and use of marijuana in these states vary widely which makes tracking the market a complicated task. But as a fast growing market the motivation to track it is present and the task is made easier by the fact that marijuana is a highly regulated commodity and is therefore tracked carefully by most of the states in which its use for medical purposes is legal.

Today’s market size is the estimated value of marijuana sold legally in the United States. As a point of comparison, and according to the source, the sale of Viagra in the United States in 2010 was valued at $1.93 billion.

Geographic reference: Select states within the United States
Year: 2011
Market size: $1.7 billion
Source: Wayne Heilman, “Report: Medical Marijuana Sales to Reach $1.7B This Year,” The Gazette, Colorado Springs, March 24, 2011, available online here.
Original source: See Change Strategy and Medical Marijuana Markets

Public Transportation

The Capital Area Transit Authority (CATA) is the largest public transit provider in the Lansing, Michigan tri-county area. The tri-county area consists of Ingham, Clinton, and Eaton counties. CATA has been operating public transportation in the area since 1972. Ridership grew steadily during the 1970s, before leveling off during the 1980s and most of the 1990s. During the 1980s and 1990s, the number of rides fluctuated around 3-4 million annually. In 1999, CATA took over the Michigan State University bus service. Since then ridership has increased nearly 3-fold. In contrast, the population of the tri-county area grew by 22.6% from 1970 to 2010. Data represent the number of rides annually on CATA vehicles in 1972 and 2010.

Geographic reference: Lansing, Michigan area
Year: 1972 and 2010
Market size: Less than 1 million rides and 11.35 million rides respectively
Source: “CATA Demand Grows with Community Need,” CATA 2011 Community Report: Greater Lansing on the Move, August 2011; Tri-County Regional Planning Commission, “Tri-County Regional Growth: Choices for Our Future,” Draft Report, August 2002 available online here; “Ingham County, Michigan” available online here; “Clinton County, Michigan” available online here; and “Eaton County, Michigan” available online here

Spanish Import Market

The newest edition of an important yearly statistical compilation was released recently by the United Nations. The work is listed fully in the source note below.

Today’s market size is the size of the Spanish market for those exporting to Spain, thus, the size of the Spanish market for imports. Over the last decade (2000-2010), Spain saw the value of its imports rise by 106.4% and saw the value of its exports rise even more quickly (238%).

Geographic reference: Spain
Year: 2010
Market size: $315.55 Billion
Source: “Total Imports and Exports by Regions and Countries or Areas (Table A)”, 2010 International Trade Statistics Yearbook, Vol. 1—Trade by Country, June 16, 2011, available online here.

Professional, Scientific and Technical Services

Professional Services

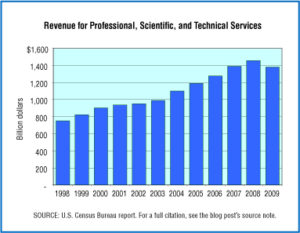
The sector of the U.S. economy that has been growing most strongly over the last decades is the Service Sector. The service sector includes all those who provide services instead of goods so, accountants, architects, computer programmers, consultants, doctors, hair stylists, lawyers, teachers and truckers to name but a few. The Census Bureau divides the Service Sector into eleven major categories and our market size today is one of those: Professional, Scientific and Technical Services, an industry whose revenues in 2009 represented 21.6% of all Service Industry revenues.

Over the period shown in the graph, 1998—2009, businesses providing professional, scientific and technical services saw their revenue grow by 85.3% which is 42.7% ahead of inflation.

Geographic reference: United States
Year: 1998 and 2009
Market size: $751.3 billion and $1,378.3 billion
Source: Services Annual Survey 2009, “Tables 1.1 Selected Service Industries – Estimated Revenue for Employer and Nonemployer Firms: 2005 through 2009,” and “Table 1.2 Selected Service Industries – Estimated Revenue for Employer Firms: 2005 through 2009,” pages 4 and 6, February 2011, available online here. Data in the graph are from earlier editions of this report series, links to which are available on a Census Bureau web page here.
Original source: U.S. Department of Commerce, Bureau of the Census

Streaming Video

Netflix and Hulu are two services that allow their customers to stream videos. A March 2011 Nielsen survey found that a majority of Netflix users who stream videos watch them on their TVs through gaming consoles, while a majority of Hulu users stream video on their computers.

Data are the number of videos streamed in the United States in May 2011. This was an all-time high.

Geographic reference: United States
Year: May 2011
Market size: 15 billion videos
Source: The Associated Press, “Half of Netflix Use Done on Consoles,” Lansing State Journal, July 31, 2011, page 4E

Auto Repair Services

Several of us here have had reason lately to make large payments to auto mechanics. This, combined with the level of business apparent at our various auto repair shops, led us to wonder if businesses that do automotive repair and maintenance work were perhaps recovering more quickly from the great recession than other businesses in the service sector.

The future looks bright for automotive repair shops as the median age of automobiles in the United States continues to climb. According to a study by R.L. Polk Company, the median age of automobiles on the road in the United States grew 44% between 1990 and 2008, from 6.5 years to 9.4 years. And these median age figures do not include the changes that resulted in the aftermath of the 2008 financial crisis which had a devastating impact on new vehicle sales. Demand for automotive repair will only increase as the age of the fleet increases.

Today’s market size is based on the estimated revenue of all automotive repair and maintenance firms in the U.S. in 2001 and 2010. Worth noting, these revenue figures are for firms defined by the source as “employer firms,” and thus do not include all those involved in doing repair work on their own or on the side.

Geographic reference: United States
Year: 2001 and 2010
Market size: $76,518 million and $83,714 million respectively
Source: Yearbook 2010, “Table 10.1 Other Services (Except Public Administration, Religious, Labor, and Political Organizations, and Private Households) (NAICS 81) – Estimated Revenue for Employer Firms: 2001 through 2009,” Service Annual Survey 2009, page 198, issued in February 2011 and available online here. Preliminary data for 2010 are from early released reports from the Service Annual Survey 2010.
Original source: U.S. Department of Commerce, Economics and Statistics Administration, U.S. Census Bureau

State Fairs

All but two states in the U.S. host an annual state fair. These fairs originated as competitive venues for displaying and ranking of livestock and other agricultural products. The events usually also included competitive events for visitors, such as pie eating contests or contests of strength. The displaying of arts and crafts was also a common feature in early state fairs as it is today still. The earliest official State Fair was in Detroit Michigan. Sadly, Michigan is one of the two states which has discontinued its state fair in the last two years due to budgetary limitations. The other state is Nevada.

Minnesota—the 21st state in a ranking of states based on 2010 population—has consistently had the second ranked State Fair when measured by attendance in recent years.

Today’s market share is the size of the attendance at the 2010 Minnesota State Fair, celebrated between August 26 and September 6, 2010. This year’s Minnesota State Fair will run from August 25 through September 5, 2011.

Geographic reference: State of Minnesota
Year: 2010
Market size: 1.78 million visitors
Source: “Carnivalwarehouse.com’s 2010 Top 50 Fairs,” a ranking published annually by the source, originally Matt’s Carnival Warehouse, founded in 1997. A list of recent Top 50 lists with links to each is available online here.
Original source: Carnivalwarehouse.com

Crushed Stone

Crushed Stone Sales Stats

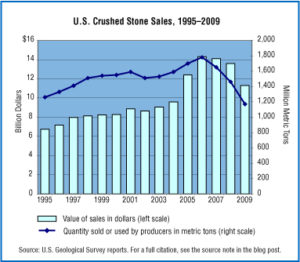
The market for crushed stone grew steadily through the first half of the last decade peaking in 2006 and then falling sharply as the housing market bubble imploded. The pattern can be seen clearly in the graphic which presents crushed stone sales, or use by producers, measured in quantity as well as value for the years 1995 through 2009.

Today’s market size is the value of crushed stone sales by producers in 2009. The data do not include American Samoa, Guam, Puerto Rico, or the U.S. Virgin Islands.

Geographic reference: United States
Year: 2009
Market size: $11.3 billion
Source: “Table 1: Salient Crushed Stone Statistics,” 2009 Mineral Yearbook, April 2011, page 71.5, available online here. The graphic was produced with data from this report as well as earlier editions of the same report.
Original source: U.S. Department of the Interior, USGS

Coupons

In 2010, 332 billion coupons were issued in the United States, 88% of them were in newspaper inserts. Of those 332 billion, a mere 1%, or 3.3 billion, were redeemed. The data show the estimated total amount saved by consumers who redeemed coupons.

Geographic reference: United States
Year: 2010
Market size: $3.7 billion
Source: Jean Chatzky, “How You Can Become a Coupon Queen,” USA Weekend, July 29-31, 2011, pages 6-7, 9
Original source: NCH Marketing
Posted on August 11, 2011