Cancer Diagnoses

Today’s market size is one based on a medical diagnosis and thus is really the size of the “customer” base for cancer treatment. Specifically, it is the number of people who were diagnosed with cancer of any type, anywhere in the world, in 2008.

Geographic reference: World
Year: 2008
Market size: 13 million
Source: “Death Rates are Down in the U.S. But Globally the Disease is Rising,” National Geographic, October 2011, page 28.
Original source: Globocan, International Agency for Research on Cancer
Posted on October 14, 2011


Clothes Stores

The sale of clothes through clothing stores is tracked by the U.S. Census Bureau by type of store: men’s clothing, women’s clothing and family clothing. In the year 2000 men’s clothing stores accounted for 9% of the category and fell to 6% by 2009. Women’s clothing stores also saw its share decline as a percent of the category from 29% in 2000 to 26% in 2009. More of us are buying our clothes at general merchandising stores and clothes stores that sell a fuller line of apparel, family clothing stores.

Today’s market size is the estimated total of sales by clothing stores in the United States in 2000 and 2009. These sales totals do not include retailers categorized under the heading general merchandisers, including department stores and warehouse clubs.

Geographic reference: United States
Year: 2000 and 2009
Market size: $118.2 billion and $152.3 billion respectively
Source: “Estimated Annual Sales of U.S. Retail and Food Service Firms by Kind of Business: 1998 Through 2009,” Annual Retail Trade Survey—2009, available in a PDF format here. For links to these data as well as earlier U.S. Annual Trade Survey data, check this Census Bureau site.
Original source: U.S. Bureau of the Census
Posted on October 13, 2011

Grocery Stores

Groceries

Food is something necessary to life and so it may seem, to those not in the business, that grocery stores would be immune to recessions. For the most part, U.S. grocery stores as an industry have weathered the two recessions of the decade 2000–2009 far better than other industries. But, as can be seen in the graph, even grocery stores saw sales slow during the recessions.

Today’s market size is the estimated total of sales by grocery stores and supermarkets in the United States in 2000 and 2009. These sales totals do not include the sales made through convenience stores.

Geographic reference: United States
Year: 2000 and 2009
Market size: $381.72 billion and $487.41 billion respectively
Source: “Estimated Annual Sales of U.S. Retail and Food Service Firms by Kind of Business: 1998 Through 2009,” Annual Retail Trade Survey—2009, available in a PDF format here. For links to these data as well as earlier U.S. Annual Trade Survey data, check this Census Bureau site.
Original source: U.S. Bureau of the Census
Posted on October 12, 2011

Spectator Sports

Today’s market size is the estimated total of revenue brought in by professional or semi-professional sports teams or clubs primarily engaged in participating in live sporting events—baseball, basketball, football, hockey, soccer, and jai alai games—before a paying audience. These establishments may or may not operate their own arena, stadium, or other facility for presenting these events. This is an industry that did not see a decline in revenues year-over-year during the recent recession, though its rate of growth did slow a bit.

Geographic reference: United States
Year: 2009
Market size: $20.64 Billion
Source: “Table 9.1. Arts, Entertainment, and Recreation Services (NAICS 71) — Estimated Revenue for Employer Firms: 2001 Through 2009,” Service Annual Survey: 2010, the report on NAICS Sector 71 is available online here.
Original source: U.S. Census Bureau
Posted on October 7, 2011

Bottom-Mounted Freezer Refrigerators

Trends in refrigerator design do not change in significant ways very often. Most changes in recent years have been related to the energy efficiency of these appliances. But one very visible design change that has become popular in the last half decade is the placement of the freezer section below the refrigerator section of the machine. These newly designed refrigerators are called bottom-mounted freezer style refrigerators. Many of these machines, though not all, use a large pull out drawer to hold the freezer section instead of a compartment entered through a simple door.

Today’s market size is an estimated size of this market for bottom-mounted freezer refrigerators in North America.

Geographic reference: North America
Year: 2010
Market size: $3 billion
Source: “UPDATE: Whirlpool Petitions US for Trade Probe on Samsung, LG,” ADVFN, March 30, 2011, available online here.
Original source: Dow Jones News and Whirlpool Corp.
Posted on October 6, 2011

The Business of Weddings

Today’s market size is an estimate of the size of the entire wedding industry in the United States—we take some license in using the word “industry” here. The things included in measuring the size of the wedding industry are many, from planning, apparel and jewelry through the ceremony, flowers, food, reception and honeymoon.

Geographic reference: United States
Year: 2010
Market size: $47.2 billion
Source: Toon Van Beeck and George Van Horn, “Wedding Bells are Ringing,” The RMA Journal, December 2010-January 2011, page 22-27, available online here.
Original source: IBISWorld
Posted on October 5, 2011

Major League Baseball Tickets

The 2011 Major League Baseball postseason has begun but statistics have yet to be published to reveal the official number of regular season MLB tickets that were sold this season. Therefore, we look to last year for the size of audiences at MLB games for today’s market size post. Projections early in 2011 forecast a slight increase in ticket sales for 2011.

Go Tigers!

Geographic reference: United States
Year: 2010
Market Size: $73.1 million tickets sold
Source: David Simmons, “Early Ticket Sales and Attendance Projections for MLB in 2011,” Bizofbaseball.com, April 13, 2011, available online here.
Original Source: Business of Sports Network
Posted on October 4, 2011

Woody Biomass

As fuel prices rise, demand for alternative energy sources naturally grows. One such alternative energy for those burning fossil fuels in an industrial application is to burn woody biomass instead. Not surprisingly, pulp and paper manufacturers—many of whom are vertically integrated and thus own their primary input material, wood—around the world are using more woody biomass to fuel their own industrial applications.

Today’s market size is the volume of woody biomass—bark, sawdust, wood chips, forest residues and the like—used by the pulp and paper industry globally in 2009.

Geographic reference: World
Year: 2009
Market size: 1,400 trillion British Thermal Units which is roughly equal to 75 million oven dried metric tons.
Source: “Biomass Market Update – 4Q/2009,” Wood Resource Quarterly – 4Q/2009, page 10, available online here.
Original source: Wood Resources International
Posted on October 3, 2011

U.S. Airlines

miles and operating revenue

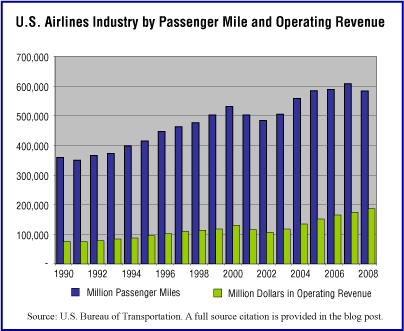
The graphic to the right presents both passenger miles of travel provided by U.S. airlines between 1990 and 2008 and operating revenues in those years. The picture this graph presents is a pleasant one with both measures rising pretty steadily over the period shown, with the notable exception of 2001 and 2002, the years for which the terrorist attacks of 2001 had the greatest impact on air travel. However, the airline business is a complicated business. As it turns out, over this same 19 year period, the industry as a whole suffered cumulative losses of $45.3 billion.

Today’s market size is the operating revenue earned by Airlines in 2008, a year in which the industry had losses of $23 billion. Running an airline is a complicated business to be sure.

Geographic reference: United States
Year: 2008
Market size: $186.12 billion
Source: “Table 1073. U.S. Scheduled Ariline Industry — Summary: 1995 to 2009,” Statistical Abstract of the United States 2012, page 677 and earlier editions. A PDF of page 677 of the work is available here. “Table 1-37: U.S. Passenger-Miles (Millions),” from the national transportation statistics available here.
Original source: U.S. Department of Transportation and U.S. Census Bureau
Posted on September 30, 2011

Amusement Parks

Within the economic sector Arts, Entertainment, and Recreation Services is the Amusement Park Industry. It is defined by the U.S. Census Bureau as an industry covering establishments, known as amusement or theme parks, primarily engaged in operating a variety of attractions, such as mechanical rides, water rides, games, shows, theme exhibits, refreshment stands, and picnic grounds. These establishments may lease space to others on a concession basis. The sector as a whole saw the revenues of employer firms grow by 40.7% between 2001 and 2009. Amusement parks fell shy of this growth rate, growing by a still healthy 34.58% over this period and exceeding the rate of inflation by 13.44%.

Today’s market size is the revenue earned by amusement and theme parks in the United States in 2001 and 2009.

Geographic reference: United States
Year: 2001 and 2009
Market size: $8.64 and $11.62 billion respectively
Source: “Table 9.1. Arts, Entertainment, and Recreation Services (NAICS 71) — Estimated Revenue for Employer Firms: 2001 Through 2009,” Service Annual Survey: 2010, the report on NAICS Sector 71 is available online here.
Original source: U.S. Census Bureau
Posted on September 29, 2011

Bowling Alleys

Today’s market size is a measure of the revenue generated by bowling alleys in the United States in 2001 and in 2009. While it is not a flashy or “extreme” sport, based on bowling alley revenues, it is holding its own in the overall arts and entertainment sector of the economy.

Geographic reference: United States
Year: 2001 and 2009
Market size: $2.88 and $3.11 billion respectively
Source: “Table 9.1. Arts, Entertainment, and Recreation Services (NAICS 71) — Estimated Revenue for Employer Firms: 2001 Through 2009,” Service Annual Survey: 2010, the report on NAICS Sector 71 is available online here.
Original source: U.S. Census Bureau
Posted on September 28, 2011

Pinball Machines

Pinball was a popular form of entertainment in the 1970s through the early 1990s. During this time period, there were five different companies producing 100,000 machines per year. Since then, video games have replaced pinball as a popular pastime. Many businesses such as arcades and bars, where pinball machines were commonplace, saw reduced revenue and decided to get rid of the machines and replace them with video games.

In 2011, Stern Pinball, based in Chicago, Illinois, was the only remaining pinball manufacturer in the world. From 1999 to 2009, the number of pinball machines in commercial locations dropped from 360,000 to 79,000. Data show pinball industry revenues in 1999 and 2009.

Geographic reference: United States
Year: 1999 and 2009
Market Size: $1.1 billion and $275 million respectively
Source: Olivia Oran, “Pinball Fights to Survive in an ‘Angry Birds’ World,” The Street, September 19, 2011, available online here.
Original source: Vending Times
Posted on September 23, 2011

Derivatives

Congressional attempts to regulate the market for derivatives is bringing this market into the news again. Until the financial crash of 2008 the derivatives market was well below the radar of most people. As the financial crisis unfolded we learned how the market for derivatives had been taken over by financial speculators and financial institutions using them in… innovative ways, turning them into something quite different from what they had been for more than a century.

In a perfect world, derivatives—an agreement between two parties about an exchange in which the price of the item being exchanged is derived from the value of an underlying asset—are used, for example, by a manufacturer to lock in the otherwise widely fluctuating price of a commodity that it buys regularly. When used this way, derivatives are a sort of insurance against volatility, a so-called hedge against risk. Things get more complicated when this sort of insurance is purchased by somebody that doesn’t actually own the insured asset and that is where we enter the world of speculation which has become a large part of the derivatives market during the last two decades.

Geographic reference: World
Year: 2010
Market size: $600 trillion
Source: Aaron M. Kessler, “Carmakers Fear Restrictions of Wall Street Reform,” September 22, 2011, Detroit Free Press, page B1.
Posted on September 22, 2011

Hospitals

Most of us are well aware of the rising costs of health care. It will not come as a surprise to see that revenues for hospitals in the United States have seen steady increases year-over-year, despite recessions, slowdowns, housing bubbles, financial melt-downs, or any other events that disrupt the economy. This is not to suggest that individual hospitals may not have struggled during our most recent recession, however, as a whole, the hospital industry has seen nothing but rising revenues for well over a decade.

Today’s market size is the revenue earned by hospitals in the United States in 2005 and 2010. Revenues increased over this period by 30.4%, more than twice the rate of inflation during over the same period which was 12.8%. To your health!

Geographic reference: United States
Year: 2005 and 2010
Market size: $620.85 billion and $809.47 billion respectively
Source:  “Table 1 – Selected Services, Estimated Quarterly Revenue for Employer Firms,” Annual Benchmark Report for Services through 2010, page 9, a series of reports put out by the Census Bureau in conjunction with their Service Annual Survey, published every non-Economic Census year. The table from which today’s market size is taken is available online here.
Original source: U.S. Department of Commerce, Economics and Statistics Administration, U.S. Census Bureau
Posted on September 20, 2011

Commercial Casinos

According to a report put out by the American Gaming Association the commercial casino business in the United States, in 2010, employed 340,564 people and paid $7.59 billion in direct gaming taxes. Commercial casinos as a category include Tribal Casinos as well as privately held land-based casinos, river-based casinos and horse racing tracks which are now referred to in the industry as racetrack casinos. While the industry saw year-over-year revenue declines in 2008 and 2009, by 2010 it was recovering.

Today’s market size is the gross gaming revenue earned in the United States by all commercial casinos. By way of comparison, it is worth noting that total commercial casino revenues in 2008 equaled 67.2% of total lottery ticket sales by all government entities ($53.7 billion). Gaming is quite a big business…

Geographic reference: United States
Year: 2002, 2007 (peak year) and 2010
Market size: $28.07, $37.52 and $34.60 billion respectively
Source: “U.S. Commerical Casino Revenue Shows Slight Improvement in 2010,” Casino Journal, June 7, 2011, BNP Media, available online here.
Original source: American Gaming Association
Posted on September 19, 2011

Air Travel Globally

Despite the dramatic declines in air travel for several years following the terrorist attacks in 2001, over the last decade, humans have been flying more and more. Worldwide, approximately 513 million passengers traveled by air in 1991 and by 2007 that figure had quadrupled, reaching 2,076 million.

Today’s market size is the value of the global airline business in 2007 and a forecast of the value in the year 2012. What is not evident from these revenue based figures is the fact that airlines, despite their growth, have not added up to a profitable business sector. In fact, since deregulation in the United States in 1978, airlines as a whole have lost money.

Geographic reference: World
Year: Forecast for 2007 and forecast for 2012
Market size: $430 billion and $711 billion respectively
Source: “The Global Airline Industry Will Reach a Value of $711 Billion in 2012, Forecasts New Report,” a press release dated March 14, 2009, announcing the publication of a market report being offered through a web service called “Report Buyer.” The press release is available here. The original report is titled Airlines: Global Industry Guide.
Original source: Datamonitor
Posted on September 16, 2011

Trucking, General Freight

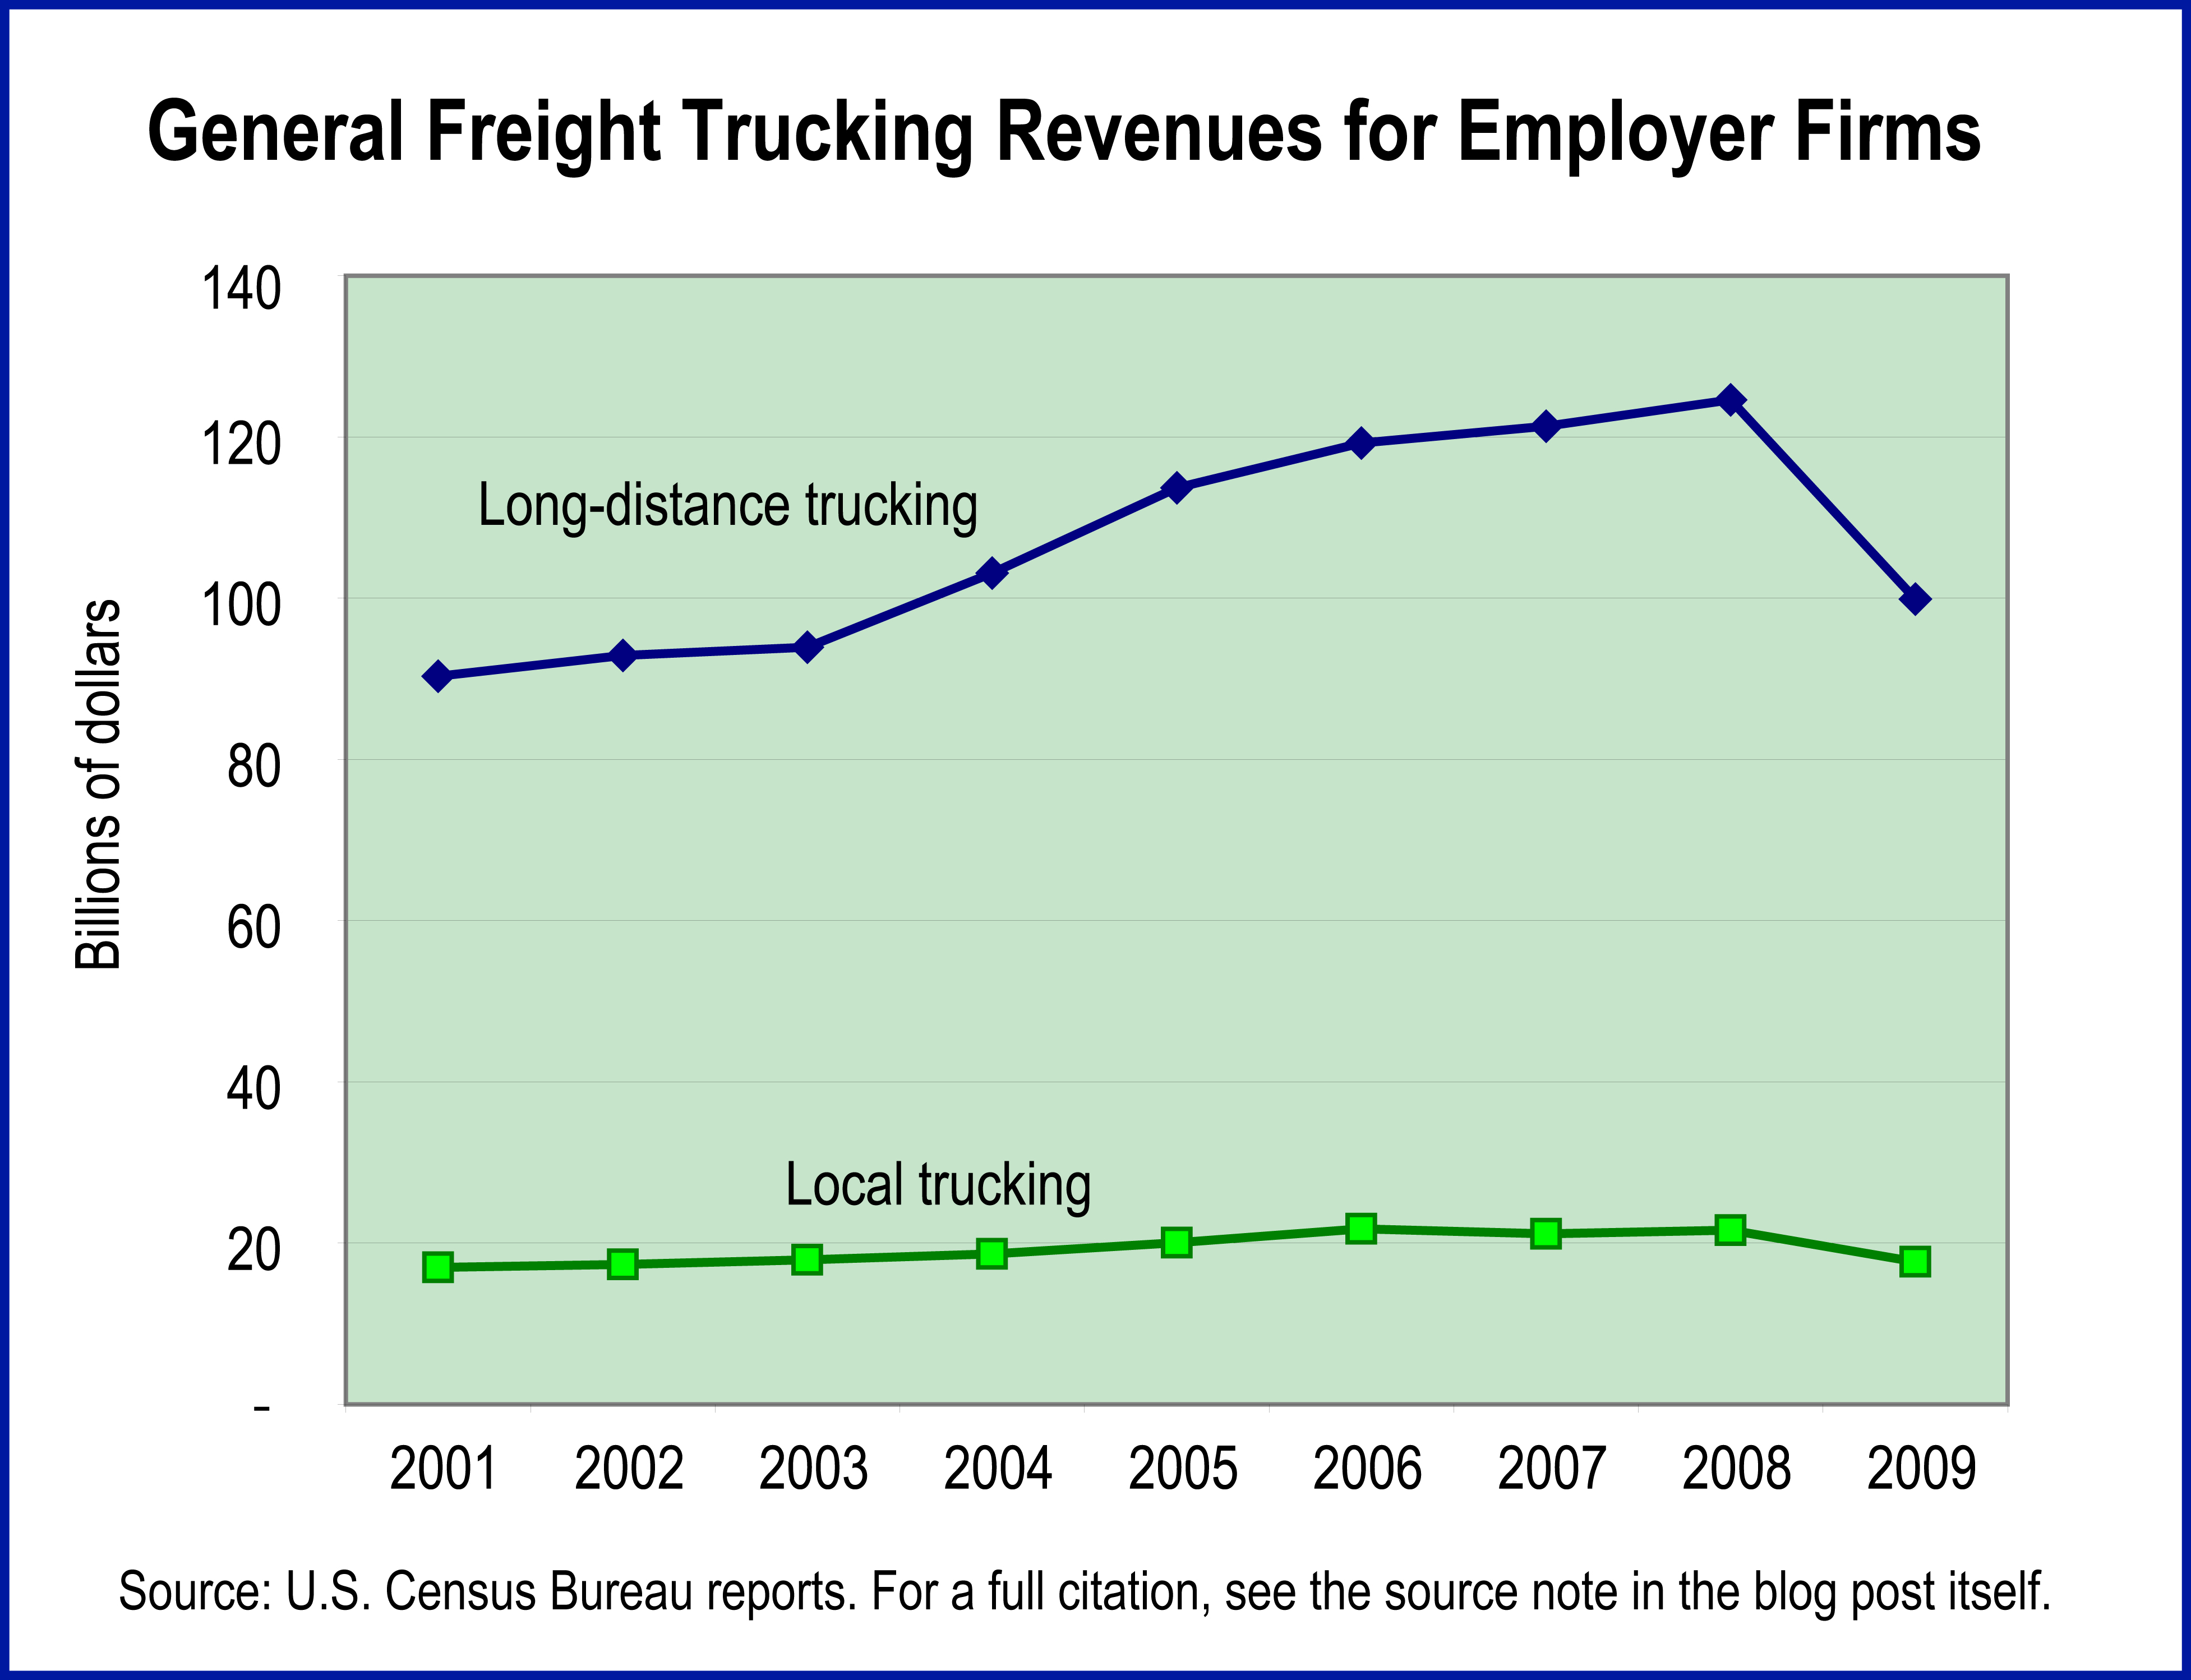
General freight truckingToday we look at the revenues generated by general freight trucking firms and specifically, those with employees. Today’s market size does not include the revenues generated by independent truckers who are categorized as nonemployers. The graph charts estimated revenues from 2001 through 2009 and presents them for local freight movements as well as long-distance.

Geographic reference: United States
Year: 2001 and 2009
Market size: $107.32 billion and $117.58 billion respectively
Source: “Table 2.1 Transportation and Warehousing (NAICS 48, 49) – Estimated Revenue for Employer Firms: 2001 through 2009,” Service Annual Survey 2009, page 9, issued in February 2011 and available online here.
Original source: U.S. Department of Commerce, Economics and Statistics Administration, U.S. Census Bureau
Posted on September 15, 2011

“e-Learning” Hardware and Software

The use of computers and other technological devices in the classroom has long been a source of debate among educators. Equipping schools with the most cutting edge technology is costly and the benefits of these expenditures in actually teaching students is not always evident. Nonetheless, in a world in which computers are ubiquitous the desire to have our children use modern technology with confidence helps to drive growth in the market for “e-learning” devices and software.

Today’s market size is a forecast of the value of the e-learning sub-sector of “the global education market” in the year 2015.

Geographic reference: World
Year: Forecast for 2015
Market size: $69 Billion
Source: “Brave New World: The Changing Landscape of Education and Technology,” April 2010, a report posted online by the firm Spire Research & Consulting and available here.
Original source: Marijk van der Wende, “The Role of US Higher Education in the Global E-Learning Market,” Center for Higher Education Policy Studies (CHEPS), Research & Occasional Paper Series, University of California, Berkeley, 2002
Posted on September 14, 2011

Nonemployer Professional, Scientific and Technical Services

We recently posted the size of the professional, scientific and technical services market in the United States, here, and today we add detail to that market post by offering the size of a subset of the market. Today we show the revenue for all nonemployer firms in this service industry which represents 8.6% of the total revenue generated by professional, scientific and technical service providers in 2009. Most nonemployer firms are individual proprietorships but some are partnerships and even corporations. The point is, they have no paid employees. There were 21 million such firms in the United States in 2009, 18.7 million of them were individual proprietorships.

Geographic reference: United States
Year: 2009
Market size: $118.3 billion
Source: “2009 Nonemployer Statistics: Geographical Area Series: Nonemployer Statistics by Legal Form of Organization: 2009,” one of the many offerings on the Census Bureau’s American FactFinder platform, available here.
Original source: U.S. Census Bureau
Posted on September 13, 2011

Bike Parking Racks

The current Transportation Commissioner in New York City, Janette Sadik-Khan, is working on increasing the ease with which people are able to use bicycles in that city, even encouraging people to use bikes as their commuter vehicles. While New York has a long way to go to reach the level of biker welcomeness found in other large, world cities it has made progress, doubling the number of bike paths to an estimated 500 miles since 2007. As biking becomes easier in the “Big Apple” the demand for more safe places to park bikes is expected to continue to rise.

Today’s market size is the estimated number of bike parking racks in place in New York City as of the summer of 2011.

Geographic reference: New York
Year: 2011
Market size: 12,800
Source: Frank Bruni, “Bicycle Visionary,” The New York Times, September 11, 2011, page SR1.
Original source: NYC Department of Transporation and John Pucher, co-author of an upcoming book titled City Cycling.
Posted on September 12, 2011