Gluten-free Foods

Gluten is a protein found in various cereal grains, most notably wheat. This protein makes for the elastic texture of dough. It is also a protein that must be avoided by those with celiac disease, a condition which seriously interferes with the body’s ability to absorb nutrients. An in-depth epidemiological study whose findings were published in 2003 found that one in every 133 people in the United States suffers from celiac disease. Celiac disease sufferers and their immediate families are a natural market for gluten-free foods and the food industry has been increasing the number of gluten-free products on the market at a rapid pace in recent years. Those gluten-free offerings include bread, cookies, crackers, breakfast cereals, and cake mixes.

Today’s market size is the estimated size by value of the gluten-free market in the Untied States.

Geographic reference: United States
Year: 2011
Market size: $6.3 billion
Source: Keith O’Brien, “Beat the Wheat,” The New York Times Magazine, November 27, 2011, page 50, available online here.
Original source: Spins, a market research firm.
Posted on November 30, 2011

Computers in the U.S.

The steady rise in demand for computers and electronic computing devices in the United States appears, when charted, as a line moving in exactly the opposite direction as the domestic production and shipments of these same products. This is an industry (NAICS 334111) that highlights a trend towards increasing consumption of a product and declining production of the same which feeds the U.S. trade imbalance. But that leads us to complex questions we don’t really want to address here. Here, we present market sizes and today’s is based on the value of Electronic Computer Manufacturing in the United States in 2000 and 2010 as well as the value of net imports of the same products in 2000 and the forecasted value for 2010.

Geographic reference: United States
Year: 2000 and 2010
Market size: U.S. manufacturing $69.3 and $27.9 billion
Market size: Net imports $89.4 and $199.3 billion
Source: Computer value of shipments from Annual Survey of Manufactures 1997, and the 2002 Economic Census. Net imports of Electric and Electronic Equipment from Statistical Abstract of the United States: 2000. Net imports of Computers and Electronic Products from Statistical Abstract of the United States: 2012.
Posted on November 29, 2011

Canned Pumpkin

For most people in the United States, the first two things that pop to mind when the word pumpkin comes up are pumpkin carving for jack-o-lanterns and pumpkin pie. It is the latter that inspired today’s post since pumpkin pie is one of the traditional dishes on a Thanksgiving Day menu.

Only a small portion of the pumpkins grown in the United States are actually used for decoration and jack-o-lanterns. The majority are consumed as food and most of those are processed into canned pumpkin and pie mix. The place most associated with this pumpkin processing is the town of Morton, Illinois where, in a Libby’s processing plant, approximately 85% of the world’s canned pumpkin is canned.

Today’s market size is the estimated value of the 2011 pumpkin crop in the United States. We wish all our visitors a Happy Thanksgiving.

Geographic reference: United States
Year: 2011
Market size: $116.5 million
Source: Malinda Geisler, “Pumpkins,” one of a series of reports produced by the USDA’s Agricultural Marketing Resource Center. This one is dated August 2011 and is available online here.
Original source: U.S. Department of Agriculture

Headphone Market

The arrival of a new, high-end, expensive and very fashionable headphone has stirred up the market for headphones. Headphones are a reasonably mature product segment which was infused with energy over recent years by earbuds that are commonly used with MP3 players of all sorts as well as cell phones and other small recording devices. But it was the arrival on the scene of the headphone, Beats by Dr. Dre, that reinvigorated the market most recently, the sales of which account for nearly a quarter of the market size listed below. Celebrity meets audio equipment and the market expands. Increased hearing loss in adolescents may be part of the unseen price being paid.

Geographic reference: United States
Year: 2011
Market size: $2 billion
Source: “Headphones With Swagger (and Lots of Bass),” The New York Times, Sunday, November 20, 2011, page B1, available online here. Also, “One in Five U.S. Adolescents Has Hearing Loss, Researchers Find,”
Bloomberg.com, August 17, 2010, available online here.
Original source: NPD Group and Journal of the American Medical Association
Posted on November 21, 2011

Gaming Software

The production of video game software is part of the larger software publishing industry, a small part but a growing part. Based on the report used as our source here, cited below, and data from the U.S. Census Bureau on the industry as a whole, in 2010 the gaming software revenue portion of the larger software industry accounted for 6.7% of the total. Today’s market size is the estimated revenue of the largest 220 companies active in the entertainment and games software industry in the United States.

Geographic reference: United States
Year: 2010
Market size: $10 billion
Source: “Entertainment & Games Software Industry Profile,” last updated on November 7, 2011. This is a report being sold by First Research on the website here.
Original source: First Research
Posted on November 18, 2011

Deer Breeding Market

Deer Crossing Sign

A recent crackdown on smuggling operations in Texas has shed light on a market about which many of us are probably entirely unaware. In fact, for an urban dweller, reading about the illegal smuggling of deer and deer breeding operations is a little like reading a science fiction story. It turns out that many hunters, and particularly big game hunters, are willing to pay a very high price for a deer with trophy size antlers. Since the native deer of Texas have more diminutive antlers than do the white-tail deer found further north, the illegal smuggling of big antlered deer exists in Texas. Transporting white-tail deer into Texas is restricted to help protect the native deer species from diseases not found in their herds. However, the breeding of deer with white-tail deer sperm is legal in Texas but it is very expensive. Thus, the illegal importing of white-tail deer has become a lucrative, black market in Texas.

Today’s market size is the estimated value of the legal deer breeding business in the United States.

Geographic reference: United States
Year: 2007
Market size: $650 million
Source: Cindy Horswell, “Authorities Target Texas Deer Smugglers,” South Texas Outdoors, October 19, 2011, available online here.
Original source: Texas A&M University
Posted on October 16, 2011

Co-ops

Interest in cooperatives is on the rise as people look to community-rooted alternatives to the dominance of huge, global banks, enormous retailing giants with little link to the local community, and empty main street store fronts. Cooperatives, or co-ops, are nonprofit businesses of various types such as credit unions and stores. These co-ops are created when members pool money in order to set up, manage and run the organizations on behalf of their members. Today’s market size is the estimated number of such cooperatives in the United States and the estimated value of the revenue they generate annually as of 2010.

Geographic reference: United States
Year: Forecast for 2010
Market size: 29,000 Co-ops generating $654 billion in revenues
Source: Amy Cortese, “Buying Underwear, Along With the Whole Store,” The New York Times, November 13, 2011, page B1, available online here.
Original source: University of Wisconsin
Posted on November 14, 2011

Veterans Enrolled in the VA

Today’s post is about veterans since it is the holiday we have designated for remembering our veterans of foreign wars. The Department of Veterans Affairs has since 1999 done an annual survey to help track the number of veterans who are enrolled to receive health benefits through the Veterans Administration (VA). It may surprise some people to discover that a veteran of the U.S. military would even need to enroll in anything to receive VA benefits but things are more complicated as it turns out.

Here is an explanation from the VA on the need to enroll annually for some veterans. “Enrollments are renewed annually and many veterans will stay enrolled each year without any action on their part. Most veterans who are not receiving monthly compensation or pension checks from VA, however, must complete an annual financial statement known as a Means Test. Completing a Means Test allows the VA to place you in the correct Priority Group for determination of copayments. It also ensures that your local VA receives reimbursement from VA for the health care provided to you.”
Link to quoted source.

The market size listed below is the number of U.S. veterans enrolled to receive VA benefits in 2002 and in 2010.

Geographic reference: United States
Year: 2002 and 2010
Market size: 6.2 million (approximately 25% of the veteran population in 2002) and 7.8 million (approximately 35% of the veteran population in 2010)
Source: “Table 7.1—Perceived Health Status by Year,” 2010 Survey of Veteran
Enrollees’ Health and Reliance Upon VA,
July 2011, page 74, available in a PDF format here.
Original source: U.S. Department of Veterans Affairs
Posted on 11/11/11

Restaurant Market

In the United States the trend towards eating out, as opposed to making meals at home, has been on a steady upwards trajectory for more than a century. The arrival of the car and the interstate highway system made us more mobile and fast food restaurants increased greatly our opportunities to “grab a bite on the road.” In 1950 American’s spent approximately 24% of their food budget on food eaten away from home. In 2010 that percentage had doubled, to 48%.

Today’s market size is the estimated sales revenue at full-service restaurants in the United States in 2010. This does not include fast food restaurants, catered affairs or even specialty food services like the cafeterias set up in office buildings or other institutional settings, nor such things as food carts that sell from the street or park or parking lot. Full-service restaurants are those that provide a meal to customers who come to sit down and be served a meal.

Geographic reference: United States
Year: 2009
Market size: $195.35 billion
Source: “Estimated Annual Sales of U.S. Retail and Food Services Firms by Kind of Business: 1992 Through 2009,” Annual Retail Trade Survey, March 31, 2011, a PDF version of the table is available here.
Original source: U.S. Census Bureau [a wonderful and important part of the U.S. Department of Commerce that, due to funding cutbacks, is in the process of eliminating some of their valuable services. We are sorry to see them go and we sincerely hope that the cutbacks will not in any way reach the core data collection work done in the Economic Census program itself or the eqaully crucial sector-based annual surveys that so carefully track economic activity by sector—Annual Survey of Manufactures; Service Annual Survey; Annual Retail Trade Survey; Annual Wholesale Trade Survey, etc…].
Posted on November 9, 2011

Foreign Students in the United States

While within the United States there is a great deal of debate about how the higher education system as a whole is functioning, its appeal to those from outside the country is as strong as ever. The number of students traveling from outside the United States to attend a U.S. institute of higher learning has been increasing steadily during the first decade of the 21st century. This is both a challenge and a benefit for U.S. colleges and universities as these students often need intensive language assistance but also pay full tuition. According to the U.S. Department of Commerce, foreign students in the United States contribute approximately $20 billion to the economy annually.

Today’s market size is the size of the population of foreign students at U.S. institutions of higher learning in 2009.

Geographic reference: United States
Year: 2009/2010 School Year
Market size: 690,923 students — in terms of country of origin, the three leading countries are China which sent 18.5% of the students in 2009/2010, India which sent 15.2% and South Korea which sent 10.4%
Source: A press release for the report titled Open Doors 2010 which is put out annually by the Institute of International Education. The report is issued annually and the press release announcing the 2010 edition is available online here.
Original source: Institute for International Education and the U.S. Department of State’s Bureau of Educational and Cultural Affairs
Posted on November 7, 2011

Bio-Based Manufacturing

In 2011, U.S. Senator Debbie Stabenow, Chairwoman of the Senate Committee on Agriculture, Nutrition, and Forestry introduced her “Grow It Here, Make It Here” initiative to spur growth in the emerging bio-based manufacturing industry. The initiative would provide a 30% tax cut for new, expanded, or re-equipped bio-manufacturing projects. Bio-based manufacturing uses agricultural goods, such as soy and wheat, to make value-added products, such as car parts, cleaning products, and plastics. This is not a new concept. Henry Ford used Michigan-grown soy and other agricultural products in his automobiles. In recent years, more and more automakers are using parts made from agricultural products. An example: the seats of the new Ford Focus and the Chevy Volt are made of Michigan-grown soy material.

Currently, bio-based products represent 4% of the plastic and chemical industry market. According to the U.S. Department of Agriculture, the potential market for bio-based plastic and chemicals could reach 20% by 2025 with federal policy support. Some studies show that if that 20% is reached, it would create more than 100,000 American jobs. This does, however, assume that agricultural production is able to keep up with strongly increasing demand and do so while maintaining competitive prices. Today’s market size is the estimated, current value of the bio-based economy in the United States.

Geographic reference: United States
Year: 2011
Market Size: $1.25 trillion
Source: “Stabenow Announces ‘Grow It Here, Make It Here’ Initiative to Advance Emerging Michigan Industry in Zeeland,” October 24, 2011, available online here.
Posted on November 4, 2011

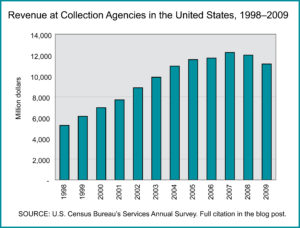
Collection Agencies

Collection Agencies, estimated revenue annually

Today’s market size post looks at collection agencies. You may be forgiven for assuming that collection agencies are in a recession-proof sort of business. From the looks of the national data on that industry, this is not entirely true. The graph shows estimated annual revenue for collection agencies over more than a decade.

Geographic reference: United States
Year: 1999 and 2009
Market size: $6.10 billion and $11.14 billion
Source: “Table 7.1. Administrative and Support and Waste Management and Remediation Services (NAICS 56) — Estimated Revenue for Employer Firms: 2002 Through 2009,” Service Annual Survey: 2010, parts of which are available online here. Data for years prior to 2002 were obtained from earlier editions of the Service Annual Survey, many of which are also available from the Census Bureau’s websites.
Original source: U.S. Census Bureau
Posted on November 2, 2011

Chewy, Juicy, Gooey Candy Market

Most of us think of candy as, well, candy. But within the industry, of course, candy is divided up into segments and tracked carefully. One of those candy segments is called the “chewy candy sector” and includes such things as gummies, jelly beans, Twizzlers, Sweet Strings ‘n Sour Rings, Starbursts, Gummibursts, etc. Some refer to this segment of the market as gummies and jellies.

Today’s market size is the estimated total sales of chewy candies in the United States in 2010.
Happy Halloween!

Geographic reference: United States
Year: 2010
Market size: $2.2 billion
Source: Grace Weitz, “Companies Juiced with New Gummy Products,” Candy Industry, April 28, 2011, available online here
Original source: Mintel
Posted on October 31, 2011

Postal Service Mailboxes

Blue USPO Mailbox

While the United States Postal Service publicizes the closing of thousands of post offices nationwide, the laying off of workers, and the end of Saturday delivery, one service the Postal Service offers has been slowly, quietly disappearing: the corner mailbox.

Once a staple in many neighborhoods, the blue mailbox on the corner is now slowly fading into history. Nancy Pope of the Smithsonian Institution commented thus about the significance of the corner mailbox: “Nothing says you’re on an American street more than the blue mailbox. It’s part of a neighborhood identity. It’s reassurance, it represents our ability to communicate with one another. When you take this away, something is lost.” At one time these blue mailboxes were seemingly everywhere. A convenience that perhaps has been taken for granted over the years. Data show the number of United States Postal Service blue mailboxes nationwide.

Geographic reference: United States
Year: 1985 and 2011
Market Size: 400,000 and 160,000 respectively
Source: Bob Greene, “Farewell My Mailbox,” CNN.com, September 8, 2011, available online here. The charming little image used above was obtained from this site, and used with our thanks.
Original Source: Research by Carolyn Jones of the San Francisco Chronicle.
Posted on October 28, 2011

Vinyl Records Market

Could it be, as some sources are now reporting, that the vinyl record of the past is coming back? The ease of digital sound recording and the distribution of music digitally appeared to have made earlier music recording formats extinct. Now it appears that vinyl records are making a comeback, at least as a niche market.

Today’s market size is an estimated total number of vinyl records sold in the United States in 2007 and in 2010, a significant portion of which are newly pressed vinyl recordings.

Geographic reference: United States
Year: 2007 and 2010
Market size: 988,000 units and 2.8 million units respectively
Source: David Giffels, “Building a House of Wax,” The New York Times Magazine, October 23, 2011, page 28, available online here. Amira Jensen, “Dust off the Turntable: Record Sales Jump,” ABC News / On Campus, April 6, 2009, available online here.
Original source: Neilsen Company
Posted on October 26, 2011

Express Delivery Market

The Internet has not done away entirely with the need to ship documents across the globe and quickly. Today we look at the express delivery industry which provides expedited delivery of documents and parcels almost anywhere on earth. Major players in this industry include familiar names like DHL, FedEx, and UPS, although national postal services also have a role in this business.

The market size presented below is the estimated total sales revenue generated by the express delivery industry in 2008.

Geographic reference: World
Year: 2008
Market size: $175 billion
Source: “Facts & Figures on Express Industry,” a report made available online, here, by The European Express Association.
Original source: Oxford Economics
Posted on October 24, 2011

Floor Covering Stores

Today’s market size is based on sales through retail outlets dedicated to floor coverings, from carpets to tile, wood to laminates. Two years of estimated sales by these retail outlets in the United States are provided. Leading retailers in this category include ABC Carpet and Home, Empire Home Services, Floor and Decor, Lumber Liquidators, and Seagull Enterprises.

Geographic reference: United States
Year: 1998 and 2009
Market size: $17,013 million and $15,734 million respectively
Source: “Estimated Annual Sales of U.S. Retail and Food Service Firms by Kind of Business: 1998 Through 2009,” Annual Retail Trade Survey—2009, available in a PDF format here. For links to these data as well as earlier U.S. Annual Trade Survey data, check this Census Bureau site.
Original source: U.S. Bureau of the Census
Posted on October 21, 2011

Video Games

According to the Entertainment Software Association, 72 percent of households in the United States own a video game machine. Initially video games were targeted to males, but by 2010 48 percent of gamers were female. And, although nearly all children aged 12-17 play video or computer games, the average gamer is 37 years old. Nearly one-third of gamers are older than 50.

Data show the amount consumers spend on video games in the United States. To provide some perspective, in 2010, worldwide motion picture ticket sales totaled $31.0 billion. Figures for 2012 are projected.

Geographic reference: United States
Year: 2010 and 2012
Market Size: $25.1 billion and $70.0 billion
Source: Thomas L. McDonald, “Get in the Game,” The Catholic Times, October 1-7, 2011, page 6
Original Source: Entertainment Software Association
Posted on October 20, 2011

Windows

Window manufacturers have been hit hard by the decline in new home construction. Today’s market size is the total number of windows shipped by manufacturers in the United States for use in new construction in 2005 and an estimate of what that number will be for 2011. Leading manufacturers of window include Anderson Corp.; Atrium Windows and Doors; Jeld-Wen, Inc.; Marvin Windows and Doors; and Pella Corp.

Geographic reference: United States
Year: 2005 and 2011
Market size: 34.1 million and 11.9 million units respectively
Source: Andrew Martin, “In Company Town, Cuts but No Layoffs,” The New York Times, September 25, 2011, page B1 and B10, available online by a different title here.
Posted on October 19, 2011

Online Poker

Gambling moved onto the Internet as soon as a reliable means of exchanging funds was available on that network. One could call this industry an early adopter of e-commerce. The rules of the game, however, are not always clear and vary from country to country and jurisdiction to jurisdiction which complicates things for a system that spans geographies. Nonetheless, according to those following the market, it is a lucrative one.

Today’s market size is an estimated total number of dollars gambled through online poker sites by Americans in 2010.

Geographic reference: United States
Year: 2010
Market size: $16 billion
Source: Janet Morrissey, “Poker Inc. To Uncle Sam: Shut Up and Deal,” The New York Times, October 9, 2011, page B1, available online here.
Original source: PokerScout.com
Posted on October 18, 2011