Great Lakes’ Fishing

After the Caspian Sea, the Great Lakes are the largest expanse of fresh water on Earth. The five lakes that lie on the border of the United States and Canada are, in order of size, Lake Superior, Lake Huron, Lake Michigan, Lake Erie and Lake Ontario.

Today’s market size is the size of the sports fishing industry on the Great Lakes.

Geographic reference: United States and Canada
Year: 2010
Market size: $7 billion
Source: Eric Sharp,”Dollars and Sense,” Detroit Free Press, Sunday, February 5, 2012, page 3C.
Posted on February 11, 2012

Spending on TV Ads During Sporting Championships

As we prepare to feast upon the spectacle that is the Super Bowl there is much talk about the advertisements that will be shown during the game. Turns out, in three of the last five years baseball’s World Series actually sold more advertising during its championship series than did the Super Bowl, with far less attention to the fact. But the baseball World Series is, of course, a series and not a single, super hyped game. There is no question that Super Bowl ads have become for many part of the show.

Today’s market size is the spending on network television advertising during the broadcasting of major sporting championships in 2011.

Enjoy the spectacle!

Geographic reference: United States
Year: 2011
Market size: Football – Super Bowl $228 million
Market size: Baseball – World Series $269 million (7 game series)
Market size: Basketball – NCAA Mens BB Final Four $170 (3 games)
Source: Jack Loechner, “Super Bowl Ad Stats,” a blog post on MediaPost, January 30, 2012, available here.
Original source: Kantar Media
Posted on February 4, 2012

Movie Theater Box-Office

Americans love movies but in the last few years we’ve been deciding more and more often to watch them at home or on-the-go and not in movie theaters. Technology has made that possible and theater ticket sales are declining as a result. In other words, attendance is down. While the number of tickets sold has declined, the revenue those tickets bring in is not dropping as quickly since ticket prices are rising.

Today’s market is the market for movie theater attendance in the United States and Canada in 1990, 2010 and 2011.

Geographic reference: United States and Canada
Year: 1990, 2010 and 2011
Market size: [tickets sold] 1.19, 1.34, and 1.28 billion respectively
Market size: [box-office] $5.02, $10.6 and 10.2 billion respectively
Source: “Movie Ticket Sales Slump: Theater Owners Try Booting Texters, Digital Upgrades, More Popcorn,” The Huffington Post, January 9, 2012, available here.
Original source: National Association of Theater Owners, the website for which is here.

Prescription Drug Sales

Expenditures on health care in the United States have been much in the news for years now. The prices for prescription drugs are among the fastest growing of the segments of this overall industry. And yet, prescription drugs make up only around 10 percent of all expenditures on health care.

Today’s market size is the size of the market for prescription drugs sold through retail outlets in 2000 and 2010. In 2000 58 percent of the prescription drugs sold through retail outlets were brand name drugs. In 2010 brand-name drugs accounted for 29 percent of those sales.

Geographic reference: United States
Year: 2000 and 2010
Market size: $145.57 and $266.39 billion respectively
Source: Table 159. Retail Prescription Drug Sales,” Statistical Abstract of the United States 2012, page 113, U.S. Census Bureau, September 27, 2011, available here.
Original source: National Association of Chain Drug Stores
Posted on January 24, 2012

DTC Drug Advertising

Ad Spending

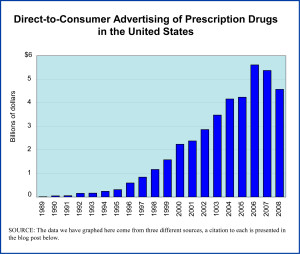
Direct-to-consumer (DTC) advertising of prescription drugs is a big business in the United States, as it is in New Zealand, the only other country in which this activity is legal. Anyone who watches TV for more than an hour or two a week will be more than familiar with the sorts of ads we are talking about, those that invariably end with an ominous list of potential side effects of the very drugs being pushed.

Until the late 1990s this advertising was quite limited by FDA regulations but in 1997 the FDA announced changes to those regulations (implemented in 1999) that freed up the pharmaceutical industry to start producing stylish ad campaigns for its most popular prescription drugs. The industry took full advantage, as the graph above clearly shows. Industry analysts suggest that the slowdown in spending starting in 2007 had more to do with the expiration of important brand name drugs (and their replacement with generics for which such spending is not done) than with the beginning of the recession.

Today’s market size is the amount spent by pharmaceutical companies on DTC prescription drug advertising in 2008.

Geographic reference: United States
Year: 2008
Market size: $4.57 billion
Source: For the data from 1989 through 2001: Francis B. Palumbo and C. Daniel Mullins, “The Development of Direct-to-Consumer Prescription Drug Advertising Regulations, Food and Drug Law Journal, Volume 57, Number 2, 2002. For the data from 2002 through 2005: Donahue Ph.D., Julie M., Marisa Cevasco, B.A. and Meredith B. Rosenthan, Ph.D., “A Decade of Direct-to-Consumer Advertising of Prescription Drugs,” The New England Journal of Medicine, August 16, 2007. For data from 2006 through 2008 the data are from Nielsen Media press releases.
Posted on January 20, 2012

Textbooks

An announcement is expected on Thursday, January 19th, from Apple Corporation having to do with their plans in the area of electronic textbooks. As one might imagine, much attention is being paid to this news by the academic world and the publishing world alike.

Today’s market size is an estimated total value of textbook sales in the United States based on a quote from Steve Jobs in the recently published biography about him by Walter Issacson. A brief look at the Census Bureau’s data on the topic suggests that the estimate is reasonable. The Census Bureau figure is provided here as well.

Geographic reference: United States
Year: 2007 and 2010
Market size: $7.06 billion in 2007 (Census data) and $8 billion (Jobs quote from 2010 which appears in the biography Steve Jobs
Source: “Sector 51: Information: Industry Series: Preliminary Product Lines by Kind of Business for the United States: 2007,” 2007 Economic Census, available here. The Jobs quote is from an article by Roger Yu in USA Today, titled “Technology, Costs, Lack of Appeal Slow E-textbook Adoption,” published on January 16, 2012 and available here.
Original source: U.S. Census Bureau
Posted on January 18, 2012

Peanut Butter

In the United States peanuts are popular. They form the basis for a staple of many American’s diets, peanut butter, a reasonably priced source of protein. As a consequence, there has been much press coverage lately about the likely increase in the price of peanut butter. The poor peanut crop in 2011 has caused raw peanut prices to rise and this increased price is expected to be seen on grocery store shelves shortly.

Today’s market size is the size of the market for peanuts for use in the production of peanut butter in the United States. In the year 2000 peanut butter accounted for the end use on half the peanut crop and in 2009 peanut butter accounted for 63.5% of peanut usage.

Geographic reference: United States
Year: 2000 and 2009
Market size: 753 million pounds and 1.19 billion pounds respectively.
Source: “Peanut Use by Type of Product,” part of the USDA’s Economic Research Service series of reports on the availability of foods by type, available here.
Original source: U.S. Department of Agriculture, Economic Research Service
Posted on January 17, 2012

Clothing Stores

The sale of clothing in the United States is done through a variety of retail outlets, only a portion of which are stores dedicated primarily to the sale of clothes. Today’s market size is the value of all sales made through clothing stores in 2010. Of the total, family clothing stores had the largest share, accounting for 54% of the sales. The other clothing store segments, with their share of total clothing store sales, are as follows: women’s clothing (23%), men’s clothing (4.9%) and all other clothing stores (7.2%).

Geographic reference: United States
Year: 2010
Market size: $158.8 billion
Source: “Estimates of Monthly Retail and Food Services Sales by Kind of Business: 2010,” Monthly Retail Trade Report, available online here.
Original source: U.S. Census Bureau
Posted on January 9, 2012

Advertising

Bar graph
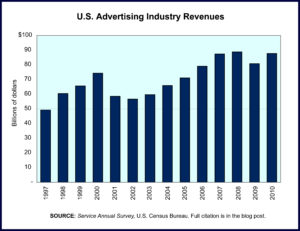
The reasons for placing an advertisement vary, from wishing to sell something to finding a partner, from raising funds to trying to alter public opinions about an institution, organization or candidate. Advertising is a big business, from the creation of the ad to buying the time or space for placing that ad to the strategies behind ad campaigns and nowhere is it as big a business as in the United States. For more on how the U.S. stands relative to all other nations when it comes to spending on advertising, check our earlier market size post, here.

The business of advertising is divided into categories by the Census Bureau which reports on each category: Advertising, Public Relations and Media Buying Agencies, Media Representatives, Display Advertising, Direct Mail Advertising and all other. Among these categories, three have shown the most growth over the last decade (from 2001 to 2009): Media Buying Agencies saw growth of 322%, Display Advertising grew by 68.4% and all other advertising grew 46.7%. The all other advertising category covers some of the online advertising business that does not fit into one of the other categories. One category saw losses over this period, the Direct Mail Advertising category which is particularly vulnerable to cutbacks during recessionary periods. Overall, the industry (NAICS 5418) saw revenue grow by 37.8% between 2001 and 2009 and another 8.7% between 2009 and 2010.
The chart we offer here shows revenue from all these sectors of the industry from 1997 through 2010. Of interest is the fact that the recession of 2001 had a larger impact on the industry’s revenues than did the larger recession of 2007–2009.

Geographic reference: United States
Year: 2001 and 2010
Market size: $58.634 and $87.836 billion respectively
Source: “Table 6.1 Professional, Scientific, and Technical Services (NAICS 54)—Estimated Revenue for Taxable Employer Firms: 2001 Through 2009,” 2009 Services Annual Survey, and “Table 1 – Selected Services Estimated Quarterly Revenue for Employer Firms Fourth Quarter 2003 Through Fourth Quarter 2010,” from the same series and available here.
Original source: U.S. Census Bureau
Posted on January 4, 2012

Cantaloupes and Other Agricultural Commodities

Being people who work with statistical data every day it was with great pleasure that we read recently that the USDA has decided to reverse its earlier decision to eliminate dozens of longstanding statistical reports that it has maintained for decades. Turns out the industries being covered by these reports find them extremely valuable, essential really. So, industry leaders explained just how important those reports are to their planning and financing and the USDA reconsidered. We find this development most encouraging. Some things really are best done at the large scale by an entity not motivated by its own commercial interests.

Today’s market size, selected from a long list of in-depth USDA commodity reports, is the market for domestic cantaloupe. It is the value (farm value or wholesale value) of cantaloupes harvested in in the United States in 2010 when 77,430 acres were planted with cantaloupe.

Geographic reference: United States
Year: 2010
Market size: $314.4 million
Source: William Neuman, “U.S. Reverses Decision To End Farming Reports,” The New York Times, December 24, 2011, page B3, available online here. The USDA report on cantaloupes can be found online here. The figure used here is from Table 3—U.S. Cantaloupe: Acreage, Yield, Production, and Value, 1950-2010.
Original source: U.S. Department of Agriculture
Posted on December 30, 2011

Books

During this season of gift-giving, books are one category of gift that has seen some growth in recent years. The publishing industry is going through significant changes as it adjusts to huge shifts in the world of publishing, originating for the most part from the digitizing of its products and the move to selling electronically, whether traditional books or digitized books.

Today’s market size is the size of the U.S. book publishing industry based on net sales revenues. The market sizes listed below are based on traditional publisher sales— regardless of the format of the books sold—but do not include sales made by self-publishers or some very small imprints.

Geographic reference: United States
Year: 2008 and 2010
Market size: $26.5 and $27.9 billion respectively
Source: “BookStats Overall Highlights,” a report by the Association of American Publishers and made available online here.
Original source: Association of American Publishers
Posted on December 23, 2011

Toys & Games

Today’s market size post is the size of the market for toys and games in 2007 based on total retail sales made in any retail outlet, from grocery stores and pharmacies to department stores and toy stores. For those wishing to investigate further, the market size posted here is based on the product category “toys, hobby goods and games” which is designated by the U.S. Census Bureau with the product code 20460.

Geographic reference: United States
Year: 2007
Market size: $90.55 billion
Source: “Sector 44: Retail Trade: Industry Series: Preliminary Product Lines Statistics by Kind of Business for the United States: 2007,” 2007 Economic Census, released on September 29, 2009available online here.
Original source: U.S. Census Bureau
Posted on December 21, 2011

Caviar

Caviar is one of those luxury items that has not seen a great decline during the recession and financial crisis that started in 2007 and 2008. In fact, demand for caviar has been strong and since overfishing in the Caspian Sea has left the sturgeon species depleted in that region, farms are emerging around the world to produce caviar and meet the strong demand.

In the 1970s, an estimated 550 tons of caviar were produced annually around the world. This caviar came primarily from wild sturgeon. Forty years later, production comes primarily from farm-raised sturgeon and while production is down sharply from the highs of the 1970s, it is expected to continue rising into the foreseeable future.

Today’s market size is the estimated total world production of caviar in 2010.

Geographic reference: World
Year: 2010
Market size: 250 tons with a wholesale price in the range of $500 to $600 per pound.
Source: Raphael Minder, “Caviar Migrates Beyond The Caspian Region,” The New York Times, December 17, 2011, page B3.
Original source: Patrick Williot
Posted on December 17, 2011

R&D Expenditures Nationally

An encouraging statistic for today’s market size post, the growth rate in expenditures on research and development in the United States. Between 1980 and 2008 total spending on R&D grew by 529 percent.

Geographic reference: United States
Year: 1980 and 2008
Market size: $63.2 billion and $397.6 billion respectively
Source: “Table 799. Research and Development (R&D) Expenditures by Source and Objective,” Statistical Abstract of the United States 2012, page 522, a PDF version of that page is available here.
Original source: U.S. Census Bureau
Posted on December 16, 2011

Toiletries Market

Manufacturers of toiletries—that whole long list of things found in the bathroom for personal care: shampoo, deodorant, hand lotion, face crème, foot crème, toothpaste, perfume, hair mousse, etc.—saw robust growth over the period 1997 through 2007 but lost many of those gains between 2007 and 2009, a pattern repeated in so many industries.

Today’s market size is the size of the toiletries market as measured by U.S. manufacturers’ shipments in 1997, 2007, and 2009.

Geographic reference: United States
Year: 1997, 2007 and 2009
Market size: $24.3, $48.8 and $38.5 billion respectively
Source: 1997 Economic Census, 2007 Economic Census, and the 2009 Annual Survey of Manufactures.
Original source: U.S. Census Bureau
Posted on December 15, 2011

Syrian Import Market

For our market size post today we turn to the newest edition of an important yearly statistical compilation put out by the United Nations. The work is cited fully in the source note below. Data for most countries are provided through last year in the 2010 International Trade Statistics Yearbook, but the data for Syria only extend through 2009 and due to the serious political upheaval going on there now it is unlikely that reliable statistics will be available from Syria in the near future.

Today’s market size is the size of the Syrian market for imports. Over the last decade (2000-2009), Syria saw the value of its imports rise by 180%. The value of its exports also rose but by a smaller percentage (126%) leading to a negative balance of payments in 2009.

Geographic reference: Syria
Year: 2009
Market size: $15.44 Billion
Source: “Total Imports and Exports by Regions and Countries or Areas (Table A)”, 2010 International Trade Statistics Yearbook, Vol. 1—Trade by Country, June 16, 2011, available online here.
Posted on December 13, 2011

Ham Radio Operators

Amateur radio, also known as ham radio, uses a designated “radio frequency spectrum for purposes of private recreation, non-commercial exchange of messages, wireless experimentation, self-training, and emergency communication,” according to Wikipedia. Ham radio operations are coordinated by the International Telecommunication Union. Ham radio operators must demonstrate knowledge in electronics and regulations in order to obtain a license for their radio station. Once licensed, the ham radio operator can communicate with people throughout the world.

Amateur radio began in the late 19th Century. By the late 20th Century, the hobby’s
popularity was waning; however, in the early 21st Century, ham radio saw a surge in the number of enthusiasts. By 2010, the number of ham radio licenses in the United States had increased 60 percent since 1981. In 2007, the United States Federal Communications Commission stopped requiring knowledge of Morse Code in order to obtain a license. The increase in ham radio licenses has been attributed to this. In 2010 alone, there were 30,000 new applications for ham radio licenses.

Today’s market size is the total number of people that have ham radio licenses in the United States.

Geographic reference: United States
Year: 2010
Market Size: 700,000
Source: Matt Sepic, “Ham Radio Growing in the Age of Twitter,” NPR, April 5, 2010, available online here and “Amateur Radio,” Wikipedia, available online here.
Posted on December 9, 2011

E-Commerce Sales on Cyber Monday

The estimate of how much is sold on a single day is of limited use to anyone but it is something reported on and tracked by the retail industry. And when that day is either the day after Thanksgiving or, for the online world, the Monday following Thanksgiving, interest in the estimates is particularly high as they are believed to foreshadow the level of retail sales for the rest of that year.

Today’s market size is an estimated range of the total sales generated by e-commerce websites on Monday, November 28, 2011.

Geographic reference: World
Year: Nov. 28, 2011
Market size: $1.17 to $1.2 billion
Source: Claire Cain Miller, “A Shopping Day Invested for the Web Comes Alive,” The New York Times, Nov. 29, 2011, page B1, available online here.
Original source: comScore and IBM Benchmark
Posted on December 8, 2011

Medicare Enrollment

Medicare Enrollment Stats

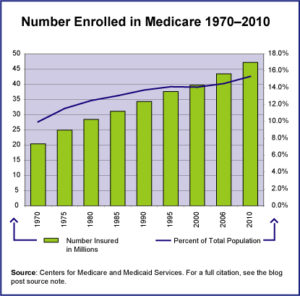
Today is the 70th anniversary of the attack on Pearl Harbor. Today is also the final day of the Medicare annual enrollment period. Only one of these topics lends itself to a market size post. Worth noting—and by way of tying these two things together a little—is the fact that anyone (now an American citizen) who was around on the day that Pearl Harbor was attacked, is now eligible for Medicare.

Today’s market size is the number of people enrolled in the Medicare health insurance system in the United States in 2010. The graphic provides data on enrollment from 1970 to 2010 and shows how this population relates to the total U.S. population over this period.

Geographic reference: United States
Year: 2010
Market size: 47.2 million
Source: “Table I.1 Medicare Enrollment Trends,” part of the statistical offerings on the Federal Government’s CMS website here.
Original source: Center for Medicare and Medicaid Services, U.S. Department of Human Health and Services
Posted on November 7, 2011

Data Loss

That sinking feeling… we have all probably been there, face to face with a computer we count on that has begun to act up. The loss of data resulting from computer hardware failure, software corruption or even human error, is painful and costly. Measuring the loss is a difficult task but one that was undertaken by Dr. David M. Smith and reported on in the article from which we source today’s market size post. A full citation is below.

Specifically, the market size presented here is the estimated annual loss to businesses in the United States due to data losses on PCs and laptops. It dates back to 2003 but it provides us with a scope for the problem and a scope that we know has only grown. For further details, check the source article which defines things clearly.

Geographic reference: United States
Year: 2003
Market size: $18.2 billion
Source: David M. Smith, “The Cost of Lost Data,” Graziadio Business Review, 2003, available online here.
Original source: Graziadio School of Business and Management, Pepperdine University
Posted on December 1, 2011