Newspapers

Newspapers

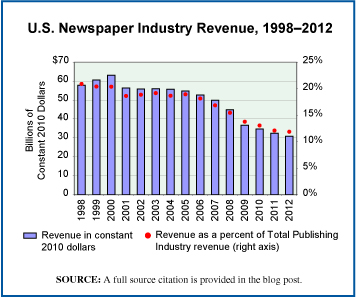
The news this week about The Washington Post being purchased for $250 million by Amazon founder Jeff Bezos made us want to update an earlier post about the newspaper industry, here. And so, we present today’s market size post, including a chart that shows U.S. newspaper industry revenues, annually, since 1998. Clearly, an industry going through significant change.

Geographic reference: United States
Year: 2000 and 2012
Market size: $50.29 billion and $32.04 billion respectively
Source: “Table 3.0.1 Information Sector Services (NAICS 51) — Estimated Revenue for Employer Firms: 1998 Through 2004,” Service Annual Survey, April 2006, page 24, available online here, and annual updates of the same which are available on the Census Bureau’s site here.
Original source: U.S. Census Bureau
Posted on August 9, 2013

Moroccan Argan Oil Hair Products

Some say it strengthens hair and tastes good drizzled on a salad. Moroccan argan oil is the latest new trend in the personal-care market. Argan oil is appearing in more and more products as one of the highlighted ingredients. Under fair trade production standards, dime-sized kernels from acorn-shaped nuts are extracted by hand by Moroccan women earning the equivalent of $4 a day. These kernels are then ground down and the oil extracted. The wholesale price of argan oil in 2011 was approximately $30 per liter while in beauty boutiques around the world, a liter of argan oil sells for around $400.

In 2012, Morocco exported 700 tons of the oil, twice that exported in 2007. Today’s market size is the number of hair products containing argan oil that were introduced in 2008 and 2012.

Geographic reference: United States
Year: 2008 and 2012
Market size: 29 and 588 respectively
Source: Matthew Boyle, “Cosmetics’ Hot Elixir: Argan Oil From Morocco,” Bloomberg Businessweek, July 25, 2013, available online here.
Original source: Mintel
Posted on August 6, 2013

High-Deductible Health Insurance Plans

High-deductible health insurance plans are insurance policies in which consumers pay lower monthly premiums but incur higher out-of-pocket costs when visiting doctors and hospitals. In the past decade, high-deductible health plans have become more common. Some believe that these insurance policies will reduce overall health spending, especially on discretionary services, and thereby keep premiums affordable. But some studies show that while trips to the emergency room are reduced, especially for minor ailments, many consumers are also forgoing getting treatment for more serious conditions such as kidney stones or heart trouble. And, when treatment is sought, the cost of treatment is higher due to the increased severity of the illness.

Today’s market size is the number of consumers in the United States with high-deductible health insurance plans as of early 2013, a three-fold increase since 2006.

Geographic reference: United States
Year: 2013
Market size: 13.5 million
Source: Ashley Griffin, “Men Put Off Health Care When It Costs More,” Lansing State Journal, July 21, 2013, pages 1C, 4C
Posted on August 2, 2013

Detroit Housing Stock

Much has been written in the national press about Detroit over the last week and in the wake of that city’s filing for bankruptcy protection on July 18th. The debates about how the situation was allowed to get so bad and what is to be done now have been lively. For those of us who live in the shadow of this once great city, none of this is new. These debates have raged here for years, and the march to insolvency has been a long one, like a Greek tragedy playing out in slow motion. It is the true scope of the challenge that is difficult for those not familiar with Detroit to fully understand.

Today’s market size post is the size of the housing market in the City of Detroit, more specifically, the total number of housing units in that city. The figure provided includes housing units that are not habitable. In fact, when one calculates the percentage of housing units in Detroit that are actually occupied the number is only around 20%. To further place this housing stock figure into context, the population of the city is also provided below as is the median sale price of a home in Detroit.

Geographic reference: Detroit
Year: 2011
Market size: Housing Units: 1,886,537
Market size: Population: 701,500 (2012)
Market size: Median Home Sale Price: $9,568 (in May of 2013 this median price had risen to $11,100)
Source: [1] “Detroit (city), Michigan,” State and County QuickFacts, a presentation of current U.S. Census data originally made available online here. For updated Census data, see the Further reading section below. [2] JC Reindl, “Chapter 9 Unlikely to Hurt Home Prices,” Detroit Free Press, July 21, 2013, page B1. [3] Charles B. Stockdale, Douglas A. McIntyre and Michael B. Sauter “American’s Ten Sickest Housing Markets,” NBCNews.com, August 5, 2011, available online here.
Original source: U.S. Census Bureau, S&P/Case-Shiller and Realcomp
Further reading: “Selected: Detroit city, Michigan; Michigan,” Quick Facts, U.S. Census Bureau available online here; “Detroit city, Michigan,” American FactFinder, U.S. Census Bureau available online here; “Detroit, MI Schools,” AreaVibes available online here.
Posted on July 23, 2013

“Big Ten” Conference TV Revenues

The “Big Ten Conference” is the oldest Division I college athletic conference in the United States. It has twelve member institutions, despite its name, and is slated to add two more in 2014. These are flagship research universities in their respective states, well-regarded academically and with relatively large student enrollment. They are located primarily in the Midwest.

In the Big Ten conference, revenue from television contracts helps to cover the cost of coaches salaries, scholarships, travel and game-day expenses. TV revenue also helps to cover the cost of athletic programs that do not bring in sufficient revenues to sustain themselves, such as tennis, gymnastics and rowing.

The National Collegiate Athletic Association requires athletic programs to maintain at least 16 varsity sports. The Big Ten conference requires 20. According to Sports Illustrated, the expansion of the Big Ten conference to 14 schools in the 2014-2015 school year will help to nearly double the per-school television contract revenue by 2017-2018. The data shown are on a per-school basis.

Geographic reference: United States
Year: 2012-2013 and 2017-2018
Market size: $25 million and $40 million, respectively, per school
Source: Editorial Staff, “MSU Athletics Win Off The Field, Too,” Lansing State Journal, July 14, 2013, page 7F and Chris Solari, “Power Play,” Lansing State Journal, July 14, 2013, pages 1D, 5D.
Original source: Sports Illustrated
Posted on July 16, 2013

Hospitals in the United States

Hospitals2

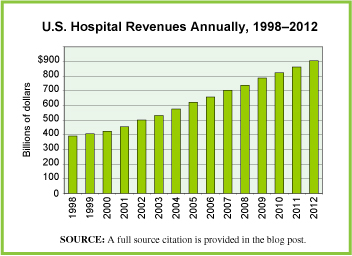
Today we update an earlier post on a part of the huge health services industry, namely, hospitals. The graph shows the total annual revenues of all U.S. hospitals as they are defined by the Census Bureau, below, over a fifteen year period. Annual revenues for this industry appear to rise, regardless of economic conditions, recessions, financial crisis, or business cycles.

This industry is identified within the industry coding system, NAICS, with the code 622 and is defined by the Census Bureau as including hospitals whose primary business is to “provide medical, diagnostic, and treatment services that include physician, nursing, and other health services to inpatients and the specialized accommodation services required by inpatients. Hospitals may also provide outpatient services as a secondary activity. Establishments in the Hospitals subsector provide inpatient health services, many of which can only be provided using the specialized facilities and equipment that form a significant and integral part of the production process.”

Geographic reference: United States
Year: 2005 and 2012
Market size: $620.85 billion and $904.47 billion respectively
Source: “Table 1 – Selected Services, Estimated Quarterly Revenue for Employer Firms,” Annual Benchmark Report for Services through 2012, a series of reports put out by the Census Bureau in conjunction with their Service Annual Survey, published every non-Economic Census year. The Service Annual Survey reports are accessible on the Census web site here.
Original source: U.S. Department of Commerce, Economics and Statistics Administration, U.S. Census Bureau
Posted on July 10, 2013

Hearing Aids and Instruments

The market for hearing aids is on a growth path as the population in the industrialized world ages. Demographics point in one direction for this industry, up. The rising costs of health care generally are of some concern to this industry because it suggests that changes are coming in how medical insurance systems will handle reimbursements for such devices. Demand, however, is expected to rise.

Today’s market size is the estimated number of hearing instruments sold around the world each year, based on figures for 2011. The number of units sold does not include Cochlear implants nor Middle-Ear implants, rather it refers to hearing aid devices that do not require surgical implantation.

Geographic reference: World
Year: 2011
Market size: 10 million units valued at $6.5 billion, which includes hardware only.
Source: “Hearing Loss Treatment Market Profile,” Hearing Instruments: Hearing Loss = Profits, May 24, 2012, page 32, Cheuvreux–Credit Agricole Group. This investment report is available online here.
Original source: CA Cheuvreux
Posted on July 3, 2013

Elevators & Escalators

Elevators and escalators are an almost invisible part of the infrastructure of large buildings, invisible only in that they are taken for granted by most of their users. For the industry involved in making and servicing these complex machines, invisibility may well be just fine, after all, when attention is drawn to them it is often for all the wrong reasons—slowness, jerkiness, and/or safety problems.

Leaders in this industry include Otis, Schindler, ThyssenKrupp and KONE, each representing around 20% of the world market. The areas of greatest growth in new installations are areas of the world that are seeing the largest increase in both urbanization and high-rise construction. Maintenance of existing machinery is a part of the business that is strongest in the well-established industrialized world and is an important part of this industry.

Today’s market size is the estimated number of new elevator and escalator installations around the world during 2012 as well as the installed base that year.

Geographic reference: World
Year: 2012
Market size: 670,000 new units added to a base of slightly over 11 million
Source: “Elevator and Escalator Market,” published in 2013 by KONE and available here with geographical breakdowns of the global market.
Original source: KONE
Posted on July 1, 2013

Public Transportation—Lansing, Michigan Area

The Capital Area Transit Authority (CATA), in Lansing, Michigan, is the largest public transit provider in the tri-county area near the State Capitol, which includes Ingham, Clinton, and Eaton counties. CATA has been operating public transportation in the mid-Michigan area since 1972 and has been twice named the best transit system of its size in North America by the American Public Transportation Association.

Ridership grew steadily during the 1970s, before leveling off during the 1980s and most of the 1990s. During the 1980s and 1990s, the number of rides fluctuated around 3 to 4 million annually. In 1999, CATA took over the Michigan State University bus service. Since then ridership has increased nearly 3-fold. In contrast, the population of the tri-county area grew by 22.6% from 1970 to 2010. In 2012, CATA set a third consecutive yearly record for number of rides. Data represent the number of rides annually on CATA vehicles in 1972 and 2012.

Geographic reference: Lansing, Michigan
Year: 1972 and 2012
Market size: Fewer than 1 million rides and 11.86 million rides respectively
Sources: “Growth in Ridership Remains Strong”, CATA 2013 Community Report: Moving You Toward Your Dreams, June 2013, p. 4; “Riding High with Record Ridership,” CATA 2012 Community Report 40th Anniversary Edition: Greater Lansing on the Move, August 2012; “CATA Demand Grows with Community Need,” CATA 2011 Community Report: Greater Lansing on the Move, August 2011; Tri-County Regional Planning Commission, “Tri-County Regional Growth: Choices for Our Future,” Draft Report, August 2002 available online here; “Ingham County, Michigan” available online here; “Clinton County, Michigan” available online here; and “Eaton County, Michigan” available online here;
Posted on June 26, 2013

Venture Capital for Clean Technology

Clean technology is a somewhat ambiguous term but one heard more and more often today. According to Clean Edge, a research firm specializing in the study of this sector, clean technology refers to a diverse range of products, services, and processes that make use of renewable materials and energy, strive to use fewer natural resources, and to reduce emissions and wastes in both the process of their production and their use. Such companies may be in fields like renewable energy, electric motors, green chemistry, water use management, public transportation, sustainable agriculture, and areas of information technology specifically aimed at helping to reduce or eliminate emissions and waste in any number of processes.

Today’s market size is the amount invested by venture capital firms around the world in clean technology endeavors. The amounts for both 2011 and 2012 are shown. Clear from these data is that investment in such endeavors fluctuates greatly from year to year, despite the seeming relentless admiration for such clean technologies in the media at large. The New York Times article from which this market size comes (a link to which is provided below) tells an interesting story about how one company is using niche market products to help bridge the gap between proof of concept and small scale production to high volume production, a gap often referred to in the industry as Death Valley.

Geographic reference: World
Year: 2011 and 2012
Market size: $9.6 billion and $7.4 billion respectively
Source: Diane Cardwell, “A Side Trip on the Road to Clean Fuel,” The New York Times, June 23, 2013, page B1, and available online here.
Original Source: Cleantech Group’s i3 Platform
Posted on June 24, 2013

High School Volleyball

Today’s market size is the number of high school students participating in volleyball in the United States during the academic year, 2011-2012. In that school year, participation in high school volleyball was dominated by women. Of all the sports in which both males and females compete at the high school level, volleyball was the one in which female participation totally dominated the statistics. Young women make up 89.5% of high school volleyball players. The source document, linked to below, provides participation data on all the major sports programs in U.S. high schools.

Geographic reference: United States
Year: 2011-2012
Market size: 468,370
Source: “2011-2012 High School Athletics Participation Survey,” August 2012, available online here.
Original Source: National Federation of State High School Associations
Posted on June 18, 2013

False Lashes

Everything old is new again, or so the saying goes. In the first decade of the century, false eyelashes have been one of the fastest growing of the cosmetic industry’s many categories. Today’s market size is the total estimated revenue brought in by the sale of false eyelashes in the United States in 2000 and again in 2010.

Geographic reference: United States
Year: 2001 and 2010
Market size: $15 million and $44 million respectively
Source: “Look No Further: Frequently Asked Questions,” Novalash Eyelash Extensions, website posting is available here. Brendan I. Koerner, “The Goods; Fake Lashes: Not Just For Tammy Faye,” The New York Times, April 25, 2004, and available online here.
Posted on June 17, 2013

Military Active Duty

Today’s market size is the number of active duty military personnel in the United States and in China. When looking at comparative national data, always be sure to take into account how the measure… measures up, if you will, on a per capita basis.

Geographic reference: China and United States
Year: 2011
Market size: China: 2,285,000 (equal to 1.69 persons per 1,000 in the population)
Market size: United States: 1,430,000 (equal to 4.52 persons per 1,000 in the population)
Source: “The Growth of The Chinese Military,” Military Education, A Non-Government Military Education Resource, available online here. Various figures were also taken from the CIA World Factbook, available here.
Original Source: Central Intelligence Agency
Posted on June 14, 2013

Trucking Industry

Freight Transport by Mode Pie Chart

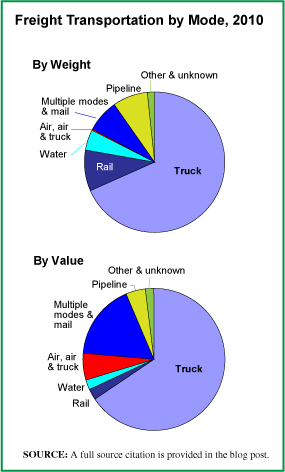
In the United States, trucks move more freight than do all the other forms of transportation combined and this is true when measured in terms of tons moved (68.2% in 2010) as well as in terms of the value of that freight (65.5%). The pie chart shows the percentage of total freight moved by each type of transportation vehicle, both in terms of weight and value. What is clear and quite logical is that the value of items moved by air is quite high but those items don’t weigh much. To move heavier freight, such as construction materials, heavy machinery, agricultural commodities, coal and the like, the nation’s highways, waterways and railways are the economical answer, and for the heaviest items, the latter two networks are the more economical.

Today’s market size is the weight of domestic freight moved by trucks in the United States last year and the revenue those movements produced for the trucking industry.

Geographic reference: United States
Year: 2012
Market size: 9.4 billion tons moved, generating $643 billion in revenue for the trucking industry
Source: Benjamin Preston, “Wheelies: The Stingray’s Stinger Edition,” Wheels.blogs.nytimes, May 30, 2013, available here. The data used to produce the graphic are from Freight Facts and Figures 2011, “Tables 2-1, 2-1M and 2-2.
Original Source: American Trucking Association and the U.S. Department of Transportation, Federal Highway Administration.
Posted on June 5, 2013

Used Hybrid Cars

The used car market is doing quite well having benefited from the sudden decline of automobile leases during the aftermath of the financial crisis of 2008–2009. Expiring auto leases are a primary source of cars feeding the used car market. Hybrid gas-electric cars are a small subset of the overall used car market, primarily because they are a small part of the overall market. Another reason has to do with the fact that hybrid gas-electric cars need to have new battery systems installed after either five years of use or 100,000 miles, on average. The price of these battery systems, depending on the vehicle, run anywhere from $2,000 to $6,000.

Today’s market size is the estimated number of used hybrid gas-electric vehicles on the U.S. used car market in early 2013.

Geographic reference: United States
Year: 2013
Market size: 415,000 vehicles
Source: Ann Carrns, “Tips for Buying and Servicing a Used Hybrid Car,” The New York Times, May 30, 2013, available online here.
Original Source: Edmonds.com
Posted on June 4, 2013

Peppermint Oil

Chart

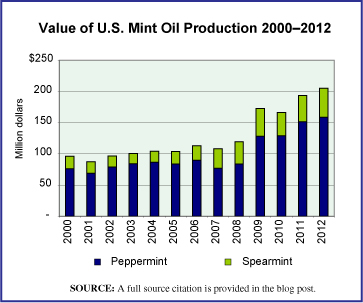
The price of mint oil, both peppermint and spearmint, has gone up sharply since the recession that started at the end of 2007. The chart shows the value of U.S. mint oil production from 2000 through 2012. Much of the increase has been due to the increased price of mint oil and not increased production. In fact, the production of peppermint oil fell over this period by 6.7% while the total value of the peppermint oil produced rose by 108%. Spearmint oil production over this period grew by 8.7% and the value of that oil grew by 134%.

Today’s market size is the number of pounds of peppermint oil produced in the United States in 2000 and 2012 and the value of the oil produced each year.

Geographic reference: United States
Year: 2000 and 2012
Market size: 7,063 pounds valued at $76.28 million and 6,592 pounds valued at $158.86 million respectively
Source: Crop Values – 2012 Summary, February 2013, page 43 and earlier reports in this annual series. These reports are produced by and put out annually by the United States Department of Agriculture, accessible in multiple formats on their website here.
Original source: USDA
Posted on May 24, 2013

Organic Products

Currently there are more than 17,000 certified organic businesses in the United States. In 2011, sales of organic foods made up more than 4% of all food and beverage sales. In 2012, sales of organic products grew 10%. Growth in this industry is expected to continue due to increasing consumer demand.

Today’s market size is the dollar amount of organic product sales in United States in 2012.

Geographic reference: United States
Year: 2012
Market size: $35 billion
Source: Mary Clare Jalonick, “Demand Aids Organic Industry’s Sway,” Lansing State Journal, May 19, 2013, page 6A.
Posted on May 22, 2013

Apparel Exports from Bangladesh

The enormous loss of life resulting from the collapse of a garment factory in Bangladesh a few weeks ago has brought the media spotlight onto that country, as well as the global network of low-end apparel manufacturing. Bangladesh, with a population of approximately 164 million, is the world’s second-largest exporter of apparel. The first largest is China with 1.35 billion people.

Today’s market size is the value of all apparel exports from Bangladesh last year. Of that total, a quarter came as general imports to the United States ($4.47 billion).

Geographic reference: Bangladesh
Year: 2012
Market size: $18 billion
Source: Adam Davidson, “Clotheslined,” The New York Times Magazine, May 19, 2013, pages 16-17.
Original source: A&M University, Texas, Prof. Munir Quddus
Posted on May 20, 2013

Cast Iron Cookware

Photo of cast iron pot and pan

In the past 10 years, sales of cast iron cookware has gone from 4 percent to 10 percent of the entire cookware market. Lodge Manufacturing, founded in 1896 in the United States, and Le Creuset, founded in 1925 in France are two of the oldest manufacturers of cast iron cookware. Data show industry sales of cast iron cookware in 2011.

Geographic reference: United States
Year: 2011
Market size: $114 million
Source: Josh Ozersky, “A Pan for All Seasons,” Time, March 26, 2012, available online here.
Posted on May 14, 2013

Expenditures on Reading Materials

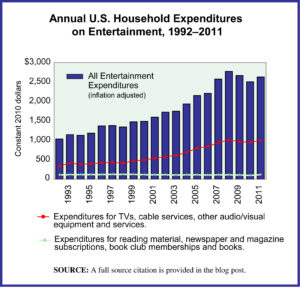
The U.S. Bureau of Labor Statistics (BLS) carries out an annual survey of millions of households to track what they spend money on, by category. The resulting data has been collected over decades and seeing the trends that these data expose over time is very interesting.

The graph presented here is made with BLS data from this survey series. It shows inflation-adjusted household expenditures on all categories of entertainment, as well as two subsets of expenditures, (1) those for TVs, audio/video equipment and services, such as cable subscriptions and (2) expenditures for reading material. The full category of entertainment expenditures is broad and includes things such as:

—Fees to attend concerts, sporting events, movies, and sporting clubs/fraternal organizations.
—TVs, radios and other audio/video equipment as well as subscriptions for cable, premium TV and the like.
—Pets, toys and hobbies, as well as all the services and equipment related to those.
—Bikes, athletic shoes, and equipment for camping, exercising, fishing, and all sports, as well as boats and docking fees, fireworks, pinball machines and video consoles.

Today’s market size is the average spent by U.S. households on reading material in 1994 and in 2011. The figures do not include expenditures for any textbooks or reading material purchased as part of a formal educational program. The transition to digital which is taking place in most areas of publishing is not well tracked by this BLS survey series. It is unclear from studying the survey results, for example, whether or not all online subscriptions to newspapers and magazines are consistently captured in the expenditure category “Reading.” Over time this will change as time allows data collection organizations, like the BLS, to adjust to the digital transition. Data collection organizations can only adjust as quickly as the industries they cover—in this case, the publishing industry—adjust to such dramatic changes.

Geographic reference: United States
Year: 1994 and 2011
Market size: $165 and $115 respectively. These figures translate to a national gross household spending on reading materials for each of those years of $16.86 billion and $14.06 billion respectively
Source: “Consumer Expenditure Survey,” Multiyear Tables: 1992-99 Multiyear Table, 2000-05 Multiyear Table, and 2006-11 Multiyear Table, all available on the Bureau of Labor Statistics website here.
Original source: U.S. Department of Labor, Bureau of Labor Statistics, Consumer Expenditure Surveys
Posted on May 9, 2013