Moving Services

Have you moved to a new residence in the past year? If you have, you’re not alone. According to the U.S. Census Bureau, nearly 32.4 million people changed residences from 2017 to 2018. While this might seem like a high number, as a percentage of the total population, it’s the lowest it has been in at least 70 years. From 1948 through the mid-1960s, the percentage of the population who moved during the year stayed steady around 20%, then declined from the mid-1960s to the 1980s, spiking briefly to 20.2% in 1984-1985. Since then the percentage of movers has trended downward, reaching 10.1% in 2017-2018. Most were interstate moves, 60.51%, but this was down from 65.51% a year earlier. According to the U.S. Census Bureau’s Current Population Survey, most people move to establish a new household or for other family reasons.1 Moving due to a new job or job transfer ranked third.

Today’s market size shows the total revenues for moving services in the United States. Companies in this industry transport used household, institutional, or commercial furniture and equipment via local or long-distance truck, as well as provide related packing and storage services. Various sources provide a wide range of total revenue figures. The American Moving and Storage Association states that annual revenues in this industry total $12.6 billion. IBISWorld reports revenues of $17.9 billion in 2019. The figure stated below is from Dun & Bradstreet. Nearly 70% of the revenue results from local and long-distance transportation services, followed by warehousing and storage services (20.2%). Packing and packaging services account for 7.5% of the total. Leading companies in this industry include UniGroup, which owns United Van Lines and Mayflower Transit; SIRVA, which owns Allied Van Lines and northAmerican Moving Services; and Atlas Van Lines. However, nearly 50% of companies in this industry are small businesses, employing fewer than 5 people. Only 8.5% of companies employ 100 people or more.

1 Other family reasons unrelated to establishing a new household or change in marital status. Change in marital status ranked fifth after moving to be closer to a job.

Geographic reference: United States
Year: 2019
Market size: $15 billion
Sources: “Moving Services Industry Profile,” Dun & Bradstreet First Research, June 3, 2019 available online here; “CPS Historical Migration/Geographic Mobility Tables,” U.S. Census Bureau, November 27, 2018 available online here; “About Our Industry,” American Moving and Storage Association available online here; Michael C., “Moving Trends & Relocation Industry Analysis,” Movers Development, May 10, 2019 available online here; “Moving Services Industry Insights From D&B Hoovers,” D&B Hoovers available online here; “Moving Services Industry in the US – Market Research Report,” IBISWorld, July 2019 available online here.
Image source: Clker-Free-Vector-Images, “movers-packing-box-light-vase-24403,” Pixabay, April 3, 2012 available online here.

Staff Training

staff training

According to the Bureau of Labor Statistics, in November 2018, more than 6.0 million people were unemployed in the United States. That same month, nearly 6.9 million job openings were reported. Forty-five percent of employers have jobs open, they say, because they cannot find qualified applicants to fill those positions. In a CareerBuilder survey, 66% of employers reported that they planned to hire and train workers who may not have the skills needed but who showed potential.

In 2018 companies spent an average of $986 per employee on training. The highest percentage of training dollars budgeted, 39%, went to training hourly workers, followed by non-managerial salaried workers (27%) and salaried managers (24%). Only 10% of the average training budget went to train executives. Training can take many forms, from instructor-led classroom learning to webcasts to self-directed online courses. In practice, most companies use a variety of methods to train their workers. Of those that use only one method, most prefer instructor-led classroom learning, followed by online or computer-based courses and virtual classrooms or webcasts.

More companies expect to purchase online learning tools and systems next year than any other type of training product. At least some mandatory or compliance training is done online at 82% of companies, with 28% of companies providing this training completely online. A vast majority of companies also use online training for sales training, IT systems training, and desktop application training. Online training is least likely to be used for onboarding and executive development.

Today’s market size shows the total amount companies in the United States spent on training in 2018. This figure includes payroll for staff assigned to do the training and spending on external products and services, travel, facilities, and equipment. Overall spending in 2018 declined from $93.6 billion in 2017 due to a 33.5% decrease in expenditures for travel, facilities, and equipment. However, spending on outside products and services increased during this time period, from $7.5 billion to $11.0 billion. Payroll for training staff also increased, from $41.6 billion to $47.0 billion.

Geographic reference: United States
Year: 2018
Market size: $87.6 billion
Sources: “2018 Training Industry Report,” Training, November/December 2018, pages 18-31 available online here; “Job Openings and Labor Turnover – November 2018,” News Release, Bureau of Labor Statistics, U.S. Department of Labor, January 8, 2019 available online here; “Labor Force Statistics From the Current Population Survey: (Seas) Unemployment Level,” Series ID: LNS13000000, Bureau of Labor Statistics, U.S. Department of Labor, Data extracted on February 6, 2019 available online here; “44 Percent of Employers Plan to Hire in the New Year, According to CareerBuilder’s Annual Forecast,” CareerBuilder Press Room, January 8, 2018 available online here.
Image source: claude_star, “convention-conference-meeting-1410870,” Pixabay, May 24, 2016 available online here.

Social Media Analytics

social media analyticsWhat do people think of our product? How successful was our last marketing campaign? Not that long ago if businesses wanted to know the answer to these questions they would have to hire market research firms that would poll select customers about their thoughts. With the widespread use of social media and improved natural language processing and machine learning algorithms, social media analytics tools can provide a more comprehensive picture of how consumers feel about companies and their products.

Social media analytics software is used to gather data from various social media sites in order to guide a business’ marketing strategy. Each social media platform offers its own analytics interface, but for companies whose presence on social media is multi-faceted, a more robust software option is necessary, one in which data is tracked on several platforms at once, and in some cases, in real time. Sophisticated software with natural language processing will attempt to understand meaning and context in text and human speech. The analyzed data can then be used to target marketing campaigns, improve customer service, or improve existing products, among others.

Today’s market size shows the amount businesses around the world spent in 2016 and are projected to spend in 2022 on social media analytics tools. According to the source, cloud-based social media analytics tools are expected to experience the highest growth during this time period due to their cost-effectiveness, scalability and flexibility in allowing businesses to oversee their campaign management and performance monitoring. Currently, there are more than 25 key companies worldwide that create social media analytics tools.

Geographic reference: World
Year: 2016 and 2022 projected
Market size: $2.1 billion and $9.5 billion respectively
Sources: “Social Media Analytics Market: Global Market Size to Reach $9463.54 Million by 2022,” Nasdaq GlobeNewswire Press Release, December 22, 2017 available online here; Margaret Rouse and Ed Burns, “Social Media Analytics,” TechTarget, June 2017 available online here; Margaret Rouse and Craig Stedman, “Unstructured Data,” TechTarget, January 2018 available online here.
Image source: Maialisa, “marketing-social-media-advertising-1573711,” Pixabay, August 8, 2016 available online here.

Employment Websites for Freelancers

Man working with a laptop and notebookAccording to the survey, Freelancing in America: 2016, commissioned by UpWork in partnership with Freelancers Union, 35% of the workforce—55 million people—in the United States were freelancers in 2016. As of June 2017, there were at least 79 active employment websites for freelancers. Employers post jobs they would like to outsource and freelancers apply for or bid on the work. Many of these jobs are temporary, an employer wanting to outsource a particular project for example. Most of the jobs listed on these sites allow the worker to work remotely.

Pricing for these services vary. Some of the firms that run these websites charge employers, freelancers, or both a percentage of the agreed upon hourly wage or fixed-rate salary for the job when a freelancer is hired. Others charge the freelancer a monthly fee or charge employers for posting jobs on their sites. Today’s market size shows the total revenue freelance employment website firms earned in 2016 according to Staffing Industry Analysts, a market research company.

Geographic reference: World
Year: 2016
Market size: $6 billion
Sources: “The Human Cumulus,” The Economist, August 26, 2017-September 1, 2017, page 55; “New Study Finds Freelance Economy Grew to 55 Million Americans This Year, 35% of Total U.S. Workforce,” Marketwired Press Release, October 6, 2016 available online here; Muhammed, Abdullahi, “79 Websites to Get Freelance Jobs Fast,” Forbes, June 16, 2017 available online here.
Original source: Staffing Industry Analysts
Image source: StartupStockPhotos, “Office-startup-business-home-office-594132,” Pixabay, January 9, 2015 available online here.

Venture Capital for Clean Technology

Clean technology is a somewhat ambiguous term but one heard more and more often today. According to Clean Edge, a research firm specializing in the study of this sector, clean technology refers to a diverse range of products, services, and processes that make use of renewable materials and energy, strive to use fewer natural resources, and to reduce emissions and wastes in both the process of their production and their use. Such companies may be in fields like renewable energy, electric motors, green chemistry, water use management, public transportation, sustainable agriculture, and areas of information technology specifically aimed at helping to reduce or eliminate emissions and waste in any number of processes.

Today’s market size is the amount invested by venture capital firms around the world in clean technology endeavors. The amounts for both 2011 and 2012 are shown. Clear from these data is that investment in such endeavors fluctuates greatly from year to year, despite the seeming relentless admiration for such clean technologies in the media at large. The New York Times article from which this market size comes (a link to which is provided below) tells an interesting story about how one company is using niche market products to help bridge the gap between proof of concept and small scale production to high volume production, a gap often referred to in the industry as Death Valley.

Geographic reference: World
Year: 2011 and 2012
Market size: $9.6 billion and $7.4 billion respectively
Source: Diane Cardwell, “A Side Trip on the Road to Clean Fuel,” The New York Times, June 23, 2013, page B1, and available online here.
Original Source: Cleantech Group’s i3 Platform
Posted on June 24, 2013

Cloud Computing Services

In recent years more and more companies have been putting their data “in the cloud.” There are 625 million subscribers to cloud document storage services. That number is expected to reach 1.3 billion in 2017. Cloud computing service companies allow users to store data on the service provider’s remote servers from which users can access that data from anywhere using Internet-based software and a computer or mobile device. While this can be a cost-saving measure for companies, securing the data on public servers is still a concern. After recent high-profile security breaches at such companies as Nasdaq, LinkedIn, and Twitter, many cloud service companies have invested in tighter security systems for their servers.

Today’s market size data show the amount of revenue from public clouds in 2011 and projected revenue for 2016. Currently, 25% of all business information globally is held on servers that are part of what is referred to as the cloud.

Geographic reference: World
Year: 2011 and a projection for 2016
Market size: $19.4 billion and $206.6 billion respectively
Source: Steve Johnson and Scott Davis, “In the Cloud,” Lansing State Journal, March 24, 2013, pages 1E, 4E.
Posted on April 8, 2013

U.S. Legal Services Industry

Legal Service Industry value added in chained dollars

The private sector, legal services industry in the United States has not recovered since the recession that began in late 2007 as many other professional service sector industries have. While annual industry revenue for the legal services sector is up, it is not keeping pace with inflation. In fact, the industry has been declining as a percent of the economy almost steadily since the turn of the century. The graph we present here shows the industry from 1987 through 2011 in terms of real value added, thus adjusted for inflation.

Industry value added is defined by the Bureau of Economic Analysis as “…the contribution of a private industry or government sector to overall GDP. The components of value added consist of compensation of employees, taxes on production and imports less subsidies, and gross operating surplus. Value added equals the difference between an industry’s gross output (consisting of sales or receipts and other operating income, commodity taxes, and inventory change) and the cost of its intermediate inputs (including energy, raw materials, semi-finished goods, and services that are purchased from all sources).”

Today’s market size is the estimated revenue collected by private sector legal services firms in the United States in 2012. This industry is identified within the North American Industrial Classification System with the code 541100.

Geographic reference: United States
Year: 2012
Market size: $270.567 billion
Source: Matt Leichter, “U.S. Legal Sector Contracting Even As Nation’s Economy Recovers,” The AM Law Daily, March 6, 2013, available online here and “Table 1 – Selected Services Estimated Quarterly Revenue for Employer Firms Fourth Quarter 2003 Through Fourth Quarter 2012,” part of the “Annual Benchmark Report for Services,” a U.S. Census Bureau series of reports available at the site here. The data presented in our chart come from the Bureau of Economic Analysis website here.
Original source: U.S. Department of Commerce, Bureau of Economic Analysis and Census Bureau
Posted on March 18, 2013

Canada’s Legal Services

The legal services industry in Canada has grown annually since 2008 when it experienced a drop in revenues of 2.9% during the onset of the global financial crisis. Today’s market size is the value of total revenues earned by law firms—lawyers, barristers and solicitors primarily engaged in the practice of law— in Canada last year.

Geographic reference: Canada
Year: 2012
Market size: $26.7 billion.
Source: “Law Firms in Canada Industry Market Research Report Now Available from IBISWorld,” Digital Journal, March 6, 2013, available online here.
Original source: IBISWorld
Posted on March 14, 2013

Office Supply Stores

The news last week that OfficeDepot and OfficeMax, two of the big three office supply retailers, are planning to merge made us think that a look at retail sales in this sector might be interesting. Sales made through stores dedicated to office supplies and stationery—an industry identified by the U.S. Census Bureau with the industry code NAICS 45321—have not been keeping up with the growth in retail sales generally since 2000. The 1990s were a period of strong growth for these retailers. Big box stores were spreading and doing well. Growth began to slow in the early 2000s and has declined each year since 2007, with the onset of a recession in December of that year.

Between 2000 and 2012, total retail sales in the United States—less auto-related sales—rose 58.6% while sales through office supply stores declined by 16.6%. Many factors are contributing to this decline. Primary among them are factors related to how we buy office supplies and not so much the volume of the supplies that we buy. The rising power of retailers with more general merchandise lines (Costco, Wal-Mart, etc.) is one significant factor as is the rise of online shopping.

Today’s market size is the value of sales at Office Supply and Stationery Stores in the United States in 1992, 2000, and 2012.

Geographic reference: United States
Year: 1992, 2000, 2012
Market size: $9.184, $22.75 and $19.11 billion respectively
Source: “Estimates of Monthly Retail and Food Services Sales by Kind of Business: 2012,” February 13, 2013, part of a series published by the U.S. Census Bureau monthly, and available here.
Original source: U.S. Department of Commerce, Bureau of the Census
Posted on February 25, 2013

Office Coffee Service

The market for office coffee service—this service, often abbreviated OCS, provides companies with the hardware and consumables needed to supply their employees and guests with hot beverages, usually coffee—declined during the recession of 2007-2009 but began to grow again in 2011. This turnaround occurred more quickly than did the rebound for the larger vending machine contractors industry generally. Credit is given by the industry to its ability to be flexible and to alter its offerings. In particular, the rising popularity of single-cup systems has helped the industry to weather economic cycles throughout the first decade of the 2000s.

Today’s market size is the value of the office coffee service market in 2011, a figure that was forecast to rise by 3.5% in both of the following two years.

Geographic reference: United States
Year: 2011
Market size: $4 billion
Source: “Report: Office Coffee Sales To Increase 3.5 Percent Annually in 2012 and 2013,” February 21, 2012, Vending Marketwatch, available online here.
Original source: Packaged Facts
Posted on January 10, 2013

Polling Services

The long political campaign season is finally over in the United States. One of the striking aspects of this year’s campaign cycle was the seemingly endless supply of new polling data, from multiple sources on a daily basis.

Today’s market size is the size of the revenues for the polling services industry in the United States, in 2002 and 2010. The industry is defined, within the North American Industrial Classification System, as follows: “This industry comprises establishments primarily engaged in systematically gathering, recording, tabulating, and presenting marketing and public opinion data.” Its industry code is 541910. The sorts of services provided by this industry include:

Broadcast media rating services
Marketing analysis services
Marketing research services
Opinion research services
Political opinion polling services
Public opinion polling services
Public opinion research services
Statistical sampling services

Geographic reference: United States
Year: 2002 and 2010
Market size: $10.89 billion and $16.74 billion respectively
Source: “Table 6.1. Professional, Scientific, and Technical Services (NAICS 54) – Estimated Revenue for Employer Firms: 2002 Through 2010,” 2010 Service Annual Survey, February 2, 2012, available online from the Census Bureau’s website.
Original source: U.S. Department of Commerce, Bureau of the Census
Posted on November 9, 2012

Commodity Contract Dealers

Commodity Contract Dealers Industry 1997-2010

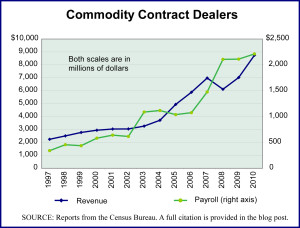
With the growth of globalization and the rise in consumption levels in many parts of the world, the cost of basic commodities has been on a strongly upward trajectory but one with great fluctuations. Such fluctuations in commodity prices tend to favor attempts to trade in futures by way of limiting the uncertainty of volatile prices. The services of commodity contract dealers have been in high demand and they have done quite well. The growth in both revenue and employment in the commodity contracts business shows how it has survived the recession and financial crisis of 2007–2009 far better than most industries.

The graphic presents annual revenue and payroll for Commodity Contract Dealers [NAICS 523130] in the United States from 1997 through 2010. Over this period, industry revenues grew by a very healthy 290% and payroll grew by an even more impressive 549%. In 1997, payroll accounted for 15% of revenue for this industry. In 2010 payroll accounted for 25% of revenue, off from a high of 34.5% of revenue reached in 2008. The total number employed by this industry also grew over the period 1997–2010, by 152%, from 4,519 to 11,400.

Today’s market size is the total industry revenue generated by commodity contract dealers in the United States in 2010.

Geographic reference: United States
Year: 2010
Market size: $8.75 billion
Source: Economic Census reports on the NAICS industry 523130 from the 1997, 2002, and 2007 Economic Censuses. The 2003 and 2010 editions of the Service Annual Survey, “Table 4.1. Finance and Insurance (NAICS 52) — Estimated Revenue fro Employer Firms.” All of these reports are available online from the Census Bureau’s website here.
Original source: U.S. Department of Commerce, Bureau of the Census
Posted on November 1, 2012

Collection Agencies

Collection Agencies, estimated revenue annually

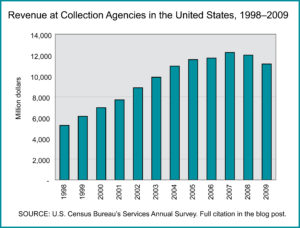
Today’s market size post looks at collection agencies. You may be forgiven for assuming that collection agencies are in a recession-proof sort of business. From the looks of the national data on that industry, this is not entirely true. The graph shows estimated annual revenue for collection agencies over more than a decade.

Geographic reference: United States
Year: 1999 and 2009
Market size: $6.10 billion and $11.14 billion
Source: “Table 7.1. Administrative and Support and Waste Management and Remediation Services (NAICS 56) — Estimated Revenue for Employer Firms: 2002 Through 2009,” Service Annual Survey: 2010, parts of which are available online here. Data for years prior to 2002 were obtained from earlier editions of the Service Annual Survey, many of which are also available from the Census Bureau’s websites.
Original source: U.S. Census Bureau
Posted on November 2, 2011

Express Delivery Market

The Internet has not done away entirely with the need to ship documents across the globe and quickly. Today we look at the express delivery industry which provides expedited delivery of documents and parcels almost anywhere on earth. Major players in this industry include familiar names like DHL, FedEx, and UPS, although national postal services also have a role in this business.

The market size presented below is the estimated total sales revenue generated by the express delivery industry in 2008.

Geographic reference: World
Year: 2008
Market size: $175 billion
Source: “Facts & Figures on Express Industry,” a report made available online, here, by The European Express Association.
Original source: Oxford Economics
Posted on October 24, 2011

Trucking, General Freight

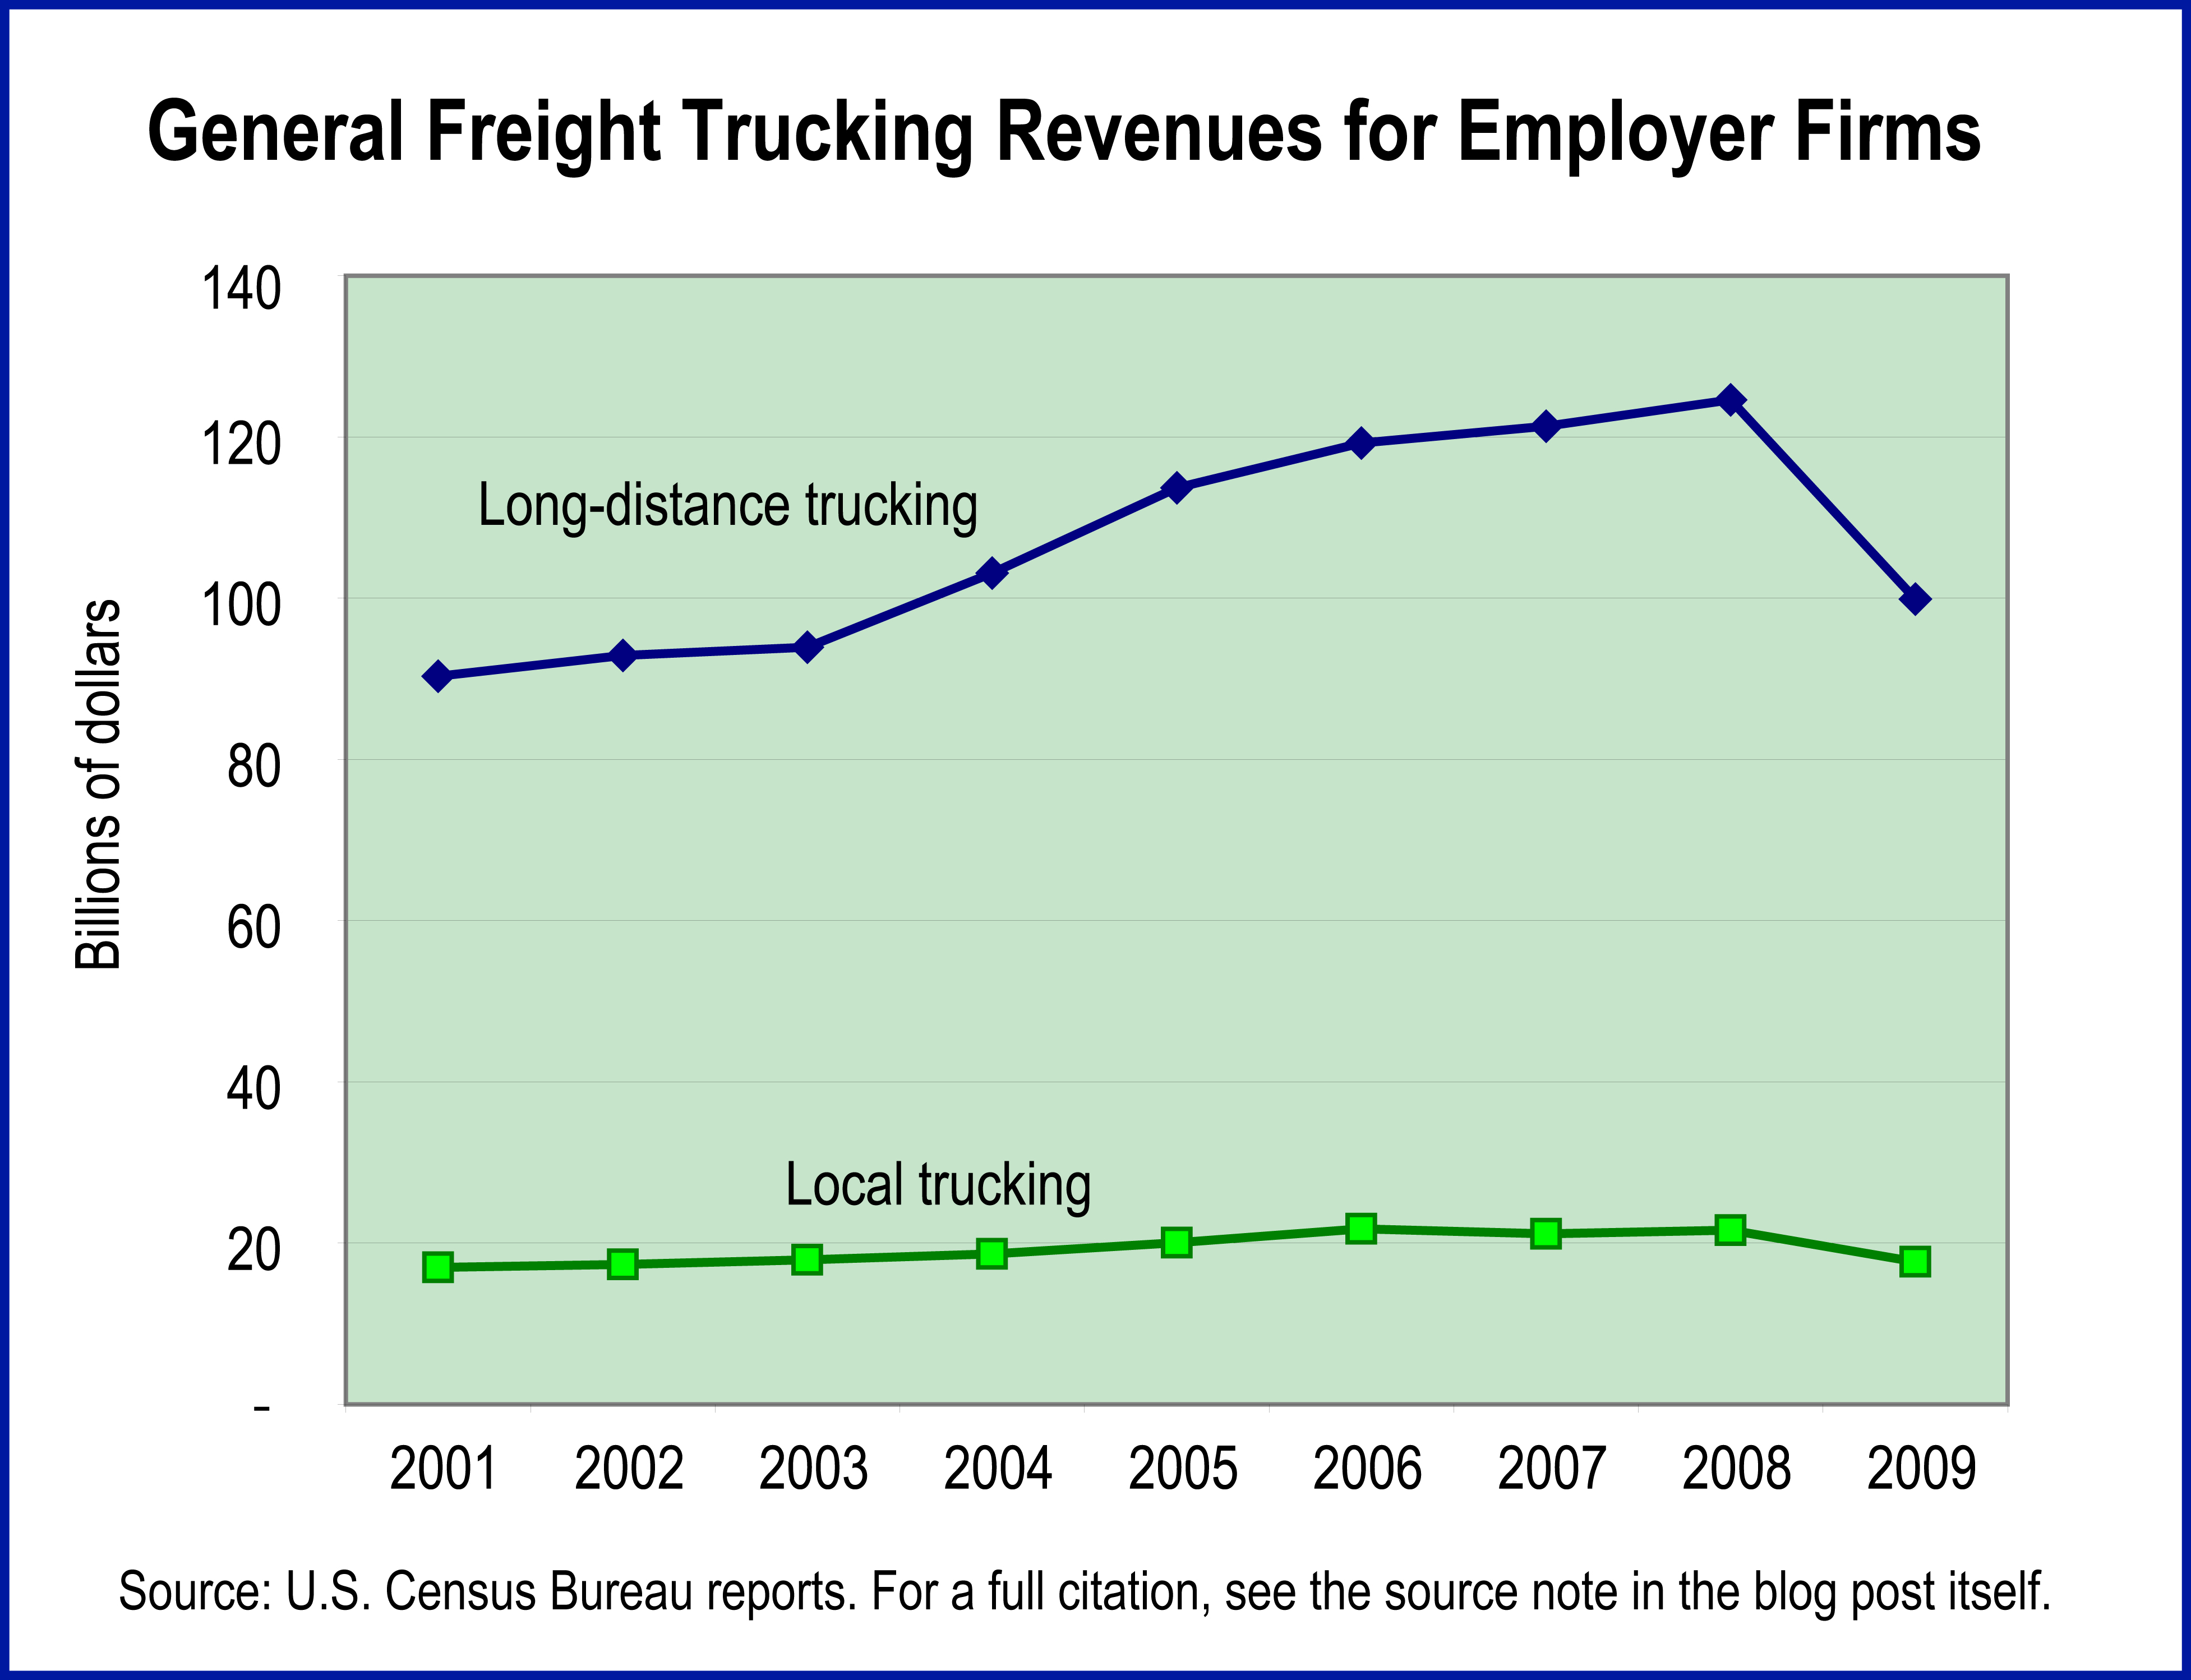
General freight truckingToday we look at the revenues generated by general freight trucking firms and specifically, those with employees. Today’s market size does not include the revenues generated by independent truckers who are categorized as nonemployers. The graph charts estimated revenues from 2001 through 2009 and presents them for local freight movements as well as long-distance.

Geographic reference: United States
Year: 2001 and 2009
Market size: $107.32 billion and $117.58 billion respectively
Source: “Table 2.1 Transportation and Warehousing (NAICS 48, 49) – Estimated Revenue for Employer Firms: 2001 through 2009,” Service Annual Survey 2009, page 9, issued in February 2011 and available online here.
Original source: U.S. Department of Commerce, Economics and Statistics Administration, U.S. Census Bureau
Posted on September 15, 2011

Nonemployer Professional, Scientific and Technical Services

We recently posted the size of the professional, scientific and technical services market in the United States, here, and today we add detail to that market post by offering the size of a subset of the market. Today we show the revenue for all nonemployer firms in this service industry which represents 8.6% of the total revenue generated by professional, scientific and technical service providers in 2009. Most nonemployer firms are individual proprietorships but some are partnerships and even corporations. The point is, they have no paid employees. There were 21 million such firms in the United States in 2009, 18.7 million of them were individual proprietorships.

Geographic reference: United States
Year: 2009
Market size: $118.3 billion
Source: “2009 Nonemployer Statistics: Geographical Area Series: Nonemployer Statistics by Legal Form of Organization: 2009,” one of the many offerings on the Census Bureau’s American FactFinder platform, available here.
Original source: U.S. Census Bureau
Posted on September 13, 2011

Marinas

Those offering services to boaters by operating docking and/or storage facilities for pleasure craft owners are Marinas. Some marinas offer additional services such as repair and maintenance services as well as retailing of fuel and marine supplies. The states within the United States with the largest marina industries, in order, are Florida, New York, California, Michigan and Massachusetts.

Today’s market size is the estimated revenues from all marinas in the United States in 2009.

Geographic reference: United States
Year: 2009
Market size: $3.3 billion
Source: “Table 9.1. Arts, Entertainment, and Recreation Services (NAICS 71) — Estimated Revenue for Employer Firms: 2001 Through 2009,” Service Annual Survey: 2010. The report on NAICS Sector 71 is available online here.
Original source: U.S. Census Bureau
Posted on September 9, 2011

Professional, Scientific and Technical Services

Professional Services

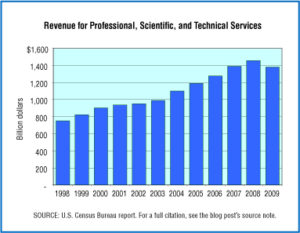
The sector of the U.S. economy that has been growing most strongly over the last decades is the Service Sector. The service sector includes all those who provide services instead of goods so, accountants, architects, computer programmers, consultants, doctors, hair stylists, lawyers, teachers and truckers to name but a few. The Census Bureau divides the Service Sector into eleven major categories and our market size today is one of those: Professional, Scientific and Technical Services, an industry whose revenues in 2009 represented 21.6% of all Service Industry revenues.

Over the period shown in the graph, 1998—2009, businesses providing professional, scientific and technical services saw their revenue grow by 85.3% which is 42.7% ahead of inflation.

Geographic reference: United States
Year: 1998 and 2009
Market size: $751.3 billion and $1,378.3 billion
Source: Services Annual Survey 2009, “Tables 1.1 Selected Service Industries – Estimated Revenue for Employer and Nonemployer Firms: 2005 through 2009,” and “Table 1.2 Selected Service Industries – Estimated Revenue for Employer Firms: 2005 through 2009,” pages 4 and 6, February 2011, available online here. Data in the graph are from earlier editions of this report series, links to which are available on a Census Bureau web page here.
Original source: U.S. Department of Commerce, Bureau of the Census

Advertising

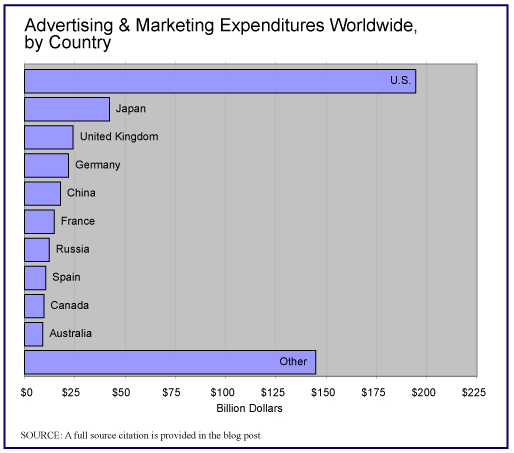
Advertising and Marketing Expenditures Worldwide

The United States is the undisputed leader worldwide when it comes to advertising, accounting for more than a third of all advertising and marketing expenditures worldwide. The chart shows the top ten countries by estimated advertising spending worldwide.

Please note that the graph is made from data that were produced in 2007 as a projection and much has changed since 2007. In fact, the summer of 2007 was a strange time, a time when investment firms were busy trying to pump confidence into a market that was weakening by the day. The report from which we got the figures used in the graph was published by Bear Stearns. In early 2008, Bear Stearns collapsed.

In a way, this example is a warning to all researchers to be careful when making assumptions about market data. By way of providing an interesting range of market sizes for Spending on Advertising and Marketing, we provide two measures for this overall market. One is from the Bear Stearns’ report produced in 2007 with projections for 2009. The other source is Advertising Age. Its estimates have the advantage of reporting on 2009 after the fact. The graph is based on the projected data since that report offered the country-by-country breakdown.

Geographic reference: United States
Year: 2009
Market size: Bear Stearns projection, $194 billion
Market size: AdAge estimate, $125 billion
Source: (1) Advertising & Marketing Services, Bear Stearns, July 2007, page 40. (2) Advertising Age, June 21, 2010, page 10.
Original source: ZenithOptimedia and Ad Age DataCenter.

Office Equipment and Computer Wholesalers

The way we move food, for example, from producer to end user has not changed a great deal in the last decade. The way we move office equipment and computers from producer to end user has changed greatly. The wholesalers of office equipment and computers have seen their business shrink significantly and the routes used to get these products to the end user have bypassed traditional wholesalers.

Worth noting is the fact that the effects of the recession, which began in December 2007, are not yet visible in these market size data. The markets presented here are for two Census Bureau defined industries: Office Equipment Merchant Wholesalers [NAICS 42-3420], and Computer and Computer Peripheral Equipment Wholesalers [NAICS 42-3430].

Geographic reference: United States
Year: 1997 and 2007
Market size: Number of Establishments: 24,248 and 17,801 respectively.
Market size: Sales: $258.09 and $290.39 billion respectively.
Source: “Sector 42: EC0742I2: Wholesale Trade: Industry Series: Preliminary Comparative Statistics for the U.S. (2002 NAICS): 2007 and 2002,” 2007 Economic Census, available online here. The data from 1997 are from the 1997 Economic Census.
Original source: U.S. Department of Commerce, Bureau of the Census.