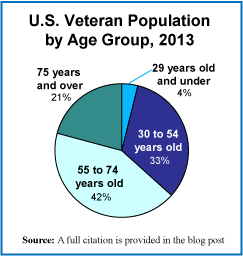
Today we present a brief market size post on the U.S. veteran population, in honor of those veterans on this Veteran’s Day. The pie chart shows the population broken down into four age groups. While the total number of veterans has been declining for many decades now, the number of veterans living with service-connected disabilities has been rising. Between 1990 and 2012, the number of veterans with service-connected disabilities grew by 46%.
Geographic reference: United States
Year: 2013 and a projection for 2020
Market size: 21,972,964 and 19,604,276 respectively
Sources: (1) “Table 1L: VETPOP2011 Living Veterans by Age Group, 2010-2040,” a statistical table made available by the U.S. Department of Veterans Affairs on their website here, towards the bottom of the page on the right side. (2) “Trends in the Utilization of VA Programs and Services,” prepared by the National Center for Veterans Analysis and Statistics, January 2012, available online here.
Original source: U.S. Department of Veterans Affairs
Posted on November 11, 2013

