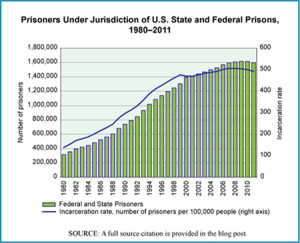
The number of people in prison in the United States is the highest in the world when calculated in terms of number per capita. The U.S. incarceration rate as of December 31, 2011 was 492 people per 100,000 in the population, and this did not count those in jail, awaiting trial or serving very short sentences. Those in jail increase the total number incarcerated by three-quarters of a million people. The chart shows the number of prisoners in the United States, annually, between 1980 and 2011 and includes only those in federal or state prisons but not those in jail.
Today’s market size is the number of people in the United States under the jurisdiction of state or federal corrections authorities as of December 31, 2011. These are people convicted of a crime and serving a prison term.
Worth noting is the fact that 8% of those in prison (at the end of 2010) were housed in private prisons run for profit. Leaders in the private prison business are CCA (Corrections Corporation of America) and GEO Group, Inc. which together account for approximately half of the prison contracts in the United States. As of January 1, 2011, 31 states contracted with private companies to house a portion of their prisoners. Texas had the largest number of persons in privately run prisons, 19,155 or 11% of its prison population. New Mexico had the largest percentage of its prison population housed by private prisons, 43.6% or 1,503 prisoners.
Geographic reference: United States
Year: 2011
Market size: 1,598,780 people
Source: E. Ann Carson and William J. Sabol, “Prisoners in 2011,” December 2012, a Bulletin published by the U.S. Department of Justice, Bureau of Justice Statistics, and available online here. The figures related to private prisons come from Cody Mason, “Too Good to be True, Private Prisons in America,” The Sentencing Project, January 2012. The data for the graphic came from the above cited Department of Justice report as well as the Statistical Abstract of the United States, 2004–2005, page 208, “Table 338–Federal and State Prisoners, by Sex, 1980 to 2002,” Bureau of the Census.
Original source: U.S. Bureau of Justice Statistics and U.S. Census Bureau
Posted on April 4, 2013

