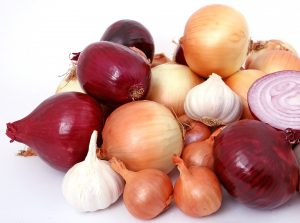
Whether diced in a dip, sliced in a salad, minced in stuffing, or fried atop a green bean casserole, onions are versatile vegetables that add flavor to dishes without adding many calories. Perhaps because of this, onions were the third most consumed vegetable in the United States in 2018.1 Only potatoes (113.7 pounds per capita) and tomatoes (86.1 pounds per capita) had higher consumption rates. Per capita consumption of onions totaled 22.3 pounds, the vast majority of which, 20.4 pounds, was in the form of fresh onions. Yellow onions were the most popular, 34% of sales, followed by red onions (14.3%), scallions (13.3%), white onions (11.3%), Vidalias (7.4%) and shallots (1.5%).2
Today’s market size shows the total value of utilized production in the United States for 2016, 2017, and 2018. In 2018, onions ranked 5th behind tomatoes, head lettuce, romaine lettuce, and sweet corn. In 2016, onions ranked 3rd. Most of the value comes from fresh onions. In 2018, fresh onion value totaled $655.1 million. Processed totaled $162.4. From 2016 to 2018, the price per hundredweight of harvested onions fell from $16.50 down to $13.50. Prices may increase during the 4th quarter of 2019 due to a smaller harvest in the Northwest and Rocky Mountain regions. Rain in the summer delayed planting, harvesting was delayed because of more rain and because the onions were still in the ground later than usual, a mid-October freeze may have affected 20-25% of the crop. The top three states for onion production are California, Washington, and Oregon.
1 Per capita food availability measures.2 Market shares are based on sales at supermarkets, drug stores, mass merchandisers, military commissaries, and select club and dollar chains for the 52 weeks ended June 17, 2018. Source: Market Share Reporter, 30th Edition, Gale, a Cengage Company, 2020, pages 401-402. Original source: Fresh Foods – A Supplement to Winsight Grocery Business. Annual 2018, p. 41, from IRI.
Geographic reference: United States
Year: 2016, 2017, and 2018
Market size: $1.059 billion, $1.042 billion, and $817.5 million, respectively
Sources: Vegetables 2018 Summary, United States Department of Agriculture, Agricultural Statistical Service, March 2019 available online here; “Food Availability (Per Capita) Data System,” United States Department of Agriculture, Economic Research Service, July 31, 2019 available online here; Market Share Reporter, 30th Edition, Gale, a Cengage Company, 2020, pages 401-402; Greg Johnson, “October Freeze May Spike Onion Market,” Blue Book Services, October 17, 2019 available online here.
Image source: Shutterbug75, “bulb-onions-diet-flavor-food-1238332,” PIxabay, March 5, 2016 available online here.
