
Year: 2019 and 2027
Market size: $41.97 billion and $102.62 billion, respectively
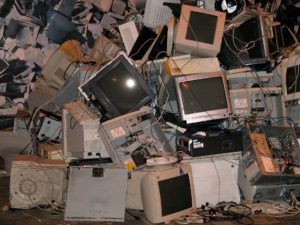
Broken appliances, VCRs, televisions, laptops, mobile phones, game consoles, printers, and tablets. These are just some of the items that are classified as e-waste. Electronic equipment is all around us whether in our homes or in manufacturing facilities, offices, retail establishments, or restaurants. What happens to all these electronic devices when they break or become obsolete?
Today’s market size shows global revenues for e-waste management in 2019 and projected for 2027. E-waste management involves the reuse, resale, recycling, or disposal of electronic and electrical devices. Major global e-waste management companies include Aurubis AG, Boliden AB, Enviro-Hub Holdings Ltd., Electronic Recyclers International Inc., LifeSpan Technology Recycling Inc., MBA Polymers Inc., SIMS Metal Management Ltd., Stena Metall AB, Tetronics Ltd., and Umicore SA.
In 2016, of the 44.7 million metric tons of e-waste generated worldwide only 20% was recycled. In 2019, of the 53.6 million metric tons of e-waste generated only 17.4% was recycled. This despite “71% of the world’s population covered by some form of e-waste policy, legislation, or regulation”, up from 44% in 2014.1 By region, Asia generated the most e-waste in 2019, 46.5%, followed by the Americas (24.4%) and Europe (22.4%). Europe, however, had the highest e-waste recycling rate at 42.5%. Asia followed with 11.7% and the Americas with 9.4%.E-waste is the fastest growing waste stream in the world. Higher levels of disposable income and lower cost of electronic devices, as well as increasing urbanization and industrialization, lead to rising consumption of electrical and electronic equipment. In turn, this growing consumption, along with short product life cycles and increasingly fewer options for repair lead to growth in the amount of e-waste.
This type of waste contains hazardous materials such as mercury, chromium, lead, brominated flame retardants, chlorofluorocarbons (CFCs), and hydrochlorofluorocarbons (HCFCs). If improperly disposed of these toxins can seep into the atmosphere, soil, and water, having significant negative effects on ecosystems and on people’s health. Every year 50 tons of mercury from improperly disposed of e-waste are released into the environment. In 2019, 98 metric tons of CO2-equivalent substances (greenhouse gases) were released into the atmosphere from improperly discarded refrigerators and air-conditioners.Along with the toxins, e-waste contains several useful raw materials including metals such as iron, copper, aluminum, and gold. In 2019, these raw materials were estimated to be valued at $57 billion, with only about $10 billion of that recovered for recycling. Metal was the material most recovered from e-waste, followed by plastic and glass. Household appliances constituted the majority of e-waste in 2019, followed by IT and telecommunications equipment. Because of this, household appliances are a major source of revenue for companies involved in recycling e-waste. IT and telecommunications equipment are expected to take on a greater share of the e-waste stream through 2027. The COVID-19 pandemic has led to higher sales of mobile phones, laptops, and dongles as employees began working from home. Once pandemic restrictions are eased and workers return to their workplaces, companies are expected to dispose of many older electronic devices that are no longer needed thereby creating a high demand for e-waste management.
With only 17.4% of e-waste being properly recycled, where does the rest go? Most e-waste is thought to be mixed with other waste streams such as plastic or metal waste. Although some of this may be recycled, the focus of the recycling effort is on gathering a single material rather than extracting all the valuable materials available. Also, little or no thought may be given to mitigating the harmful effects of the toxic substances in the e-waste.
While some manufacturers offer to take back electronic devices to be refurbished or recycled, many other discarded electronic products are shipped from high-income countries to low- or middle-income countries where little or no formal e-waste management infrastructure exists, putting workers’ health at risk along with the health of those that live around these waste management activities. The Basel Convention on the Control of Transboundary Movements of Hazardous Waste and Their Disposal went into effect in 1992. Signed by 187 countries, it established written notification and approval processes for all cross-border movement of hazardous wastes, including most recently electrical and electronic waste. This was done so that countries would “take necessary measures to ensure that the management of hazardous wastes and other wastes including their transboundary movement and disposal is consistent with the protection of human health and the environment whatever the place of disposal.”2 This Convention makes an exception for goods that are destined for reuse. It’s estimated that 7-20% of e-waste generated in high-income countries is illegally exported as reusable goods or scrap metal. About 8% of e-waste in high-income countries ends up in landfills or is incinerated.1 Sources: 2016 data: Baldé, C.P., Forti V., Gray, V., Kuehr, R., Stegmann, P., “The Global E-waste Monitor – 2017,” United Nations University (UNU), International Telecommunication Union (ITU) & International Solid Waste Association (ISWA), Bonn/Geneva/Vienna available online here; Other data: Forti V., Baldé C.P., Kuehr R., Bel G., “The Global E-waste Monitor 2020: Quantities, Flows and The Circular Economy Potential,” United Nations University (UNU)/United Nations Institute for Training and Research (UNITAR) – co-hosted SCYCLE Programme, International Telecommunication Union (ITU) & International Solid Waste Association (ISWA), Bonn/Geneva/Rotterdam available online here.
2 “Basel Convention on the Control of Transboundary Movements of Hazardous Wastes and Their Disposal, Protocol on Liability and Compensation for Damage Resulting from Transboundary Movements of Hazardous Wastes and Their Disposal: Texts and Annexes,” United Nations Environment Programme, Revised in 2019 available online here.
Sources: Sneha Korad, et. al., “E-Waste Management Market by Processed Material Type (Metal, Plastic, Glass and Others), Source Type (Household Appliances, Industrial Electronics, and Consumer Electronics), Application (Trashed and Recycled): Global Opportunity Analysis and Industry Forecast, 2020-2027,” Allied Market Research Report Summary, April 2020 available online here; “International E-Waste Management Network (IEMN),” United States Environmental Protection Agency available online here; Baldé, C.P., Forti V., Gray, V., Kuehr, R., Stegmann, P., “The Global E-waste Monitor – 2017,” United Nations University (UNU), International Telecommunication Union (ITU) & International Solid Waste Association (ISWA), Bonn/Geneva/Vienna available online here; Forti V., Baldé C.P., Kuehr R., Bel G., “The Global E-waste Monitor 2020: Quantities, Flows and The Circular Economy Potential,” United Nations University (UNU)/United Nations Institute for Training and Research (UNITAR) – co-hosted SCYCLE Programme, International Telecommunication Union (ITU) & International Solid Waste Association (ISWA), Bonn/Geneva/Rotterdam available online here; “Basel Convention on the Control of Transboundary Movements of Hazardous Wastes and Their Disposal, Protocol on Liability and Compensation for Damage Resulting from Transboundary Movements of Hazardous Wastes and Their Disposal: Texts and Annexes,” United Nations Environment Programme, Revised in 2019 available online here.
Image source: INESby, “computers-monitors-equipment-cables-814257,” Pixabay, June 19, 2015 available online here.