Personal Luxury Goods

Personal luxury goods include high-end apparel, leather goods, accessories, watches, jewelry, perfume, beauty products and other high-end goods for personal use. Today’s market size shows the total global sales of personal luxury goods for 2018 and projected for 2025.1 Top companies in this sector, ranked by 2018 sales, include LVMH ($53.66 billion), EssilorLuxottica ($18.57 billion), Richemont ($16.05 billion), Kering ($15.71 billion), Swatch ($8.71 billion), Chow Tai Fook ($8.71 billion), Hermés ($6.88 billion), Ralph Lauren ($6.42 billion), Tapestry ($5.96 billion), and Capri Holdings ($5.38 billion).2

Traditionally consumers who wanted to purchase personal luxury goods shopped at specialty boutiques or high-end department stores such as Nordstroms, Bergdorf Goodman, or Saks Fifth Avenue. But, just as other brick-and-mortar retail establishments have been affected negatively by online retailers, so too have personal luxury goods retailers. Several online sites such as Net-a-Porter offer multiple brands of high-end merchandise for sale, free shipping and the convenience of shopping from home. Overall, in-store traffic decreased by 30% from 2012 to 2018. Still, according to EY Advisory, although more than 70% of purchases are influenced by online channels, nearly 90% of purchases are made in store.

Increasingly, many shoppers in their 20s through 40s who can afford high-end merchandise do not want to pay full price for their purchases. In addition, while many Millennials and Generation Z consumers want to be seen in new styles often, they are also concerned about sustainability. They see clothing resale and reuse as a way to conserve resources while also satisfying their want of a new wardrobe. Overall, 26% of luxury shoppers also buy secondhand. While wealthy consumers are unlikely to shop at places such as Goodwill or other thrift stores, they are shopping online at sites such as Fashionphile and TheRealReal which allow consumers to buy, sell and consign used luxury clothing and accessories and at sites such as Rent the Runway which allows consumers to rent high-end clothing for a monthly fee. Millennial and Generation Z consumers made a third of luxury purchases worldwide in 2018 according to Bain & Co. Purchases made by consumers in these two generations combined contributed to nearly all of the growth in the luxury goods sector in 2018.

Some luxury brands such as Gucci and Louis Vuitton have been opening boutique stores and expanding their website offerings in order to control their exclusivity while at the same time their merchandise is discounted at resale sites. Some luxury retailers are focusing on experiences and services to compete with online retail, resale, and rental sites by offering customers champagne and hors d’oeurves while they shop, having cafés and beverage bars in store, and hiring style advisors to help customers. Nordstrom partnered with Rent the Runway to offer customers the ability to drop off their Rent the Runway fashion items at their store. After learning that half their customers also buy or sell used merchandise, Neiman Marcus invested in a minority share of Fashionphile, however, they do not plan to sell secondhand merchandise in their stores or on their website.3 They may want to rethink that strategy, however. In ThredUp’s 2019 Resale Report, GlobalData, a retail analytics firm, found that 33% of consumers would buy more from luxury retailers if they offered secondhand clothing.

1 For the projected 2025 data, the source mentions the “luxury goods market.” The article in which this appears reports only on personal luxury goods, therefore, our editors assumed that this figure was for personal luxury goods only.
2 The source reports sales figures in euros. Our editors used the December 31, 2018 conversion rate of 1 Euro = 1.1466 U.S. dollars given on the Market Insider website here to convert the sales figures to U.S. dollars. Rankings do not include cosmetics companies. If they did the following companies would be in the top 10: L’Oréal ($30.84 billion), Estée Lauder ($13.99 billion) and Beiersdorf ($8.26 billion). Cosmetics sales include products at all price points.
3 Through the partnership with Fashionphile, Neiman Marcus has designated a few of their stores as drop-off points for customers who want to sell their merchandise on Fashionphile. Sellers receive an immediate quote from Fashionphile for their merchandise and immediate payment if they choose to sell. Neiman Marcus is hoping that customers will then want to use that payment to buy merchandise in their stores.

Note: Any mention of brands or companies in this post does not constitute an endorsement.

Geographic reference: World
Year: 2018 and 2025
Market size: $286.53 billion and $445 billion, respectively
Sources: Anne D’Innocenzio, “Luxury Stores Adapt to Changing Shoppers,” The Denver Post, December 29, 2019, pp. 1K, 6K; Florine Eppe Beauloye, “The 15 Most Popular Luxury Brands Online in 2019,” Luxe Digital, April 20, 2019 available online here; “Tailoring the Luxury Experience: The Luxury and Cosmetics Financial Factbook 2019 Edition,” EY Advisory S.p.A., 2019 available online here; ThredUp 2019 Resale Report, March 2019 available online here; Tom Ryan, “Are Secondhand Sales the Right Branding Move for Neiman Marcus?” RetailWire, April 23, 2019 available online here.
Original source: Bain & Co.
Image source: FranckinJapan, “bag-luxury-accessories-japan-ginza-2060110,” Pixabay, February 13, 2017 available online here. Use of image does not constitute an endorsement.

Extended Warranties

broken smartphoneDid you buy a new TV to watch March Madness? Purchase the latest mobile phone or tablet? Have you bought a new home? If you have, you were probably offered an extended warranty on your purchases.
Today’s market size shows the total amount of premiums consumers paid for extended warranties in 2017. These premiums fall into 8 categories: vehicle service contracts, mobile phone insurance, consumer electronics service contracts, computer OEM service contracts, jewelry protection plans, home warranties, appliance protection plans, and furniture protection plans. How purchases are categorized depends on who sold the extended warranty and not on the item itself. For example, if an iPhone protection plan was sold by Apple, the plan will be considered a computer OEM service contract. If the plan was sold by a retailer, it falls into the consumer electronics protection plan category. If the plan was sold by a wireless phone carrier, then it’s considered mobile phone insurance.

Overall, the amount of premiums paid from 2016 to 2017 declined by $250 million. Vehicle service contract premiums, which brought in $16.7 billion in 2017, declined the most during this time period, down $300 million, followed by plans covering brown and white goods and mobile phone insurance plans. Home warranty premiums grew by $340 million from 2016 to 2017, a 16% increase. Total jewelry service plan premiums and furniture protection plan premiums also grew during this time period, by 2% and 3% respectively.

Geographic reference: United States
Year: 2017
Market size: $44.7 billion
Source: “Service Contract Market Size,” Warranty Week, February 1, 2018 available online here.
Image source: Glavo, “smartphone-mobile-phone-phone-2971080,” Pixabay, November 7, 2017 available online here.

Appliance and Electronics Stores

ApplianceStores

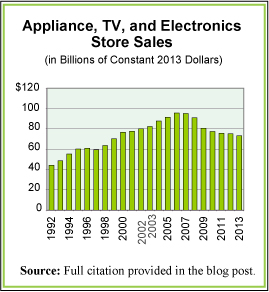
Today’s market size is the sales volume of appliance, TV, and electronics stores in the United States in 2013. Sales through these stores grew 26% from 2000 to 2013. However, as is often the case with a single measure, that single statistic does not tell the full story. Sales peaked in 2007 and between then and 2013 they declined by 15%. When one takes inflation out of the mix, the picture changes further yet. In inflation-adjusted dollars, sales from 2000 to 2013 actually fell by 5% and between 2007 and 2013 they fell by 23%. The trend is clear in the graph we provide which shows sales annually in inflation-adjusted, constant 2013 dollars.

Geographic reference: United States
Year: 2013
Market size: $73.29 billion
Source: “Estimated Annual Sales of U.S. Retail and Food Services Firms by Kind of Business: 1992 Through 2012,” Annual Retail Trade Survey 2012, U.S. Census Bureau, March 31, 2014, available online here. “Retail and Food Service Sales,” January 2014 Monthly Retail Trade and Food Service Report, U.S. Census Bureau, March 13, 2014, available online at the same site linked to above. Constant 2013 dollars were calculated using “Table 1.1.9. Implicit Price Deflators for Gross Domestic Product,” part of the National Income and Products Accounts Tables produced by the Bureau of Economic Analysis and available online here.
Original source: U.S. Department of Commerce, Bureau of the Census and Bureau of Economic Analysis
Posted on April 4, 2014

Nonstore Retail Sales

Nonstore

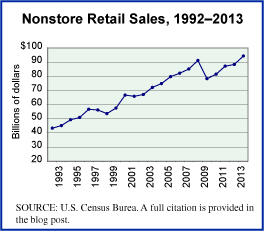
We hear a lot today about e-commerce, which may be defined in many ways and has been around for longer than most people think if we include exchanges made at the wholesale trade level as a part of e-commerce. Wholesalers have been using electronic sales for a long time now. But e-commerce is not actually synonymous with nonstore retail. While electronic shopping accounts for a great deal of the total nonstore retail business, nearly 80% in 2013 when combined with mail-order house sales, there are others in this nonstore sector.

The total nonstore retail sector includes, as we’ve seen, electronic shopping and auction websites and mail-order houses. It also includes businesses that do their selling with infomercials on TV, by going door-to-door, through the use of in-home demonstrations, those that sell from portable stalls or food trucks, and those operating vending machines. The graph we present shows annual sales by nonstore retailers other than electronic shopping, auctions, and mail-order houses.

Today’s market size is the total value of sales made in the United States through nonstore retailers in 2000 and in 2013.

Geographic reference: United States
Year: 2000 and 2013
Market size: $180.5 billion and $450.2 billion
Source: “Time Series / Trend Charts,” a new interactive resource made available by the U.S. Census Bureau using its wealth of data collected in a monthly survey series it does of the retail trade sector. The main website for the “Monthly and Annual Retail Trade” data is here and the new Time Series / Trend Chart offering is available online here.
Original source: U.S. Census Bureau
Posted on March 13, 2014

Independent Bookstores

Bookstores
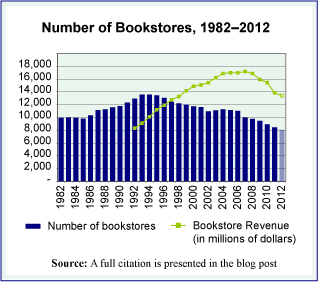
A recent article titled “Independent bookstores turn a new page on brick-and-mortar retailing,” by Michael Rosenwald and published on the Washington Post website, here, grabbed our attention. It appears that after years of shrinking, independent bookstores may have hit bottom. In fact, there are some signs of growth as new independent store openings may be outpacing closures.

As we learned some years ago when we did a study of the publishing industry, getting reliable statistics on the national book retailing industry is not easy. This is in part because it is always difficult to track an industry that is going through significant change and reorganization. The selling of books definitely falls into that category. Over the last two decades it has been a standout in this regard within an entire sector—the retail sector—going through significant change. From the rise and fall of the big bookstore chains such as Borders and Barnes & Noble to e-books, Amazon and the spread of books into a growing number of big box, discount outlets, independent booksellers have seen their share of the business shrink for decades.

The graph we offer shows the total number of bookstores in the United States, annually, over a three-decade period. It also shows industry revenues for the last twenty years of that period. The data charted all come from the U.S. Census Bureau’s reports on the industry and their County Business Patterns database. While total bookstore numbers are available, it is more difficult to tease out of these data the store count by independent bookstores versus the larger stores run by big chains that began to dominate the industry in the 1990s. The graphic fails entirely to capture the rise of e-books and e-commerce. Nonetheless, it provides an overview of the pattern made by the ups and downs of the brick-and-mortar bookstore.

From these overall figures, we can make educated estimates about a few things. By taking data from the Annual Reports of three of the largest bookselling chains, Borders (until 2011), Barnes & Noble, and Books-A-Million, we have calculated the following rough outline of independents versus chains in 2002 and a decade later, in 2012. In 2002, the three largest chains accounted for 21% of all bookstores and 49% of bookstore sales. In 2012, after the bankruptcy of Borders, the remaining two large chains accounted for approximately 20% of the stores and 57% of all the sales made by bookstores.

Today’s market size is the approximate number of independent bookstores and small chain bookstores in the United States in 2012 as well as the value of their sales in that year.

Geographic reference: United States
Year: 2012
Market size: 6,043 bookstores with revenues of approximately $5.76 billion (based on Census data on bookstore sales, less sales by the two largest chains, Barnes & Noble and Books-A-Million)
Sources: (1) Gabe Habash, “Bookstores in America, 2013: A State-by-State Guide, Publishers Weekly, June 1, 2013, available online here. (2) Latest Annual Retail Trade Reports, part of the Census Bureau’s monthly and annual compilation of data on the retail sector, taken from the website here and more specifically, the report titled Annual Retail Trade Survey—2011: Sales (1992-2011) using monthly reports to update the annual figure for 2012.
Original source: U.S. Department of Commerce, Bureau of the Census, the American Booksellers Association, and Publishers Weekly
Posted on December 30, 2013

Used Merchandise

UsedMerchStores

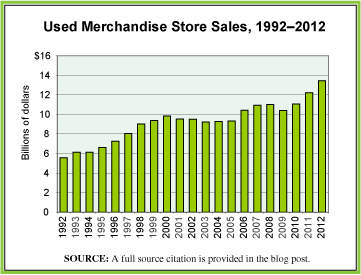
Whether it be the post-recession, budget-conscious consumers or eco-friendly consumers who’d rather reuse than buy new, more and more people are buying used merchandise. In a July 2013 survey by America’s Research Group, nearly 20% of adults surveyed said they shopped at a secondhand store in the past year. According to the Association of Resale Professionals, there are an estimated 25,000 used merchandise stores in the United States, which includes thrift, resale, and consignment shops. This number is projected to increase by 7% annually.

The graphic shows U.S. sales made through used merchandise stores from 1992 through 2012. What is worth noting is the fact that, as is true for all categories of products, used merchandise is sold online as well as through retail outlets. The sales figures presented in the graphic do not include online sales of used merchandise, think eBay… We suspect that if those sales were added to the sales made through retail outlets, the significance of a shift towards used would be even more striking.

Today’s market size is the sales volume of used merchandise stores in the United States 2002 and 2012.

Geographic reference: United States
Year: 2002 and 2012
Market size: $9.5 and $13.4 billion respectively
Source: Lindsay VanHulle, “As Recession Alters Shopper Attitudes, Secondhand Shops Thrive,” Lansing State Journal, August 25, 2013, pages 1E, 3E. The graphic was made with data from the U.S. Census Bureau’s series of reports on the retail trade sector, specifically: “Estimated Annual Sales of U.S. Retail and Food Services Firms by Kind of Business: 1992 Through 2011,” released March 29, 2013 and available here.
Original source: First Research and the U.S. Bureau of the Census
Posted on August 28, 2013

Trade Books

The Association of American Publishers (AAP) tracks the sales of its members. It has had an increasingly difficult task in tracking sales over the last decade or so, as the industry deals with dramatic changes in distribution networks (bookstores), in the product itself (print versus digital) and in the rise of self-publishing. The AAP report on 2012 sales shows a 7.4% improvement in the sale of trade books over 2011. Trade books are defined as those intended for general readership and are sold through a general retail outlet—whether fiction or nonfiction, print or e-book, and/or brick-and-mortar stores or online sales. The total value of trade book sales in 2012 was, however, far short of that reached in 2007, the peak year for sales during the first decade of the new century.

Today’s market size is based on the sale of trade books, published by the large and middle-sized American book publishers—AAP members—in 2007 and 2012.

Geographic reference: United States
Year: 2007 and 2012
Market size: $8.53 billion and $6.53 billion respectively
Source: “Today’s Lunch: Weak December Doesn’t Spoil 2012 Trade Gain of 7.4 Percent,” article in the April 11, 2013, Publishers Lunch newsletter. Access to the newsletter’s website is here. The data on 2007 sales comes from “Association of American Publishers 2009 S1 Report — Estimated Book Publishing Industry Net Sales 2002-2009,” available online here.
Original source: Association of American Publishers
Posted on April 12, 2013

Office Supply Stores

The news last week that OfficeDepot and OfficeMax, two of the big three office supply retailers, are planning to merge made us think that a look at retail sales in this sector might be interesting. Sales made through stores dedicated to office supplies and stationery—an industry identified by the U.S. Census Bureau with the industry code NAICS 45321—have not been keeping up with the growth in retail sales generally since 2000. The 1990s were a period of strong growth for these retailers. Big box stores were spreading and doing well. Growth began to slow in the early 2000s and has declined each year since 2007, with the onset of a recession in December of that year.

Between 2000 and 2012, total retail sales in the United States—less auto-related sales—rose 58.6% while sales through office supply stores declined by 16.6%. Many factors are contributing to this decline. Primary among them are factors related to how we buy office supplies and not so much the volume of the supplies that we buy. The rising power of retailers with more general merchandise lines (Costco, Wal-Mart, etc.) is one significant factor as is the rise of online shopping.

Today’s market size is the value of sales at Office Supply and Stationery Stores in the United States in 1992, 2000, and 2012.

Geographic reference: United States
Year: 1992, 2000, 2012
Market size: $9.184, $22.75 and $19.11 billion respectively
Source: “Estimates of Monthly Retail and Food Services Sales by Kind of Business: 2012,” February 13, 2013, part of a series published by the U.S. Census Bureau monthly, and available here.
Original source: U.S. Department of Commerce, Bureau of the Census
Posted on February 25, 2013

Hardware Stores

Today’s market size is the value of sales made through hardware stores in the United States in 2011. Sales were down slightly from 2008 (0.06%) but higher than sales in 2009 and 2010. Hardware stores as measured here do not include large building supply stores such as Home Depot or Lowes. For those familiar with the industrial coding system [North American Industrial Classification System – NAICS] used by the U.S. Census Bureau, as well as the corresponding data gathering agencies in Canada and Mexico, this industry is number 44413.

Geographic reference: United States
Year: 2011
Market size: $20.13 billion
Source: “Annual Revision of Monthly Retail and Food Services: Sales and Inventories—January 1992 through March 2012,” Monthly & Annual Retail Trade, available online here.
Original source: U.S. Department of Commerce, Bureau of the Census
Posted on January 31, 2013

Christmas Decorations

Our last post looked at Christmas trees and it got us to thinking about all the decorations that go on those trees as well as on buildings, in buildings, and all over the place. Thus, today’s market size post is an estimate of the total spent on Christmas decorations in the United States last year. As the source explains, the 2011 figure was 8% above that spent the prior year.

Geographic reference: United States
Year: 2011
Market size: $6 billion
Source: Joe Mont, “$6 Billion for Christmas Lights?” MSN Money, December 12, 2011, available online here.
Original source: National Retail Federation and BIG Research.
Posted on December 19, 2012

Used Car Dealers

U.S. Used Car Dealer Sales, 1992-2011

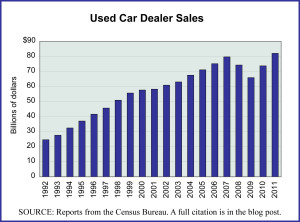
The U.S. auto industry was hit particularly hard by the last recession and financial crisis. For those selling used cars, the recession was less severe than for car manufacturers and new car dealers. As an industry, used car dealers saw a downturn in sales for two years (2008 and 2009) but by 2011 had completely recovered and exceeded their pre-recession sales while new car dealers were still 10% off of their 2007 peak sales.

The graph shows annual sales for U.S. used car dealers from 1992 through 2011. As can be seen in the graph, while the used car industry can usually weather a recession well, as demand for used cars is less impacted by an overall downturn than are sales of new cars, the recession from late 2007 through 2009 was not a “normal” recession. Financial system crises, as the one that started in 2008, lead to more severe and long-term troubles for the economy and they even impact industries that are immune to cyclical recessions.

Geographic reference: United States
Year: 2011
Market size: $82.07 billion
Source: “Estimates of Monthly Retail and Food Services Sales by Kind of Business: 2011,” Monthly Retail Trade Report, November 14, 2012, data for the NAICS industry 44112. The graph was sourced from the same report as well as the Annual Retail Trade Survey 2010, March 30, 2012. Both reports are available online at the Census Bureau website.
Original source: U.S. Department of Commerce, Bureau of the Census
Posted on November 19, 2012

Floor Covering Store Sales

Floor Covering Stores Sales, 1992--2011

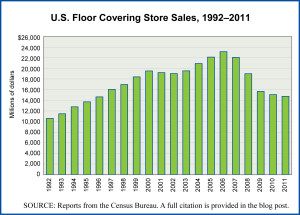
Today’s market size is the volume of sales made through U.S. stores whose primary line is floor coverings. Sales peaked in 2006 at $23.15 billion before falling sharply as the housing bubble burst and the financial crisis took a toll on all retailers. The sales shown here do not include the sale of floor coverings made through general merchandising stores. The impact over the last decades of the growth in sales of floor coverings through such outlets is part of what is seen in the trajectory of sales shown in the graph.

The graph shows annual sales through Floor Covering Stores in the United States from 1992 through 2011. The data for 2011 are preliminary and come from a separate Census Bureau report than the data for the rest of the years shown.

Geographic reference: United States
Year: 1992, 2006 and 2011
Market size: $10.50, $23.15 and $14.74 billion respectively
Source: “Estimated Annual Sales of U.S. Retail and Food Services Firms by Kind of Business: 1992 Through 2010,” Annual Retail Trade Survey 2010, March 30, 2012, and “Monthly Retail Trade and Food Services,” October 15, 2012, both reports are from the U.S. Census Bureau and available at the agency’s website here.
Original source: U.S. Department of Commerce, Bureau of the Census
Posted on November 14, 2012

Food and Beverage Store Sales

Food & Beverage Store Sales

In the United States, people pay less for food than anywhere else in the world, as a percentage of their total expenditures. Here is a link to a site with a very interesting world map showing U.S. Department of Agriculture and Euromonitor data on how much of our total expenditures we spend on food worldwide, nation by nation. As many people worry about the cost of food rising it is worth noting, at the most basic level, just how inexpensively we’re able to feed ourselves in the United States.

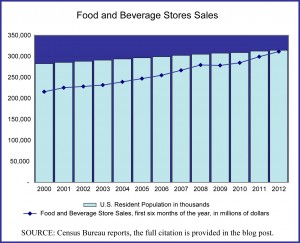
Today’s market size is the value of food and beverage store sales in the United States for the first six months of 2000 and 2012. The graph shows the first six months of each year’s food and beverage store sales for the entire period.

Geographic reference: United States
Year: 2000 and 2012 (January – June)
Market size: $215.6 and $311.2 billion respectively
Source: Monthly Retail Trade Report, August 14, 2012, part of a series of reports by the U.S. Census Bureau, available online here.
Original source: U.S. Department of Commerce
Posted on September 13, 2012

Electronics Stores

Our graph from Census Bureau data

While working on an analysis of the retail and wholesale sectors of the U.S. economy, a somewhat surprising thing emerged. The four fastest growing categories of brick-and-mortar stores, based on annual growth rates from 1992–2010 were: (1) Used Car Dealerships, (2) Health and Personal Care Stores, (3) Pharmacies and, (4) Radio, TV, and Other Electronics Stores. The last of these surprised us a bit, given the fact that such a large portion of the sale of electronics has moved online and the fact that the demise of a prominent player in the sector, Circuit City, seems pretty fresh in the mind.

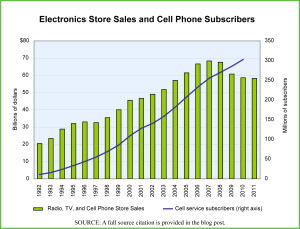
As it turns out, the important trend behind the strength of this retail sector is the rise of cell phones and all the new cell phone stores that one sees in shopping centers and strip malls across the United States. Cell phone stores are part of the category “Radio, Television and Other Electronics Stores” (NAICS 443112), the fastest growing sector in the overall Electronics and Appliance Retail industry (NAICS 443).

The graph shows annual sales from Radio, TV, and Cell Phone Stores in the United States from 1992–2011 and cell phone subscription figures for the period 1992–2010.

Geographic reference: United States
Year: 1992 and 2011
Market size: $20.5 billion and $58.3 billion respectively
Source: Annual Retail Trade Survey 2010, with updates from the Monthly Retail Trade Report series, available online here. The cell phone subscriber data are from the Statistical Abstract of the United States 2012, Table 1149, available from here.
Original source: U.S. Department of Commerce, Bureau of the Census
Posted on August 21, 2012

Vitamin Sales

Today’s market size comes from a report about U.S. vitamin purchases published by a consumer analytics firm. The report goes into some detail about where people make purchases of vitamins and how that has been changing over the past few years.

Geographic reference: United States
Year: 2012
Market size: $12.2 billion
Source: “Vitamin Market Survey Sees Buyer Deficiency,” Progressive Grocer, August 3, 2012, available online here.
Original source: TABS Group
Posted on August 20, 2012

Furniture Stores

Furniture Stores sales, annually, graphed

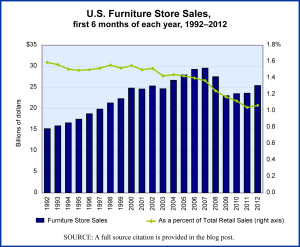
The sale of furniture—through furniture stores—in the United States has begun to recover from the significant hit it took as a result of the housing bubble collapse and the recession of 2007–2009. The graph we present here shows sales receipts for all furniture stores in the United States during the first six months of each year from 1992 through this year. The NAICS code (North American Industrial Classification System code) for furniture stores as measured here is 4421.

Geographic reference: United States
Year: 2007 and 2012 (first 6 months)
Market size: $29.6 billion and $25.4 billion respectively
Source: Annual Retail Trade Survey 2010, and updates from the Monthly Retail Trade Reports from the same reporting series, U.S. Census Bureau, available online here.
Original source: U.S. Department of Commerce, Bureau of the Census
Posted on August 17, 2012

Pharmacy & Drug Stores

Drug Retailing

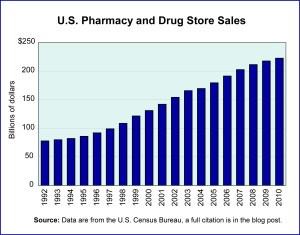
The sale of drugs, whether over-the-counter or prescription drugs, has been a healthy, growing business for a long time in the United States. The sale of these products through pharmacies and drug stores is the subject of our post today. The graph presents sales of these retailers over the period 1992–2010. The annual growth rate in sales over this period was 10.3%, a third faster than the economy as a whole, which grew at 7.2% annually.

Worth noting is the fact that over this same time period, the number of retail outlets selling drugs has increased as Big Box stores, grocery stores and others have gotten into the business of selling drugs with enthusiasm. Consequently, the role of pharmacies and drug stores in total drug sales has actually declined over this period.

Geographic reference: United States
Year: 2000 and 2010
Market size: $130.87 billion and $222.26 billion respectively
Source: Annual Retail Trade Survey 2009, and updates from the Monthly Retail Trade Reports from the same reporting series, U.S. Census Bureau, available online here.
Original source: U.S. Department of Commerce, Bureau of the Census
Posted on April 4, 2012

Prescription Drug Sales

Expenditures on health care in the United States have been much in the news for years now. The prices for prescription drugs are among the fastest growing of the segments of this overall industry. And yet, prescription drugs make up only around 10 percent of all expenditures on health care.

Today’s market size is the size of the market for prescription drugs sold through retail outlets in 2000 and 2010. In 2000 58 percent of the prescription drugs sold through retail outlets were brand name drugs. In 2010 brand-name drugs accounted for 29 percent of those sales.

Geographic reference: United States
Year: 2000 and 2010
Market size: $145.57 and $266.39 billion respectively
Source: Table 159. Retail Prescription Drug Sales,” Statistical Abstract of the United States 2012, page 113, U.S. Census Bureau, September 27, 2011, available here.
Original source: National Association of Chain Drug Stores
Posted on January 24, 2012

Clothing Stores

The sale of clothing in the United States is done through a variety of retail outlets, only a portion of which are stores dedicated primarily to the sale of clothes. Today’s market size is the value of all sales made through clothing stores in 2010. Of the total, family clothing stores had the largest share, accounting for 54% of the sales. The other clothing store segments, with their share of total clothing store sales, are as follows: women’s clothing (23%), men’s clothing (4.9%) and all other clothing stores (7.2%).

Geographic reference: United States
Year: 2010
Market size: $158.8 billion
Source: “Estimates of Monthly Retail and Food Services Sales by Kind of Business: 2010,” Monthly Retail Trade Report, available online here.
Original source: U.S. Census Bureau
Posted on January 9, 2012

Toys & Games

Today’s market size post is the size of the market for toys and games in 2007 based on total retail sales made in any retail outlet, from grocery stores and pharmacies to department stores and toy stores. For those wishing to investigate further, the market size posted here is based on the product category “toys, hobby goods and games” which is designated by the U.S. Census Bureau with the product code 20460.

Geographic reference: United States
Year: 2007
Market size: $90.55 billion
Source: “Sector 44: Retail Trade: Industry Series: Preliminary Product Lines Statistics by Kind of Business for the United States: 2007,” 2007 Economic Census, released on September 29, 2009available online here.
Original source: U.S. Census Bureau
Posted on December 21, 2011