Moving Services

Have you moved to a new residence in the past year? If you have, you’re not alone. According to the U.S. Census Bureau, nearly 32.4 million people changed residences from 2017 to 2018. While this might seem like a high number, as a percentage of the total population, it’s the lowest it has been in at least 70 years. From 1948 through the mid-1960s, the percentage of the population who moved during the year stayed steady around 20%, then declined from the mid-1960s to the 1980s, spiking briefly to 20.2% in 1984-1985. Since then the percentage of movers has trended downward, reaching 10.1% in 2017-2018. Most were interstate moves, 60.51%, but this was down from 65.51% a year earlier. According to the U.S. Census Bureau’s Current Population Survey, most people move to establish a new household or for other family reasons.1 Moving due to a new job or job transfer ranked third.

Today’s market size shows the total revenues for moving services in the United States. Companies in this industry transport used household, institutional, or commercial furniture and equipment via local or long-distance truck, as well as provide related packing and storage services. Various sources provide a wide range of total revenue figures. The American Moving and Storage Association states that annual revenues in this industry total $12.6 billion. IBISWorld reports revenues of $17.9 billion in 2019. The figure stated below is from Dun & Bradstreet. Nearly 70% of the revenue results from local and long-distance transportation services, followed by warehousing and storage services (20.2%). Packing and packaging services account for 7.5% of the total. Leading companies in this industry include UniGroup, which owns United Van Lines and Mayflower Transit; SIRVA, which owns Allied Van Lines and northAmerican Moving Services; and Atlas Van Lines. However, nearly 50% of companies in this industry are small businesses, employing fewer than 5 people. Only 8.5% of companies employ 100 people or more.

1 Other family reasons unrelated to establishing a new household or change in marital status. Change in marital status ranked fifth after moving to be closer to a job.

Geographic reference: United States
Year: 2019
Market size: $15 billion
Sources: “Moving Services Industry Profile,” Dun & Bradstreet First Research, June 3, 2019 available online here; “CPS Historical Migration/Geographic Mobility Tables,” U.S. Census Bureau, November 27, 2018 available online here; “About Our Industry,” American Moving and Storage Association available online here; Michael C., “Moving Trends & Relocation Industry Analysis,” Movers Development, May 10, 2019 available online here; “Moving Services Industry Insights From D&B Hoovers,” D&B Hoovers available online here; “Moving Services Industry in the US – Market Research Report,” IBISWorld, July 2019 available online here.
Image source: Clker-Free-Vector-Images, “movers-packing-box-light-vase-24403,” Pixabay, April 3, 2012 available online here.

Moving Day

Bar Chart

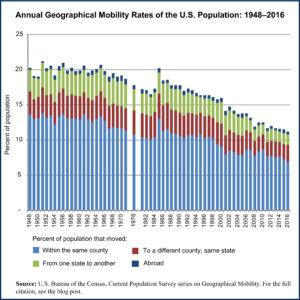
Today we are looking at the number of people who make a residential move in the United States each year. This is a measure of geographical mobility and has been tracked by the U.S. Census Bureau annually for decades. Using their data we produced a graph showing the annual percent of the U.S. population aged one year or more that moved from one place to another each year.

Americans think of themselves as a very mobile people, both in terms of economic mobility as well as actual, physical mobility. And yet, in truth, we are less mobile than we were in the past. As the data in the graph show, we actually move far less often now than in the past. The trend is towards fewer moves and moves of shorter distance.

There are many reasons for this change, from an aging population to less regional diversity in the growing service industries than existed in the manufacturing sector. An increasing use of occupational licensing practices and a declining rate of job changing in the United States also contribute to this change. (Yes, contrary to popular thought, we actually change jobs more infrequently than in the past.)

Some analysts see the declining rate of geographical mobility in the United States as one of the reasons behind a declining rate of productivity growth. Others see it as just another consequence of decreased median income growth. What is clear is the fact that we are staying put at much higher rates now than we did thirty years ago.

For those interested in reading more about this topic, we provide a link to further reading about it under the source note below.

Geographic reference: United States
Year: 1976 and 2016
Market size: 36.8 million (17.7% of the population) and 35.1 million (11.2%)
Source: “Table A-1. Annual Geographical Mobility Rates, By Type of Movement: 1948-2016,” Current Population Survey, Historical Migration/Geographic Mobility Tables, November 15, 2016, available here.
Original source: U.S. Department of Commerce.
Further reading: Tyler Cowen, “The Unseen Threat to America: We Don’t Leave Our Hometowns,” Time, February 22, 2017, available online here.

Home Sales

Housing

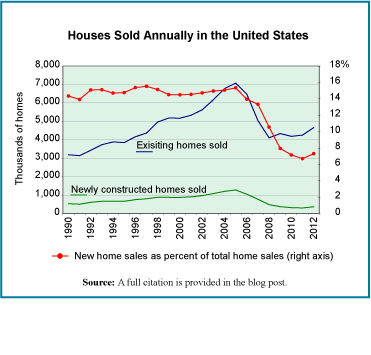
The residential housing market in the United States is beginning to show signs of recovery five years after the market crashed. While signs of recovery are there in the number of houses selling as well as the prices they are selling for, confidence in these signs appears to be weak and many in the real estate industry fear that a rise in interest rates could cause the housing market recovery to stall.

The graph shows home sales in the United States by number of new and existing homes sold annually. The percent of total sales made up of the sale of newly constructed homes is shown in red.

Today’s market size is the number and approximate value of newly constructed homes that were sold in 2005 (the peak year in terms of number of homes sold) and in 2012.

Geographic reference: United States
Year: 2005 and 2012
Market size: 1.283 million units for a value of $381.1 billion in 2005 and 364 thousand units in 2012 with a value of $107.5 billion
Source: “New Residential Sales, Historical Data,” U.S. Census Bureau, last updated on August 12, 2013, available online here.
Original source: U.S. Bureau of the Census and National Association of Realtors
Posted on September 30, 2013

Detroit Housing Stock

Much has been written in the national press about Detroit over the last week and in the wake of that city’s filing for bankruptcy protection on July 18th. The debates about how the situation was allowed to get so bad and what is to be done now have been lively. For those of us who live in the shadow of this once great city, none of this is new. These debates have raged here for years, and the march to insolvency has been a long one, like a Greek tragedy playing out in slow motion. It is the true scope of the challenge that is difficult for those not familiar with Detroit to fully understand.

Today’s market size post is the size of the housing market in the City of Detroit, more specifically, the total number of housing units in that city. The figure provided includes housing units that are not habitable. In fact, when one calculates the percentage of housing units in Detroit that are actually occupied the number is only around 20%. To further place this housing stock figure into context, the population of the city is also provided below as is the median sale price of a home in Detroit.

Geographic reference: Detroit
Year: 2011
Market size: Housing Units: 1,886,537
Market size: Population: 701,500 (2012)
Market size: Median Home Sale Price: $9,568 (in May of 2013 this median price had risen to $11,100)
Source: [1] “Detroit (city), Michigan,” State and County QuickFacts, a presentation of current U.S. Census data originally made available online here. For updated Census data, see the Further reading section below. [2] JC Reindl, “Chapter 9 Unlikely to Hurt Home Prices,” Detroit Free Press, July 21, 2013, page B1. [3] Charles B. Stockdale, Douglas A. McIntyre and Michael B. Sauter “American’s Ten Sickest Housing Markets,” NBCNews.com, August 5, 2011, available online here.
Original source: U.S. Census Bureau, S&P/Case-Shiller and Realcomp
Further reading: “Selected: Detroit city, Michigan; Michigan,” Quick Facts, U.S. Census Bureau available online here; “Detroit city, Michigan,” American FactFinder, U.S. Census Bureau available online here; “Detroit, MI Schools,” AreaVibes available online here.
Posted on July 23, 2013

Self-Storage Services

After decades of healthy consumer spending in the United States, it should not be a surprise that the self-storage business is doing very well in the country. Of the approximately 58,500 self-storage facilities in the world, 92% are located in the United States. We have accumulated more than we can fit in our homes and as of 2010 an estimated 10% of American households rented space in a self-storage facility in order to house their things.

Primary self-storage facilities—those for whom self-storage services were their primary business—generated revenues of $22.45 billion in the United States in 2011. It is a big business and one that has in recent decades been far more immune to economic cycles than most other businesses. Today’s market size is the actual size, in number of square feet, of interior storage space available in the United States in 1984 and in 2010.

Geographic reference: United States
Year: 1984 and 2010
Market size: 289.7 million and 2.24 billion square feet respectively. In per capita terms, we’ve grown from 1.23 square feet worth of storage capacity per person in 1984 to 72.2 square feet per person in 2010.
Source: “Self Storage Association Preamble,” June 2012, a detailed fact sheet on the industry that is presented by the association on its website here.
Original source: Self Storage Association
Posted on September 28, 2012

Title Abstract and Settlement Services

Part of the real estate build up over the last decade or so can be seen in the substantial growth of title abstract and settlement offices in the United States. In 1997 there were 6,391 such companies and in 2007, right before the bursting of the real estate bubble, there were 8,013. The size of the market in terms of the work done and the revenues generated saw even greater growth over this period.

The Census Bureau’s definition of this industry reads as follows: “This U.S. industry comprises establishments (except offices of lawyers and attorneys) primarily engaged in one or more of the following activities: (1) researching public land records to gather information relating to real estate titles; (2) preparing documents necessary for the transfer of the title, financing, and settlement; (3) conducting final real estate settlements and closings; and (4) filing legal and other documents relating to the sale of real estate. Real estate settlement offices, title abstract companies, and title search companies are included in this industry.”

Geographic reference: United States
Year: 1997 and 2007
Market size: $3.49 billion and $7.60 billion respectively
Source: “2007 Economic Census: Sector 54: Professional, Scientific, and Technical Services,” December 4, 2009, available online here, as well as the “1997 Economic Census” data on the same industry.
Original source: U.S. Bureau of the Census