Moving Services

Have you moved to a new residence in the past year? If you have, you’re not alone. According to the U.S. Census Bureau, nearly 32.4 million people changed residences from 2017 to 2018. While this might seem like a high number, as a percentage of the total population, it’s the lowest it has been in at least 70 years. From 1948 through the mid-1960s, the percentage of the population who moved during the year stayed steady around 20%, then declined from the mid-1960s to the 1980s, spiking briefly to 20.2% in 1984-1985. Since then the percentage of movers has trended downward, reaching 10.1% in 2017-2018. Most were interstate moves, 60.51%, but this was down from 65.51% a year earlier. According to the U.S. Census Bureau’s Current Population Survey, most people move to establish a new household or for other family reasons.1 Moving due to a new job or job transfer ranked third.

Today’s market size shows the total revenues for moving services in the United States. Companies in this industry transport used household, institutional, or commercial furniture and equipment via local or long-distance truck, as well as provide related packing and storage services. Various sources provide a wide range of total revenue figures. The American Moving and Storage Association states that annual revenues in this industry total $12.6 billion. IBISWorld reports revenues of $17.9 billion in 2019. The figure stated below is from Dun & Bradstreet. Nearly 70% of the revenue results from local and long-distance transportation services, followed by warehousing and storage services (20.2%). Packing and packaging services account for 7.5% of the total. Leading companies in this industry include UniGroup, which owns United Van Lines and Mayflower Transit; SIRVA, which owns Allied Van Lines and northAmerican Moving Services; and Atlas Van Lines. However, nearly 50% of companies in this industry are small businesses, employing fewer than 5 people. Only 8.5% of companies employ 100 people or more.

1 Other family reasons unrelated to establishing a new household or change in marital status. Change in marital status ranked fifth after moving to be closer to a job.

Geographic reference: United States
Year: 2019
Market size: $15 billion
Sources: “Moving Services Industry Profile,” Dun & Bradstreet First Research, June 3, 2019 available online here; “CPS Historical Migration/Geographic Mobility Tables,” U.S. Census Bureau, November 27, 2018 available online here; “About Our Industry,” American Moving and Storage Association available online here; Michael C., “Moving Trends & Relocation Industry Analysis,” Movers Development, May 10, 2019 available online here; “Moving Services Industry Insights From D&B Hoovers,” D&B Hoovers available online here; “Moving Services Industry in the US – Market Research Report,” IBISWorld, July 2019 available online here.
Image source: Clker-Free-Vector-Images, “movers-packing-box-light-vase-24403,” Pixabay, April 3, 2012 available online here.

Methamphetamine Laboratory Cleanup

MethLabs

The societal costs of the methamphetamine—crystal meth or simply meth for short—drug business, if we can call the trade in this illegal drug a business, is very difficult to calculate. It negatively impacts the health and welfare of the participants and the communities in which it is most active. These tend to be rural communities located in the mid-section of the country. The states fighting the largest battles with the meth trade are Missouri, Tennessee, Indiana and Kentucky.

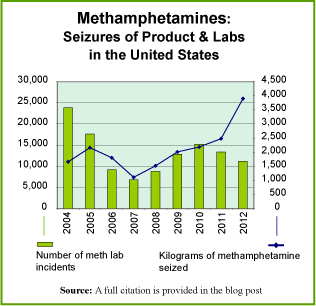
The graph shows the number of methamphetamine laboratory incidents reported by the Drug Enforcement Administration (DEA) over the period 2004–2012. An incident is any seizure of a meth lab, a dump site or stashes of chemical and glassware. The graph also shows the quantity of methamphetamine seized by the DEA over this period.

There is one cost associated with the meth trade, of so many costs to society, that has been a stimulus to a legal business activity. That is the cost of cleaning up clandestine laboratories in which this drug is produced, or cooked in the vernacular of this trade. The methods used to make this drug also produce a lot of hazardous fumes and byproducts. Therefore, meth labs must be handled carefully and then thoroughly cleaned up after a seizure. The cost of such cleanups depends greatly on the size of the facility but it can run anywhere from $1,000 per site to $25,000 per site or even more in some extreme cases. Specially certified waste management firms and environmental consulting firms are contracted to carry out this cleanup work.

Today’s market size is the estimated amount spent in the United States cleaning up meth labs in 2012. Worth noting is the fact that this money was concentrated in the ten states in which most meth trade occurs. Together these ten states represent 82.4% of all meth lab incidents. For more details on which states have the highest level of meth activity, go to the DOJ website listed as the third source below.

Geographic reference: United States
Year: 2012
Market size: $29 million
Sources: (1) Jonah Engle, “Merchants of Meth,” Mother Jones, July/August 2013, page 33. (2) “DEA Domestic Drug Seizures,” part of a U.S. Department of Justice web site available online here. (3) “Methamphetamine Lab Incidents, 2004–2012,” another DOJ offering on its website here.
Original source: U.S. Department of Justice
Posted on November 22, 2013

Dentistry

Dentists

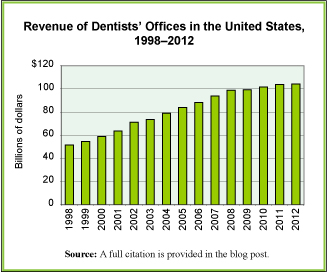
The practice of dentistry is a part of the overall health care industry and recent trends in this segment of the health care industry show a pattern similar to that of the industry as a whole. Steady growth. The graph shows estimated revenue taken in by Offices of Dentists annually from 1998 through 2012. While the rate of increase slowed a bit after the recession and financial crisis that hit in 2007 and 2008, growth in revenue continued. The growth in revenue for dentist offices between 1998 and 2012 exceeded inflation by 61.6% (dentistry’s 102.6% increase versus inflation which grew 41%).

Factors influencing that rate of growth for dentists are many of the same factors driving the overall health care industry, primarily among them, demographics and technology. As we age, we need more health care services of all sorts, including dental care. Technological advances are a driver in the field because they make available services that simply did not exist before and improve the ones that did. According to the American Dental Trade Association in the early 2000s nearly half of dentists’ revenues were being generated from procedures and treatments that were not available 20 years earlier.

Today’s market size is the total estimated revenue earned by offices of dentists in the United States in 2000 and in 2012.

Geographic reference: United States
Year: 2000 and 2012
Market size: $58.8 billion and $104.3 billion respectively
Sources: “Table 8.1. Health Care and Social Assistance (NAICS 62)–Estimated Revenue for Employer Firms: 2002 Through 2010,” Service Annual Survey 2010, U.S. Census Bureau, February 2012, page 171, a link to which is offered here. Data for years before 2002 come from the Service Annual Survey 2003, available from the same website. The data from 2011 and 2012 come from the “Estimated Quarterly Revenue for Employer Firms, Fourth Quarter 2003 Through Fourth Quarter 2012,” part of the same Annual and Quarterly Services tracking done by the Census Bureau in preparing their annual report. The quarterly data are available here. Jeffrey R. Lavers, “Market Trends in Dentistry,” Dental Economics, available online here.
Original source: U.S. Department of Commerce, Bureau of the Census
Posted on October 24, 2013

U.S. Legal Services Industry

Legal Service Industry value added in chained dollars

The private sector, legal services industry in the United States has not recovered since the recession that began in late 2007 as many other professional service sector industries have. While annual industry revenue for the legal services sector is up, it is not keeping pace with inflation. In fact, the industry has been declining as a percent of the economy almost steadily since the turn of the century. The graph we present here shows the industry from 1987 through 2011 in terms of real value added, thus adjusted for inflation.

Industry value added is defined by the Bureau of Economic Analysis as “…the contribution of a private industry or government sector to overall GDP. The components of value added consist of compensation of employees, taxes on production and imports less subsidies, and gross operating surplus. Value added equals the difference between an industry’s gross output (consisting of sales or receipts and other operating income, commodity taxes, and inventory change) and the cost of its intermediate inputs (including energy, raw materials, semi-finished goods, and services that are purchased from all sources).”

Today’s market size is the estimated revenue collected by private sector legal services firms in the United States in 2012. This industry is identified within the North American Industrial Classification System with the code 541100.

Geographic reference: United States
Year: 2012
Market size: $270.567 billion
Source: Matt Leichter, “U.S. Legal Sector Contracting Even As Nation’s Economy Recovers,” The AM Law Daily, March 6, 2013, available online here and “Table 1 – Selected Services Estimated Quarterly Revenue for Employer Firms Fourth Quarter 2003 Through Fourth Quarter 2012,” part of the “Annual Benchmark Report for Services,” a U.S. Census Bureau series of reports available at the site here. The data presented in our chart come from the Bureau of Economic Analysis website here.
Original source: U.S. Department of Commerce, Bureau of Economic Analysis and Census Bureau
Posted on March 18, 2013

Canada’s Legal Services

The legal services industry in Canada has grown annually since 2008 when it experienced a drop in revenues of 2.9% during the onset of the global financial crisis. Today’s market size is the value of total revenues earned by law firms—lawyers, barristers and solicitors primarily engaged in the practice of law— in Canada last year.

Geographic reference: Canada
Year: 2012
Market size: $26.7 billion.
Source: “Law Firms in Canada Industry Market Research Report Now Available from IBISWorld,” Digital Journal, March 6, 2013, available online here.
Original source: IBISWorld
Posted on March 14, 2013

Polling Services

The long political campaign season is finally over in the United States. One of the striking aspects of this year’s campaign cycle was the seemingly endless supply of new polling data, from multiple sources on a daily basis.

Today’s market size is the size of the revenues for the polling services industry in the United States, in 2002 and 2010. The industry is defined, within the North American Industrial Classification System, as follows: “This industry comprises establishments primarily engaged in systematically gathering, recording, tabulating, and presenting marketing and public opinion data.” Its industry code is 541910. The sorts of services provided by this industry include:

Broadcast media rating services
Marketing analysis services
Marketing research services
Opinion research services
Political opinion polling services
Public opinion polling services
Public opinion research services
Statistical sampling services

Geographic reference: United States
Year: 2002 and 2010
Market size: $10.89 billion and $16.74 billion respectively
Source: “Table 6.1. Professional, Scientific, and Technical Services (NAICS 54) – Estimated Revenue for Employer Firms: 2002 Through 2010,” 2010 Service Annual Survey, February 2, 2012, available online from the Census Bureau’s website.
Original source: U.S. Department of Commerce, Bureau of the Census
Posted on November 9, 2012

Nonemployer Professional, Scientific and Technical Services

We recently posted the size of the professional, scientific and technical services market in the United States, here, and today we add detail to that market post by offering the size of a subset of the market. Today we show the revenue for all nonemployer firms in this service industry which represents 8.6% of the total revenue generated by professional, scientific and technical service providers in 2009. Most nonemployer firms are individual proprietorships but some are partnerships and even corporations. The point is, they have no paid employees. There were 21 million such firms in the United States in 2009, 18.7 million of them were individual proprietorships.

Geographic reference: United States
Year: 2009
Market size: $118.3 billion
Source: “2009 Nonemployer Statistics: Geographical Area Series: Nonemployer Statistics by Legal Form of Organization: 2009,” one of the many offerings on the Census Bureau’s American FactFinder platform, available here.
Original source: U.S. Census Bureau
Posted on September 13, 2011

Veterinary Services

A sleepy looking Katie the Beagle

The downturn in the U.S. economy has not spared many but there is always some variation in how such a sharp economic slowdown hits some industries versus others. Veterinarians are among those who often see their base business less impacted than others. While dealing with declining revenues in 2009, veterinary service providers saw a decline of only 0.6% between 2008 and 2009. Of the 27 5-digit NAICS (North American Industrial Classification System) industries in the professional services sector, the veterinary services industry was one of four that saw revenues decline by 0.6% or less between 2008 and 2009. Many other professional service providers saw revenues decline by 15% or more.

Today’s market share is based on the estimated revenues earned by veterinary service providers in the United States in 2009.

Geographic reference: United States
Year: 2009
Market size: $25.64 billion
Source: “Table 6.1. Professional, Scientific, and Technical Services (NAICS 54) – Estimated Revenue for Taxable Firms: 2001 Through 2009,” page 1 and 2 of an extract from Service Annual Survey: 2009, available online here.
Original source: U.S. Bureau of the Census
Posted on August 30, 2011

Professional, Scientific and Technical Services

Professional Services

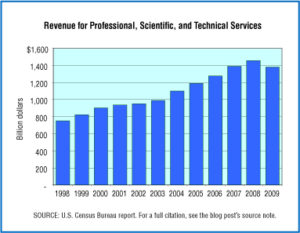
The sector of the U.S. economy that has been growing most strongly over the last decades is the Service Sector. The service sector includes all those who provide services instead of goods so, accountants, architects, computer programmers, consultants, doctors, hair stylists, lawyers, teachers and truckers to name but a few. The Census Bureau divides the Service Sector into eleven major categories and our market size today is one of those: Professional, Scientific and Technical Services, an industry whose revenues in 2009 represented 21.6% of all Service Industry revenues.

Over the period shown in the graph, 1998—2009, businesses providing professional, scientific and technical services saw their revenue grow by 85.3% which is 42.7% ahead of inflation.

Geographic reference: United States
Year: 1998 and 2009
Market size: $751.3 billion and $1,378.3 billion
Source: Services Annual Survey 2009, “Tables 1.1 Selected Service Industries – Estimated Revenue for Employer and Nonemployer Firms: 2005 through 2009,” and “Table 1.2 Selected Service Industries – Estimated Revenue for Employer Firms: 2005 through 2009,” pages 4 and 6, February 2011, available online here. Data in the graph are from earlier editions of this report series, links to which are available on a Census Bureau web page here.
Original source: U.S. Department of Commerce, Bureau of the Census