Diamond Rings

An article about wedding jewelry caught our attention. In a New York Times article over the weekend the subject of how much is spent in the United States annually on diamond engagement and wedding rings was presented. According to the article, couples paid an average of $4,000 on engagement rings in 2012 and another $1,000 for her wedding band, $500 for his. Now, averages, as we know, can be deceptive. What we were unable to find are statistics on just how many of these rings were purchased, which would be nice to know since the range in price for a diamond ring can be quite large. What we can say, by way of putting today’s market size into some context, is that in each year between 2000 and 2011 the number of marriages in the United States was between 2 and 2.3 million.

Today’s market size is the total value of diamond engagement and wedding jewelry sold in the United States in 2012.

Geographic reference: United States
Year: 2012
Market size: $11 billion
Source: Tara Siegel Bernard, “With Engagement Rings, Love Meets Budget,” The New York Times, February 1, 2014, page B1, available online here.
Original source: Bain & Company
Posted on February 3, 2014

Silica Sand for Hydraulic Fracturing

Sand

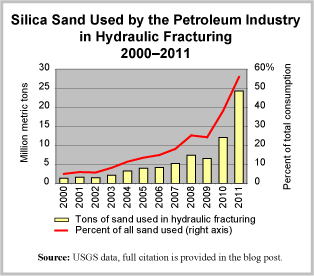
Yesterday’s post on the size of the world market for silica sand got us to thinking. So, we dug around in the U.S. Geological Survey’s Minerals Yearbook, to see if we could clearly see any trends in the use of silica sand in the United States. What we found was clear indeed and we present it here in a graph.

Overall, silica sand consumption has increased 62% from 2000 to 2011. The use of silica sand by the petroleum industry, for hydraulic fracturing, has grown 1,674%. The use of silica sand in oil and gas fracking operations was a relatively steady 5% of the overall demand for decades and began to rise in the mid-2000s. By 2011, it reached 56% of total demand for silica sand in the United States. Final data on 2012 are not yet available but all signs show that the trend seen in the graph has continued apace.

Today’s market size is the value of silica sand used in oil and gas hydraulic fracturing operations in the United States in 2001 and in 2011.

Geographic reference: United States
Year: 2001 and 2011
Market size: $47.5 million and $1.33 billion respectively
Source: Thomas P. Dolley, “Silica [Advanced Release]” Tables 1 and 6, 2011 Minerals Yearbook, March 2013, pages 66.1-66.10, USGS, available in PDF format here. Data from Tables 1 and 6 of the Silica chapter of each annual Minerals Yearbook from 2000 through 2010 were used and may be accessed at the USGS web site here.
Original source: U.S. Department of the Interior, U.S. Geological Survey (USGS)
Posted on January 31, 2014

Silica Sand

Sand is made up, primarily, of very small quartz (silicon dioxide, or SiO2) crystals. Quartz is one of the most common minerals found on the Earth’s surface, so it is both an easily found mineral and one we use in many, many ways. Sand is used in water filtration, in glass manufacturing, in industrial casting, as an abrasive in many applications, in producing concrete, in adding texture to slick roads, and as a filler in children’s sand boxes. Silica sand, however, has a higher price than the sand usually used to help on deicing roads and making concrete. This is because it is a purer sand, having the composition and grain-size distribution required for industrial applications. Silica sand has well-rounded, consistently sized granules of almost pure quartz grains.

The demand for silica sand has been rising steadily for years now. Globalization—if you will forgive such a sweeping generalization—is one of the main reasons, as is the increased demand worldwide for glass (think HD TVs, tablets and cell phones), and the significant increase in the use of hydraulic fracturing in the oil and gas industry. The hydraulic fracturing process for oil and gas extraction takes a mixture of silica sand (often called frac sand), water and chemicals and injects this mixture into a well under very high pressures. Small cracks form in the bedrock and the sand in the mixture helps to prop open these tiny fissures. From the fissures, conduits form that increase the flow of fluids and gas within the well.

Today’s market size is the value of silica sand sold worldwide in 2011 and a forecast for its value in 2016.

Geographic reference: Worldwide
Year: 2011 and a forecast for 2016
Market size: $6 billion and $9.2 billion respectively
Sources: (1) World Industrial Silica Sand, a brochure to promote an industrial study produced by The Freedonia Group and published in October 2012. The brochure is available online here. (2) “Industrial Silica Sand FAQs,” Minnesota Department of Natural Resources, last updated on October 31, 2012 and available here.
Posted on January 29, 2014

Czech Cement

Cement production in the Czech Republic has shown signs of a recovery in the first half of 2011. Today’s market size is the estimated total production of cement in Czechoslovakia in 2011.

Geographic reference: Czech Republic
Year: 2011
Market size: 3.3 million metric tons
Source: “Production Rise is Not the End of Czech Tunnel,” Global Cement Weekly, August 24, 2011, page 2, available online here.
Original source: Jan Hrozek, Chairman of the Ceskomoravsky Cement Company
Posted on August 25, 2011

Crushed Stone

Crushed Stone Sales Stats

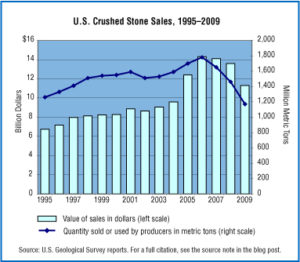
The market for crushed stone grew steadily through the first half of the last decade peaking in 2006 and then falling sharply as the housing market bubble imploded. The pattern can be seen clearly in the graphic which presents crushed stone sales, or use by producers, measured in quantity as well as value for the years 1995 through 2009.

Today’s market size is the value of crushed stone sales by producers in 2009. The data do not include American Samoa, Guam, Puerto Rico, or the U.S. Virgin Islands.

Geographic reference: United States
Year: 2009
Market size: $11.3 billion
Source: “Table 1: Salient Crushed Stone Statistics,” 2009 Mineral Yearbook, April 2011, page 71.5, available online here. The graphic was produced with data from this report as well as earlier editions of the same report.
Original source: U.S. Department of the Interior, USGS

Salt

World production of salt has grown at just above the rate of population growth over the last quarter century or so—global salt production grew by 35% while world population grew by 38% between 1985 and 2007. Salt is used in many ways, in the treatment of water, in agricultural applications, as an industrial input, in deicing operations and as a spice or food additive. In the United States, food-grade salt is the smallest of the categories of salt by end use. In fact, nearly two-thirds of U.S. salt consumption annually is related to the de-icing of roadways. This makes us wonder (with a bit of tongue in cheek) whether looking at changes in the number of paved roads there are in the northern reaches of the northern hemisphere and the southern reaches of the southern hemisphere may be a better gauge for predicting future salt demand in the world.

Today’s market size is the quantity of salt produced worldwide in 1985 and in 2007, measured in millions of metric tons.

Geographic reference: World
Year: 1985 and 2007
Market size: 190.6 and 257.0 million metric tons respectively
Source: “World Salt Production,” a spreadsheet presented on the Salt Institute’s web page, available online here.

Molybdenum

U.S. production and consumption figures for Molybdenum over 30 years

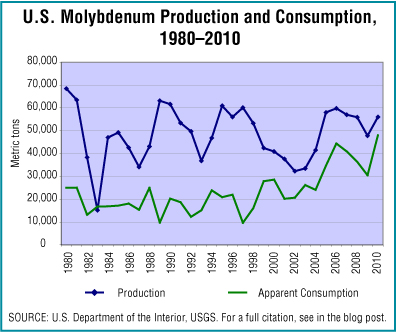
Molybdenum, a Group 6 chemical, is a refractory metallic element. The ability of molybdenum to withstand extreme temperatures without expanding or softening very much makes it useful in a variety of applications that involve intense heat. The manufacture of armour, aircraft parts, electrical contacts, industrial motors and filaments are among the industrial uses of molybdenum. It is used principally as an alloying agent in steel, cast iron, and superalloys to enhance corrosion resistance, strength, toughness, and weldability.

Today’s market size is the value of domestically produced molybdenum based on the average oxide price in 2010. The graphic shows production and apparent consumption figures for a period of 30 years, from 1980 to 2010. Apparent consumption is a calculated figure based on production, plus imports, minus exports, plus or minus change in stock.

Geographic reference: United States
Year: 2010
Market size: $885 million
Source: “Molybdenum Statistics and Information” part of a series of reports on different minerals and commodities produced by the U.S. Geological Survey and available online here.
Original source: U.S. Department of the Interior, U.S. Geological Survey (USGS)

Helium, Grade-A

Helium production and consumption

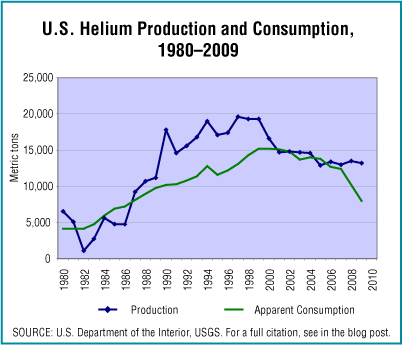
For those not involved in one of the industries in which helium is an input, the term may conjure images of party balloons. But, helium is used in a variety of industrial applications. In the United States its end users break down in the following categories: 32% for cryogenic applications; 18% for pressurizing and purging applications; 13% is used for welding; 18% for controlled atmospheres; 4% for leak detection; 2% for breathing mixtures and the remaining 13% for other applications, like party balloons.

Today’s market size is the estimated value of domestically extracted grade-A helium in 2010. The graphic shows production and apparent consumption figures for a period of 30 years, from 1980 to 2010. Apparent consumption is a calculated figure based on production, plus imports, less exports plus or minus change in stock.

Geographic reference: United States
Year: 2010
Market size: $730 million
Source: “Helium Statistics and Information,” part of a series of reports on different minerals and commodities produced by the U.S. Geological Survey and available online here.
Original source: U.S. Department of the Interior, U.S. Geological Survey (USGS)

Minerals in Wyoming

Taxable value of WY minerals

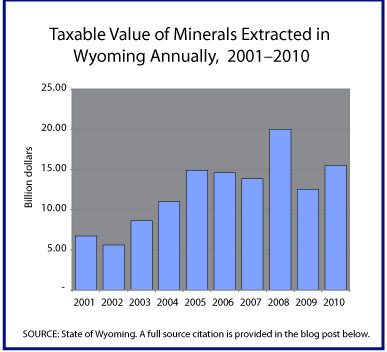
Mining and extraction industries in Wyoming saw a significant decline in 2009 after peaking in 2008 for the decade but 2010 saw a strong recovery over 2009. The graph shows taxable value for all minerals extracted annually in Wyoming from 2001 through 2010. Wyoming’s mineral wealth is providing the state with a strong base for recovery from the recession that began in December 2007.

Today’s market size is the total value of all minerals extracted in 2010. The minerals included in this total are oil, natural gas, coal, bentonite, trona, uranium, sand and gravel.

Geographic reference: United States
Year: 2001 and 2010
Market size: $6.74 and $15.49 billion respectively
Source: Barron, Joan, “State’s Mineral Valuation Booms,” Casper Star Tribune, June 1, 2011, page 1.
Original source: State of Wyoming

Iron & Steel

Iron & Steel in the U.S. over 30 years

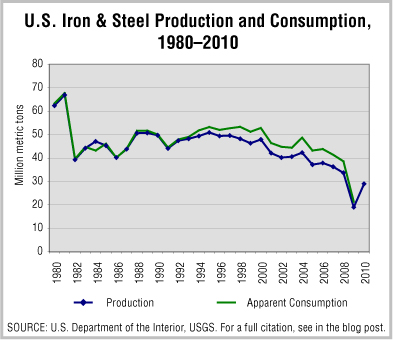
The year 2010 saw a strong recovery for iron ore production in the United States after a particularly strong downturn in 2009. The market size presented today is the value of all iron and steel production in the country in 2010. The state of Indiana accounted for 24% of the total raw steel production, followed by Ohio with 10%, and Michigan and Pennsylvania each accounting for 7%.

The graphic shows iron and steel production and apparent consumption figures for a period of 30 years, from 1980 to 2010. Apparent consumption is a calculated figure based on production, plus imports, minus exports plus or minus change in stock.

Geographic reference: United States
Year: 2010
Market size: $139 billion
Source: “Iron and Steel, Statistics and Information,” Mineral Industry Survey, a series of reports produced by the U.S.Geological Survey, made available online and last updated on May 19, 2011. Here is a link to the USGS site.
Original source: U.S. Department of the Interior, USGS

Cement

Cement Production Graph

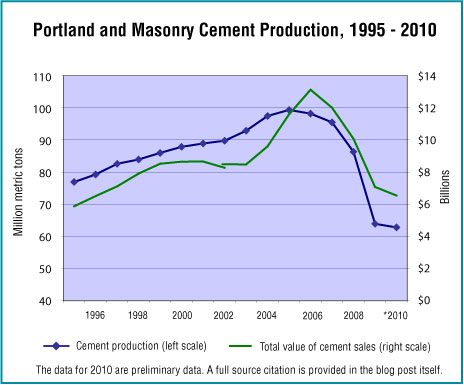
A decade plus worth of production data on the cement industry shows a pattern with which we are familiar, the build-up and crash of the housing market. Most of the construction materials industries have seen similar patterns of growth and decline in the 2000s. Early data on 2010 show that sales of cement in that year reached a 27 year low, falling 45% (59 million metric tons) off the high reached in 2005.

The market size presented below is the number of metric tons of portland and masonry cement produced in the United States in 2010 and the approximate value of that cement if shipped from the mill the same year.

Geographic reference: United States
Year: 2010
Market size: 62.8 million metric tons with an approximate value of $5.7 billion
Source: “Cement,” part of an annual series titled Mineral Commodities Summaries, published by the U.S. Geographical Survey and available online here.
Original source: U.S. Department of the Interior, USGS

Steel Production

The production of crude steel around the world rebounded in 2010, rising 15% over the 2009 production levels. In terms of crude steel production by nation, China led the world in 2010 with 44.32% of world production, followed by Japan with 7.75%, the United States with 5.70% and Russia with 4.47%.

Geographic reference: World
Year: 2010
Market size: 1,414 million metric tons
Source: “World Crude Steel Output Increases by 15% in 2010,” January 21, 2011, available online here.
Original source: World Steel Association

Iron Ore Mining

Today we look at iron ore, as a sort of hat tip to the anniversary of the sinking of the Great Lakes freighter, the Edmund Fitzgerald, thirty-five years ago today. The Fitzgerald was carrying iron ore pellets.

The Bureau of the Census definition of iron ore mining reads as follows: “This industry comprises establishments primarily engaged in (1) developing mine sites, mining, and/or beneficiating (i.e., preparing) iron ores and manganiferous ores valued chiefly for their iron content and/or (2) producing sinter iron ore (except iron ore produced in iron and steel mills) and other iron ore agglomerates.

Geographic reference: United States
Year: 2007
Market size: $2.96 trillion (value of primary product shipments)
Source: “2007 Economic Census: Sector 21: Mining: Preliminary Comparative Statistics for the United States 2007 and 2002”, October 16, 2009, available online here.
Original source: U.S. Bureau of the Census