Filters

automotive air filters
Automotive air filter
Geographic reference: World
Year: 2020 and 2028
Market size: $70.38 billion and $101.88 billion, respectively

Clean air and clean water. Two essentials for life on earth. In many ways, the use of filters is necessary for achieving this. Today’s market size shows total global revenues for filters in 2020 and projected for 2028. Growing concerns about reducing emissions from automotive and industrial applications as well as the increasing popularity of air and water purifiers among consumers will fuel demand for filters over this time period. 

By application, motor vehicles garnered more than 47% of the market in 2020, followed by consumer goods, utilities, industrial and manufacturing, and others. Increasing automotive production, especially in China, Indonesia, South Korea, Japan, Malaysia, and Taiwan along with stringent regulations aimed at reducing automotive pollution will create increased demand for automotive filters. Filters are used in several motor vehicle applications: oil intake, air filtration, and emission filtration. Filters for internal combustion engines accounted for more than 40% of the market in 2020. 

Fluid filter demand will increase due to the increased construction of water treatment plants globally. Fluid filters are also used in cold sterilization of beverages and pharmaceuticals, petroleum refining, dairy processing, and wine production. Air filters are expected to experience the fastest revenue growth through 2028 due to governments mandating the reduction of pollutants from vehicle emissions and the growing popularity of air purifiers that kill harmful bacteria and viruses in homes, hotels, airplanes, and train compartments. Demand for filters in the industrial and manufacturing sectors will center around Europe, North America, and the emerging industrialized regions of India, South Africa, Brazil, Thailand, and Indonesia.

The Asia-Pacific region held a 42% revenue share in 2020 due to the rapid industrialization in the region. The increasing pollution levels are leading governments to impose environmental quality regulations. As a result, demand for air and water filtration devices is expected to grow. In Europe, the rising demand for air filtration equipment in industries such as cement, chemicals, and metallurgy along with increasing adoption of air purifiers in Germany, France, Italy, and Spain will spur growth in this region. The North American automotive industry is expected to contribute to growth in filter revenue in this region. Also, technological breakthroughs in filtration processes, such as the implementation of nanotechnology, will lead to increased demand. In Central and South America, fluid filter demand is expected to significantly increase through 2028 as several wastewater treatment plants undergo construction due to growing water pollution levels in Brazil, Argentina, and Uruguay among others. The use of filters in Brazilian mining operations to control emissions is also expected to fuel demand in the region.

There are several major filter manufacturers around the world. Many companies are developing sustainable products that offer improved efficiency and value. Some are expanding their production capabilities to meet demand in various markets. Some major companies in this industry include 3M, Airex Filter Corp., Koch Filter, Freudenberg Filtration Technologies SE & Co. KG, Donaldson Co. Inc., Camfil AB, Parker Hannifin Corp., DENSO Corp., Clark Air Systems, and Spectrum Filtration Pvt. Ltd.

Sources: “Filters Market Size, Share & Trends Analysis Report by Product (ICE Filters, Air Filters, Fluid Filters), by Application (Motor Vehicles, Consumer Goods), by Region, and Segment Forecasts, 2021 – 2028,” Grand View Research Report Summary, March 2021 available online here; “Filters Market Size Worth $101.88 Billion By 2028 | CAGR: 4.7%: Grand View Research, Inc.,” CISION PR Newswire, April 5, 2021 available online here.
Image source: bb20_pt10, “air-filter-automotive-car-2690190,” Pixabay, August 28, 2017 available online here.

Welcome to the new Market Size Blog

We’re in the process of moving our website from one hosting site to another and redesigning it. Soon we’ll be fully up and running again but in the meantime, this site will be constantly changing and a little chaotic.

Once we’re ready we’ll have a little launch party.

Until then, cheers!

Retail Trade

This week we’ll take a look at how some sectors within the overall retail trade industry are faring during an era of structural change going on in our system for getting products from maker to end user. Our online purchases are rising quickly while restructuring within the distribution channel has caused some wholesale industries to be absorbed by the ends of the chain, manufacturers or retailers. To start off, a look at the Retail Trade Industry as a whole. Please note, these figures do not reflect the downturn suffered as a result of the recession which began, officially, in December 2007.

Geographic reference: United States
Year: 1997 and 2007
Market size: Number of Establishments: 1,118,447 and 1,122,703 respectively.
Market size: Sales: $2.46 and $3.93 trillion respectively.
Market size: Employment: 13.9 and 15.6 million respectively.
Source: “Sector 00: EC0700CADV2: All Sectors: Core Business Statistics Series: Advanced Compariative Statistics for the United States (2002 NAICS Basis): 2007 and 2002,” 2007 Economic Census, available online here. The data from 1997 are from the 1997 Economic Census.
Original source: U.S. Department of Commerce, Bureau of the Census.

Valentine’s Day as a Market

Based on a survey conducted for the National Retail Federation, spending on Valentine’s Day is expected to be up in 2011 after two down years in 2009 and 2010. For all those in the business of selling flowers, cards, chocolates, champagne, footie pajamas, and romantic dinners out, here’s hoping the forecast is correct!

Geographic reference: United States
Year: 2005 and 2011 forecast
Market size: $13.19 and $15.7 billion respectively.
Source: “Men to Pay High Price for Love on Valentine’s Day,” an NRF press release from January 31, 2006, available online here. The estimate for 2011 is from the same source, 2011 Valentine’s Day Consumer Intentions and Actions Survey, the press release for which is available here.
Original source: National Retail Federation and BIGresearch.

Coffee

In the Upper Midwest of the United States this time of year, our love of hot drinks is particularly noticeable, as it is, no doubt, anywhere the temperatures drop below freezing and stay there a while. This made us think of the market for coffee. The market sizes presented here are world production figures for two years.

The production of this commodity is tracked in 60-kilogram bags of the beans. The price of coffee is tracked by the International Coffee Organization and has been rising steadily in recent years. Based on the monthly composite indicator price at which coffee is traded on the New York market the price rose 160% between December 2000 and December 2009. Over the same period, world inventories grew by 40%. And, since December 2009 the price has continued to rise, reaching 173.9 cents per pound in November 2010, the equivalent to 260% of the price per pound back in December 2000. Savor every sip!

We could do a simple calculation to get a rough approximation of the value of coffee produced in 2010, based on the information in our source report. If the November composite price for all types of coffee beans was $1.74, then a 60-kilogram bag would cost about $47.33 and thus world production in 2010 was worth approximately $5.6 billion. Of course, this is a very crude approximation so take it for what it is worth.

Geographic reference: World
Year: 2008 and 2010
Market size: 133.6 million and 139 million 60-kilogram bags respectively.
Source: “Coffee: World Markets and Trade,” USDA Circular Series, Table 6 and Table 8, December 2010, available online here.
Original source: U.S. Department of Agriculture, Foreign Agricultural Service, and the International Coffee Organization.

Bricks

Today we look at the market size of another construction materials industry that has been hard hit by the housing crisis in the United States. The market size being presented here, for two different years, is the number of standard brick equivalents or SBEs shipped by the industry per year. It is worth noting that the interim years, between 1995 and 2009, saw strong sales and shipments—in the range of 8 to 9 billion SBEs—but did not skyrocket quite as much as some other construction material sectors.

Geographic reference: United States
Year: 1995 and 2009
Market size: 7.0 billion and 3.7 billion SBEs respectively.
Source: “Boral USA, Analyst Visit,” a presenation, table 60, September 2009.
Original source: Boral Ltd. and Brick Industry Association

Industrial Scrubbers

The sorts of scrubbers we’re looking at here are a diverse assortment of complex pollution control devices. They are used to control—reduce and capture— pollutants that are emitted during an industrial process. The market size presented here is based on an industry projection.

Geographic reference: World
Year: 2012
Market size: $6.5 billion
Source: Water World, October 2009
Original source: McIlvaine Company

Dialysis Market

This market size represents the number of tax dollars spent to care for those on dialysis every year in the United States. In October 1972, Congress made revisions to the Social Security Act so that anyone diagnosed with kidney failure, regardless of age or income, would have comprehensive coverage under Medicare.

Initially, before guaranteed payments from Medicare, hospitals provided most of the care on a nonprofit basis, albeit on a limited basis. In 2010, 80 percent of the clinics offering dialysis were for-profit, with two-thirds of those operated by two chains: DaVita Incorporated (based in Colorado) and Fresenius Medical Care North America (a subsidiary of a German company that makes dialysis machines and supplies). Together these two companies make $2 billion in operating profits per year. More than 100,000 people start dialysis each year in the United States. In 2010, there were nearly 400,000 patients receiving dialysis.

Geographic reference: United States
Year: 2010
Market size: $20 billion
Source: Robin Fields, “God Help You. You’re On Dialysis,” The Atlantic, December 2010, pages 82-92.

Refrigerators in Homes

The market size referred to in this post is the number of refrigerators that were in place in residential housing units in the United States in 2009. While the source does not specify that this is the number of full sized and primary refrigerators per residence, it would seem that that must be the case, since we all know somebody with an old refrigerator (or two) in the basement…

Geographic reference: United States
Year: 2009
Market size: 126,534,000
Source: “Housing Units—Characteristics by Tenure and Region: 2009,”
Statistical Abstract of the United States: 2011, Table 983, U.S. Census Bureau, page 616, available online here.
Original source: U.S. Department of Commerce, Bureau of the Census.

Number of Repossessed Homes

During the housing market crisis we have read many and often contradictory accounts of just how many homes are in foreclosure, or the number of homes being foreclosed upon, or the number of home mortgages in a delinquent state. The process of foreclosing on a delinquent mortgage is a lengthy one and the measures being spoken of in the media so often refer to measurements at different stages in this process. What we present here are the number of homes that were repossessed by the bank, the number of home foreclosures that reach the endgame in three different years.

Geographic reference: United States
Year: 2008, 2009 and 2010 (estimate)
Market size: 862,000, 918,000 and 980,000 housing units respectively
Source: “Record U.S. Foreclosures in 2009,” an article on the World Socialist Web Site, available online here. The 2010 figure was taken from “Number of Homes Taken by Lenders Tumbles,” SFGate.com a news site sponsored by Hearst Communications Inc. and available online here.
NOTE: A new RealtyTrac Press Release came out on January 13, 2011 and has been reported on by the AP here. The AP report states that over one million homes were repossessed in 2010. This heavily repeated figure is all over the news, blogospher, and Internet yet, oddly, we have been unable to obtain an actual figure of repossessed homes from a thorough search of the RealtyTrac web site. So, we shall leave our originally presented estimate as is.
Original source: RealtyTrac Inc.

Homes

After looking at the number of vacant homes in the United States, we turn to a measure of all houses in the country. The market size number presented below includes all single-family attached and detached units as well as apartments and condominiums, it is the total of all residential housing units.

This market size is broken out by type of housing unit in this way: Single family detached homes, 63.4%; single family attached (townhouses and the like), 5.5%; apartments and condominiums in 2 to 4 unit buildings, 7.8%; units in 5 to 9 unit buildings, 4.9%; units in buildings with 10 to 19 units, 7.4%; apartments and/or condominiums in buildings with 20 or more units, 7.4%, and manufactured/mobile homes, 6.8%.

Geographic reference: United States
Year: 2009
Market size: 130,112,000 housing units
Source: “Housing Units—Characteristics by Tenure and Region: 2009,”
Statistical Abstract of the United States: 2011, Table 983, U.S. Census Bureau, page 616.
Original source: U.S. Department of Commerce, Bureau of the Census.

Vacant Houses

In this year’s edition of the always useful Statistical Abstract of the United States, a publication we turn to often in our work, we found the number of vacant housing units (single-family attached and detached units as well as apartments, all capable of occupancy year-round).

Geographic reference: United States
Year: 2009
Market size: 13,688,000 units
Source: “Housing Units—Characteristics by Tenure and Region: 2009,” Statistical Abstract of the United States: 2011, Table 983, U.S. Census Bureau, page 616.
Original source: U.S. Department of Commerce, Bureau of the Census.

Mobile Phones Worldwide

The market size listed here is the number of mobile phones sold worldwide in the third quarter of 2010, of which, 19.3% were smartphones, as we saw in our last market size entry.

Geographic reference: World
Year: 3rd Quarter 2010
Market size: 417 million units
Source: “Gartner Says Worldwide Mobile Phone Sales Grew 35 Percent in Third Quarter 2010; Smartphone Sales Increased 96 Percent,” Gartner Newsroom press release dated November 10, 2010 and available online here.
Original source: Gartner Inc.

Champagne Consumption

Not surprisingly, the nation with the largest consumption of champagne is the nation in which champagne is made, namely, France. The French consume approximately 177.6 million bottles of champagne each year. In terms of per capita consumption, two of France’s territories actually out consume the French population. Guadeloupe has an annual per capita consumption of champagne that is the highest in the world at 3.74 bottles per person. Next is Martinique with a per capita consumption of 3.3 bottles per person and France comes in third with per capita consumption of just under 3 bottles per person (2.93 bottles).

For a list of the countries with the highest champagne consumption, look at the table to which we provide a link in the source note below. Column 3 shows the number of bottles sold annually by country, in millions, and column 7 shows the per capita, bottle consumption figure per country.

Happy New Year!

Geographic reference: World
Year: 2009 (based on publication date)
Market size: 300.62 million bottles annually
Source: de Nederlandse Champagne Pagina’s, a website presenting interesting statisitcs about the champagne business worldwide, available online here.

Toys, Dolls, and Games

The size of the retail market for toys, dolls, and games is our market size post for today. It seems a natural topic for this week of Christmas preparations.

Geographic reference: United States
Year: 2008
Market size: $21.6 billion
Source: “Toys — Industry Outlook,” Great American Group, Volume 121, available here.
Original source: The NPD Group, Inc.

Turkeys

The size of the market presented here is based on values at the wholesale level, farm receipts for sales of turkeys.

Geographic reference: United States
Year: 2009
Market size: $3.6 billion
Source: “U.S. Farm Sector Cash Receipts from Sales of Agricultural Commodities, 2006-2010F,” a table on the USDA’s Economic Research Service website, available online here.
Original source: Economic Research Service, United States Department of Agriculture

Tea Sales

While coffee is still the hot drink of choice for most Americans, sales of tea have been growing for more than a decade now. Tea sales rose 32% between 2005 and 2009 according to market researcher Packaged Foods.

Geographic reference: United States
Year: 2009
Market size: $8.5 billion of which 67.1% was sold at retail.
Source: Melissa Domsic, “E. Lansing Teahouse Brings Wanderers Home,” The Towne Courier, December 5, 2010, pages 14-15
Original source: Specialty Coffee Retailer

Rice in the United States

The size of the market presented here is based on values at the wholesale level, farm receipts for sales of rice.

Geographic reference: United States
Year: 2009
Market size: $3.0 billion
Source: “U.S. Farm Sector Cash Receipts from Sales of Agricultural Commodities, 2006-2010F,” a table on the USDA’s Economic Research Service website, available online here.
Original source: Economic Research Service, United States Department of Agriculture

Roads in Texas

As a nation of heavy drivers, it is not surprising that we have an awful lot of paved roads. And in this nation of drivers, the largest state in terms of the number of miles of paved roads is Texas. While Alaska is the state with the larger geographical area, it is sparsely populated compared to Texas, the state with the second largest number of square miles.

Geographic reference: Texas
Year: 2008
Market size: 306,404 miles
Source: “Table 1-1: Public Road Length, Miles by Functional Systems: 2008,” State Transportation Statistics 2009, page A-1.
Original source: Research and Innovation Technology Administration, Bureau of Transportation Statistics, U.S. Department of Transportation

Paved Roads

Roads by Type

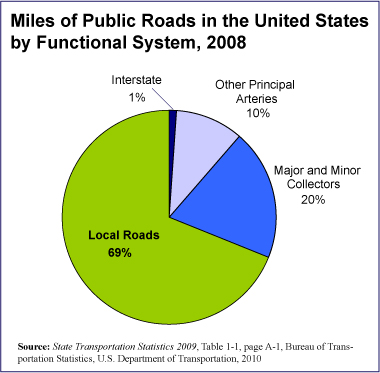
As a nation of heavy drivers, it is not surprising that we have an awful lot of paved roads. The market size presented here is for miles of paved, public roads in the United States. The chart shows how those roads are broken down by type: interstate freeways, other highways (arteries), smaller roads feeding the highway system (collector roads), and local roads.

Geographic reference: United States
Year: 2008
Market size: 4,042,778 miles
Source: “Table 1-1: Public Road Length, Miles by Functional Systems: 2008,” State Transportation Statistics 2009, page A-1.
Original source: Research and Innovation Technology Administration, Bureau of Transportation Statistics, U.S. Department of Transportation