Next Generation Sequencing

Next Generation Sequencing; DNAs double helix structure
On April 25, 1953, molecular biologist James Dewey Watson’s academic paper presenting DNA’s double-helix structure was published in the scientific journal, Nature.
Geographic reference: World
Year: 2020 and 2028
Market size: $3.99 billion and $11.7 billion, respectively

April 25th was National DNA Day. Events and celebrations commemorating the day are organized by the Human Genome Research Institute to encourage “people to learn more about the science that makes them genetically unique.”1 Why April 25th? On April 25, 1953, molecular biologist James Dewey Watson’s academic paper presenting DNA’s double-helix structure was published in the scientific journal, Nature. Francis Crick and Maurice Wilkins were co-authors. Almost 50 years to the day, on April 14, 2003, Human Genome Project scientists announced that the mapping of the human genome was complete.

Today’s market size shows total global revenues for next generation sequencing in 2020 and projected for 2028. Next generation sequencing (NGS), or massively parallel sequencing, describes a number of different modern sequencing techniques to directly determine the nucleic acid sequence of a DNA or cDNA molecule. NGS technology allows for the sequencing of DNA and RNA more quickly and cheaply2 with less DNA or RNA material needed than previous methods. Large-scale whole-genome sequencing can be done in one sequencing experiment. The Human Genome Project, which involved scientists at 20 institutions in France, Germany, Japan, China, the United Kingdom, and the United States, took 13 years to complete using the first-generation technique called Sanger sequencing. Sanger sequencing only sequences a single DNA fragment at a time. NGS sequences millions of fragments simultaneously. As a result, NGS may detect more novel or rare genetic variants.

NGS technology is popular among molecular biologists specializing in functional genomics. Functional genomics involves studying how genes function within a biological system, how genes interact with each other, and how genes interact with the environment. The oncology segment accounted for the largest share of revenues in 2020 at 28%. Leading companies are working toward an NGS-based diagnostics tool to detect cancer and analyze the genomic profiles of tumors to develop treatments for specific types of tumors. Some companies offer genetic testing to identify people who may be at higher risk of developing certain cancers. The development of targeted therapies, therapies targeted toward patients with specific or rare genetic biomarkers, is also increasing. 

The infectious disease segment of the industry is expected to be driven by the use of NGS technology to identify coronavirus strains. The technology is used to study the spread of COVID-19 and to map its evolution. The Covid-19 Genomics U.K. Consortium was formed in March 2020 to use Whole-Genome Sequencing (WGS) to analyze the coronavirus genome. Research is ongoing in the use of NGS technology to develop vaccines and therapies to treat the virus. WGS technology is expected to grow at a significant rate from 2021 to 2028 due to its use in tackling COVID-19.

Targeted sequencing and resequencing had a 73% revenue share in 2020. This is an economical alternative for WGS and allows for the in-depth investigation of genomic regions. RNA-based targeted sequencing is expected to have significant growth through 2028 due to the increasing demand for differential expression analysis. The use of this technology for the diagnosis of schizophrenia and other disorders and the increased availability of expression kits for customized panels are expected to contribute to its growth over this time period also.

Sequencing is a critical step in the genomics workflow. This segment experienced a 54% revenue share in 2020. Revenue in this segment is also expected to have the fastest compound annual growth rate through 2028 as the use of WGS increases. As the use of WGS increases, so too does the amount of data that needs to be analyzed. Increased spending on analysis and management tools for the sequenced data is expected to have a positive effect on revenue share.

Academic research had a 53% share in 2020, followed by clinical research, hospitals and clinics, and then pharmaceutical and biotech companies. Research accomplished at universities and research centers is expected to contribute to growth in the academic research sector through at least 2028. The clinical research segment is expected to grow the fastest from 2021 to 2028 due to the rising use of NGS-based diagnostic tests and the availability of commercial clinical research solutions from various companies. 

North America had a revenue share of 49.77% in 2020. The market was driven by several clinical laboratories that use NGS technology. Also, the development and launch of several new products using NGS technology are expected to increase market share through 2028. In August 2020, Quest Diagnostics started using the Automated NGS Engine to offer genetic risk screening for blood disorders, colon cancer, breast cancer, and heart diseases as part of AncestryHealth, a consumer genetics product of Ancestry. Although Ancestry decided to discontinue offering such tests in January 2021, Quest is continuing to develop applications that use NGS technology. The Asia Pacific region is expected to experience the fastest revenue growth through 2028 due to the presence of several leading NCS service providers in the region that offer their services to thousands of clinicians and hospitals across South Asia and India. 

The NGS industry is highly competitive. To gain market advantage companies have been focused on launching platforms that are rapid, small in size, and less expensive. In 2020 some companies introduced products to support research and development for COVID-19 vaccine development and products to sequence the complete genomes of viruses. Some leading companies in the NGS market include Illumina, QIAGEN, Thermo Fisher Scientific Inc., F. Hoffman-La Roche Ltd., Oxford Nanopore Technologies, Genomatrix GmbH, PierianDx, DNASTAR Inc., Eurofins GATC Biotech GmbH, Perkin Elmer Inc., BGI Genomics, and Bio-Rad Laboratories Inc.

1 Source: “National DNA Day — April 25, 2021,” National Today available online here.
2 In less than 20 years, the cost of sequencing the human genome dropped from $100 million to less than $1,000.

Sources: “Next Generation Sequencing Market Size, Share & Trends Analysis Report by Technology (Targeted Sequencing & Resequencing), by Application (Oncology, Consumer Genomics), by Workflow, by End-Use, and Segment Forecasts, 2021-2028,” Grand View Research Report Summary, February 2021 available online here; “Next Generation Sequencing Market Size Worth $11.7 Billion by 2028: Grand View Research, Inc.” CISION PR Newswire, February 23, 2021 available online here; “National DNA Day — April 25, 2021,” National Today, February 17, 2020 available online here; “Who Was Involved in the Human Genome Project?” your genome, June 13, 2016 available online here; “Ancestry to Discontinue NGS-Based AncestryHealth Service,” GenomeWeb, January 15, 2021 available online here.
Image source: Gerd Altmann, “dna-genetic-material-helix-proteins-3539309,” Pixabay, July 15, 2018 available online here.

Medical Foods

liquid medical foods
In 2020, more than 70% of medical foods were administered orally and more than half were in liquid, semi-liquid, or solid form.
Geographic reference: World
Year: 2020 and 2028
Market size: $20.15 billion and $30.34 billion, respectively

“An apple a day keeps the doctor away.” Most of us are familiar with this quaint expression from 1913. Although research studies have confirmed that an apple a day does not, in fact, result in fewer doctor’s visits, almost everyone can agree that eating nutrient-dense foods such as apples and other fruits, vegetables, whole grains, and various types of proteins can lead to a healthier life. 

But, what happens when a person cannot tolerate many of these healthy foods due to age or a chronic medical condition? In that case, physicians may prescribe medical foods so that their patients can continue to get the nutrition that they need. “Medical foods are foods that are specifically formulated and processed for a patient who requires [the] use of the product as a major component of a disease or condition’s specific dietary management.”1 In 2020, more than 70% of medical foods were administered orally. They can also be administered enterally through a feeding tube. They are always used under medical supervision. Sales at institutions such as hospitals, clinics, and care centers had the highest revenue share in 2020. Today’s market size shows total global revenues for medical foods in 2020 and projected for 2028.

Major contributing factors to growth in this market are the growing prevalence of malnutrition and diabetes worldwide. According to the World Health Organization, 462 million adults are underweight. Medical foods are considered the first choice to provide nutrients to malnourished patients. The number of people with diabetes has been increasing, reaching 463 million adults in 2019. By 2045, the number of adults with diabetes is projected to be 700 million. About 60-70% of diabetics suffer from neuropathy, damage to the nerves outside of the brain and spinal cord. The risk for neuropathy increases with age, unhealthy lifestyles, and poor nutrition. Medical foods for the prevention and treatment of diabetic neuropathy held the highest share of the market in 2020. 

Other conditions that may require medical foods include neurological conditions such as cystic fibrosis, stroke, and dementia which causes difficulty in swallowing; Crohn’s disease and ulcerative colitis which inhibit nutrient absorption from conventional foods; chemotherapy-induced diarrhea; and chronic kidney disease among others. Revenues for medical foods geared toward patients with chronic kidney disease are expected to have the highest compound annual growth rate (CAGR) through 2028 due to the rising incidence of chronic kidney disease, especially in those 65 years old and over, and patients’ changing nutritional needs. 

Due to their commercial availability and their ease of consumption, more than half of medical foods sold are in liquid, semi-liquid, or semi-solid form. The market share for liquid formulations is expected to increase due to this form being preferred by both the geriatric and pediatric populations. Some of the examples of liquid formulations are Nutrison Energy by Danone, Glucerna Therapeutic Nutrition Shake by Abbott Nutrition, and Novasource by Nestlé Nutrition. Revenues for powder formulation are expected to grow at the highest CAGR through 2028. Powder formulations are easy to administer and are convenient, having a longer shelf-life than other non-pill formulations, do not require refrigeration, and may be less expensive. Medical foods in pill form constitute the smallest market share.

By region, North America had the highest market share in 2020, 29.9%. The presence of leading companies in the industry along with an increasing prevalence of chronic conditions and a willingness by health care professionals and patients to utilize medical foods will lead to growth in this region. The Asia-Pacific region also has a strong presence from companies in this industry. As well, incidences of diabetes, malnutrition, obesity, cancer, and cardiovascular diseases are on the rise. Combined, the regions of North America, the Asia-Pacific, and Europe held more than three-quarters of the global market share in the medical foods industry.

In addition to the companies mentioned earlier, other leading companies in this industry include Fresenius Kabi AG, Targeted Medical Pharma Inc., Primus Pharmaceuticals Inc., Mead Johnson & Company LLC, and Metrition Inc. Primus Pharmaceuticals is the “first and only company specializing in prescription medical nutrition.”2 The company is headquartered in Scottsdale, Arizona.

1 Source: “Frequently Asked Questions About Medical Foods; Second Edition,” U.S. Department of Health and Human Services, Food and Drug Administration, Center for Food Safety and Applied Nutrition, May 2016 available online here. Only the United States and Europe have clear guidelines for medical foods defined by regulatory agencies.
2 According to the company’s website here.

Sources: “Medical Foods Market Size, Share & Trends Analysis Report by Route of Administration, by Product (Pills, Powder), by Application, by Sales Channel, by Region, and Segment Forecasts, 2021 – 2028,” Grand View Research Report Summary, January 2021 available online here; “Medical Foods Market Size Worth $30.34 Billion by 2028 | CAGR: 5.2%: Grand View Research, Inc.,” CISION PR Newswire, February 3, 2021 available online here; “Frequently Asked Questions About Medical Foods; Second Edition,” U.S. Department of Health and Human Services, Food and Drug Administration, Center for Food Safety and Applied Nutrition, May 2016 available online here; Rachael Link, “An Apple a Day Keeps the Doctor Away — Fact or Fiction?” Healthline, July 6, 2020 available online here; “Serving the Underserved…Safely,” Primus Pharmaceuticals available online here.
Image source: tookapic, “milk-liquid-flowing-pouring-bottle-933106,” Pixabay, October 7, 2015 available online here. Picture is used for illustration purposes only. Milk is not considered a medical food.

Blood Collection Products

blood collection tubes
Geographic reference: World
Year: 2018 and 2026
Market size: $8.5 billion and $13.99 billion, respectively

A nurse at a hospital drawing blood to check a patient’s white cell count after treatment. A phlebotomist at a diagnostic laboratory drawing blood to check a patient’s cholesterol levels as part of a routine physical exam. People donating blood at a Red Cross blood drive. Most adults, and some children, are familiar with blood collection products: needles and syringes, blood collection tubes, blood bags, and others. Today’s market size shows total global revenues of blood collection supplies in 2018 and projected for 2026. The increasing incidence of infectious and non-communicable diseases, as well as the rising number of people injured as a result of trauma and accidents, will contribute to growth in this industry.

In 2018, the needles and syringes segment garnered the highest revenue share due to the high demand for surgical procedures and diagnostics. Because of this demand, this segment is expected to maintain its dominance in the future. The market for blood collection tubes and blood bags is expected to experience significant growth through 2026. The growing incidence of disease drives the market for blood testing methods, which in turn drives the market for blood collection tubes. Technological advancements, such as collection tubes that mechanically separate blood cells from plasma, will also drive revenue growth. Blood bags are used for the storage and transfusion of blood. According to the World Health Organization, globally about 117.4 million blood donations are collected each year. Blood donations increased by 7.8 million between 2013 and 2018. In high-income countries, those over the age of 65 account for up to 75% of all transfusions, anemia being the most prevalent of blood disorders in these hospitalized patients. An aging global population will add to this demand.1 Transfusions are also commonly given during cardiovascular surgery, transplant surgery, and when a patient has trauma-related injuries. In addition, they’re used as therapy for tumors and hematological cancers. In low- to middle-income countries, blood transfusions are most commonly used to manage pregnancy-related complications, anemia due to childhood malaria, and trauma-related injuries.

The diagnostic segment held the highest revenue share in 2018. The increasing prevalence of chronic and infectious diseases,2 the rising number of screening and diagnostic tests, along with the expanding recognition of the benefits of regular health checkups are contributing to growth in this segment. Because hospitals serve as the primary places for the diagnosis and treatment of diseases, the hospital segment claimed nearly half of revenues in 2018. Diagnostics centers, which had the second-highest revenue share in 2018 at about one-quarter, are expected to gain a substantial share through 2026. These centers offer technologically advanced laboratory devices that allow for faster test results.

By region, North America had the highest revenue share in 2018, followed by Europe. North America has a highly-developed healthcare infrastructure in which innovative and advanced technology is readily adopted. Increasing research and development activities in the region with a focus on clinical research is also driving growth. Several major diagnostic companies have a presence there, such as Abbott Laboratories;3 Medtronic; Bector, Dickinson and Company; NIPRO Medical Corp.; and Haemonatics Corp. Other major global companies in the blood collection product industry include Qiagen N.V., Greiner Holding AG, Sarstedt AG & Co., and FL MEDICAL s.r.l.

1 Globally, the percentage of people over the age of 65 grew from 6% in 1990 to 9% in 2019 and is projected to reach 16% by 2050.
2 Cancer, cardiovascular diseases, sickle cell anemia, hemophilia, malaria, dengue, and yellow fever, to name a few.
3 According to Abbott Laboratories, about 4 billion tests are conducted using its testing platforms every year.

Sources: “Blood Collection Market Size, Share & Trends Analysis Report by Product (Needles & Syringes, Blood Collection Tubes, Blood Bags, Others), by Application (Diagnostics, Treatment), by End-Use, and Segment Forecasts, 2019 – 2026,” Grand View Research Report Summary, November 2019 available online here; “Blood Collection Market Size Worth $13.99 Billion By 2026 | CAGR 6.6%: Grand View Research, Inc.,” CISION PRNewswire, February 13, 2020 available online here; “Blood Transfusion,” World Health Organization, June 10, 2020 available online here; World Population Ageing 2019 Highlights, United Nations Department of Economic and Social Affairs, 2019 available online here.
Image source: Belova59, “laboratory-medical-medicine-hand-3827736,” Pixabay, November 25, 2018 available online here.

Metabolomics

laboratory metabolomics
Metabolomics is the comprehensive analysis of metabolites in a biological specimen.
Geographic reference: World
Year: 2020 and 2025
Market size: $1.9 billion and $4.1 billion, respectively

Metabolomics is the “comprehensive analysis of metabolites in biological specimens.”1 Metabolites are substances made when the body breaks down food, drugs, chemicals, or tissue (fat or muscle tissue, for example). These substances create energy and are needed for growth, reproduction, ridding the body of toxic substances, and maintaining health. The process for creating these substances is called metabolism. More than 9,400 metabolites have been detected by scientists to date, according to the Human Metabolome Database, but scientists believe that the human metabolome consists of more than a million compounds. Metabolomics is a relatively new field of study, only coming into existence in the late 1990s.

Scientists use metabolomics to research possible therapies for a variety of illnesses such as cancer, cardiovascular disorders, neurological disorders, and metabolic disorders. The increasing number of people with cancer and higher demand for cancer treatments account for the cancer segment having the largest market share in 2020. This segment of the industry is also expected to have the fastest growing revenues through 2025.

Today’s market size shows the total global revenues for the metabolomics market in 2020 and projected for 2025. Increasing research and development investment in the pharmaceutical and biopharmaceutical segment of the economy, especially at academic and research institutions, along with growing demand for personalized medicine will contribute to growth in this industry. The high costs of instruments and problems with data examination and processing, however, are likely to stifle some growth.2 Even so, the metabolomics instrument market accounted for the largest market share in 2020 as technological advancements, an increasing number of research-related activities, and the shoring up of healthcare infrastructure in developing countries contributed to demand.

Thanks to technological advances, the metabolomics industry has been instrumental in biomarker discovery. Biomarkers are measurable substances in bodily fluids or tissue, the presence of which can be indicative of disease, infection, or environmental exposure. A biomarker can be used to test how well the body responds to treatments for a disease. As an example of biomarker research, George Washington University researchers are studying 5 biomarkers in the blood of those with COVID-19 to see if there is a correlation between having certain biomarkers and the severity of the disease. If there is a correlation, this could lead to a blood test to determine which patients will have a more severe form of the disease and will need to be monitored and/or hospitalized and which can be sent home for quarantining and bed rest.

By region, North America had the highest share of the market in 2020. Thirteen of the top 20 major corporations in the industry are located in the United States. These include Waters Corp., Agilent Technologies, Thermo Fisher Scientific, Danaher Corp., Bruker Corp., PerkinElmer, GE Healthcare, LECO Corp., Metabolon, Inc., Bio-Rad Laboratories, Scion Instruments, SRI Instruments, and JASCO Inc. Other major companies in this industry located elsewhere include Merck KGaA (Germany), Hitachi High Technologies Corp. (Japan), Human Metabolome Technologies Inc. (Japan), DANI Instruments S.p.A. (Italy), GL Sciences (Japan), and Kore Technologies Ltd. (United Kingdom). Revenues in the Asia-Pacific region are expected to grow the fastest through 2025. Several pharmaceutical companies have moved their research, development, and manufacturing operations to the region — especially to India and China where there are large numbers of qualified researchers — to tap into the growing market and to lower the costs of production.

1 Clary B. Clish, “Metabolomics: An Emerging but Powerful Tool for Precision Medicine,” Cold Spring Harbor Molecular Case Studies, October 2015 available online here.
2 Unlike other omics where comprehensive data can be gathered using a single analytic platform, metabolomics relies on a combination of analytical platforms, each with its own advantages and disadvantages. As a result, laboratories have to have a variety of instruments available, each potentially costing in the hundreds of thousands of dollars. In addition, universal procedures for sample preparation, analysis, and interpretation of results are currently few or nonexistent.

Sources: “Metabolomics Market by Product, Application, Indication, End User – Global Forecast to 2025,” ReportLinker Summary, December 2020 available online here; Clary B. Clish, “Metabolomics: An Emerging but Powerful Tool for Precision Medicine,” Cold Spring Harbor Molecular Case Studies, October 2015 available online here; Farhana R. Pinu, et. al., “Translational Metabolomics: Current Challenges and Future Opportunities,” Metabolites, June 2019 available online here; “The Global Metabolomics Market Size is Projected to Reach USD 4.1 Billion by 2025 from USD 1.9 Billion in 2020, at a CAGR of 13.4%,” GlobeNewswire, December 24, 2020 available online here; David S. Wishart, “Metabolomics for Investigating Physiological and Pathophysiological Processes,” Physiological Reviews, August 21, 2019 available online here; “The Human Metabolome Database,” The Metabolomics Innovation Centre available online here; “Blood Test May Point to Patients at Higher Risk for COVID-19 Deterioration, Death,” George Washington School of Medicine and Health Sciences Press Release, August 5, 2020 available online here; Max Roser and Hannah Ritchie, “Cancer,” Our World in Data, July 2015, Revised November 2019 available online here; “Metabolite,” NCI Dictionary of Cancer Terms available online here; “Biomarker,” NCI Dictionary of Cancer Terms available online here.
Image source: Belova59, “laboratory-medical-medicine-hand-3827745,” PIxabay, November 25, 2018 available online here.

Cornea Exports

cornea eye
The cornea helps the eye focus light so a person can see clearly.
Geographic reference: United States
Year: 1999, 2009, and 2019
Market size:12,745; 17,178; and 28,402 respectively

A cornea is the transparent, dome-shaped layer at the front of the eye. It helps the eye focus light so a person can see clearly. If the cornea is damaged by injury or disease, a cornea transplant may be necessary to restore a person’s sight. Corneal blindness is a condition where the cornea is damaged but the rest of the eye functions properly. In the United States, the most common cause of corneal blindness in those that undergo a cornea transplant is advanced Fuchs’ dystrophy. This condition is characterized by fluid buildup in the cornea causing it to swell and thicken. Other conditions that can cause corneal blindness include keratoconus, infectious keratitis, and bullous keratopathy. In 2019, there were more than 136,000 whole eye and cornea donations to U.S. eye banks, 59% of which were procured from registered organ donors; the rest by authorization through the next of kin. A total of 85,601 cornea transplants were performed globally with donations from U.S. eye banks. More than 95% of cornea transplants are successful.

It’s estimated that up to 10 million people worldwide suffer from corneal blindness. In 2012, the last year for which data exists, there was one cornea available for every 70 needed.1 That year there were 184,576 corneal transplants performed in 116 countries. These corneas were procured from more than 283,000 donations in 82 countries. Today’s market size shows the number of corneas exported by the United States in 1999, 2009, and 2019 for use in corneal transplants performed internationally. The United States is the largest exporter of corneas in the world, followed by Sri Lanka, Italy, the Philippines, the Netherlands, the Czech Republic, France, Australia, and Colombia. Currently, the U.S. exports about a third of all cornea tissue recovered by eye banks in the country.

1 Artificial corneas have been used for more than 50 years, but it has been only recently that the devices have become reliably successful. For most patients, however, using donated corneal tissue is the best option. Artificial corneas may be used when the patient has had multiple previous cornea graft failures, or severe ocular surface disease, such as after chemical burns, or when the patient has Stevens-Johnson syndrome, limbal stem cell deficiency, congenital aniridia, or severe dry eyes.

National Donor Day is February 14. “National Donor Day is a time to focus on all types of donation – organ, eye, tissue, blood, platelets and marrow – by participating in blood/marrow drives or donor registration events. It is also a day to recognize our loved ones who have given the gift of donation, have received a donation, are currently waiting or did not receive an organ in time.” — Donate Life America


Sources: 2019 Eye Banking Statistical Report, Eye Bank Association of America, April 2020 available online here; Philippe Gain, MD, PhD, et. al., “Global Survey of Corneal Transplantation and Eye Banking,” JAMA Ophthalmology, December 3, 2015 available online here; Philippe Gain, MD, PhD, et. al. “Supplementary Online Content to the Global Survey of Corneal Transplantation and Eye Banking,” JAMA Ophthalmology, December 2015 available online here; “2019 Year in Review,” Eye Bank Association of America, April 2020 available online here; “Fuchs’ Dystrophy,” Mayo Clinic available online here; “Important Information About Cornea Donation,” Saving Sight available online here; “Artificial Cornea,” Cornea Research Foundation of America available online here.
Image source: Daniil Kuz̆elev, Untitled, Unsplash, August 1, 2017 available online here.

Medical Device Outsourcing

Medical device; pacemaker
Pacemaker. The cardiology segment of the medical device outsourcing market claimed the highest revenue share in 2019 and is expected to be the fastest growing segment through 2027.
Geographic reference: World
Year: 2019 and 2027
Market size: $104.5 billion and $231.2 billion, respectively

Today’s market size shows total global revenues for medical device outsourcing. Think about “outsourcing” and you might think “manufacturing,” especially if you live in the United States.1 In this case, you would be mostly correct. Contract manufacturing claimed 55.8% of the market in 2019. What other aspects of the business do medical device firms outsource? A quarter of the revenue came from a combination of quality assurance services, product design and development services, and product testing and sterilization services. Revenue from regulatory affairs services, product implementation services, product upgrade services, and product maintenance services rounded out the rest of the market. More than 300 medical device contract research organizations offer services such as clinical trial monitoring, clinical data management, initiation of clinical trials, medical writing, formulation of clinical strategies, and clinical product management.

Chronic diseases are on the rise across the world. Since 1990, rates of diabetes climbed 148%, chronic kidney disease 93%, ischemic heart disease 50%, and COPD 26%. As chronic disease rates rise, demand for medical devices also rises. The cardiology segment had the highest revenue share in 2019 and is expected to be the fastest-growing segment through 2027. In vitro diagnostic device (IVD) segment revenues are also expected to experience significant growth over this time period. IVDs are defined as “reagents, instruments, and systems intended for use in [the] diagnosis of disease[s] or other conditions, including a determination of the state of health, in order to cure, mitigate, treat, or prevent disease or its sequelae. Such products are intended for use in the collection, preparation, and examination of specimens taken from the human body,” according to the U.S. Food and Drug Administration.

The Asia-Pacific region had the highest revenue share for medical device outsourcing in 2019 and is expected to continue to hold the highest share through 2027 due to increasing research and development, adoption of new technology, availability of a skilled workforce, and lower cost of devices. North America also had a significant share of the market owing to its advanced electronics sector. Some leading companies providing outsourcing services to medical device firms include SGS SA, Toxikon Inc., Eurofins Scientific, Pace Analytical Services LLC, Intertek Group PLC, Wuxi Apptec, North American Science Associates Inc., Tüv Süd AG, American Preclinical Services, Sterigenics International LLC, and Charles River Laboratories International Inc.

1 In the United States, manufacturing jobs averaged a high of 19,428,000 in 1979 and fell to a low of 11,529,000 in 2010, a loss of more than 7.8 million jobs. While not all of these job losses were due to outsourcing—some were due to automation—the focus of the discussion around this issue has been on companies closing plants in the United States and opening them across the border in Mexico and overseas in the Asia-Pacific region. By 2019 manufacturing employment rebounded slightly to 12.8 million. For more information about the manufacturing sector as a whole and individual NAICS industries in the United States, see Manufacturing & Distribution USA, 9th Edition.

Sources: “Medical Device Outsourcing Market Size Worth $231.2 Billion by 2027,” Grand View Research Press Release, February 2020 available online here; “Medical Device Outsourcing Market Size, Share & Trends Analysis Report by Service (Quality Assurance, Regulatory Affairs Services), by Application (Cardiology, Diagnostic Imaging, Orthopedic), by Region, and Segment Forecasts, 2020 – 2027,” Grand View Research Report Summary, February 2020 available online here; “Manufacturing: NAICS 31-33,” Industries at a Glance, U.S. Bureau of Labor Statistics available online here; Mary Van Beusekorn, “Global Study Shows Deadly Convergence of Chronic Disease, COVID-19,” Center for Infectious Disease Research and Policy, University of Minnesota, October 16, 2020 available online here; “Overview of IVD Regulation,” U.S. Food and Drug Administration, September 16, 2019 available online here; “Global Burden of 369 Diseases and Injuries in 204 Countries and Territories, 1990-2019: A Systematic Analysis for the Global Burden of Disease Study 2019,” Global Health Metrics, October 17, 2020 available online here; “The Medical Device CRO Market is Projected to Reach USD 15.7 Billion by 2030, Growing at an Annualized Rate of 6.4%, Claims Roots Analysis,” CISION PR Newswire, June 23, 2020 available online here.
Image source: Ulrike Leone, “pacemaker-cardiac-pacemaker-1943662,” Pixabay, January 3, 2017 available online here.

Telehealth

Telehealth telemedicine
Telemedicine had the highest revenue share in the telehealth market.
Geographic reference: World
Year: 2019 and 2027
Market size: $61.4 billion and $559.52 billion, respectively

The concept of telehealth is nothing new. An 1879 article in the Lancet spoke about using the telephone to reduce unnecessary office visits and in 1925 the cover of Science and Invention magazine showed a doctor diagnosing a patient by radio. Inside, the article speculated that one day there would be a device that allowed for video examination of a patient remotely.

While telehealth has been used in a clinical setting for decades, the coronavirus pandemic has brought it to the forefront of many people’s minds, especially one aspect: telemedicine. As businesses shut down due to the COVID-19 pandemic, so too did many doctors’ offices in order to protect doctors and staff from contracting the virus from the patients. Despite the shutdown, patients still needed medical care. As a result, many doctors consulted with patients via online videoconference or phone calls. In April 2020, 43.5% of primary care physician visits by those insured by Medicare1 were via telemedicine compared to 0.1% in February 2020 before the public health emergency (PHE) was declared.2 Overall, 6% of primary care visits in the United States were via telemedicine before the PHE, and 30% after.

Telehealth refers to health information services, health care education, and health care services delivered remotely using technology. In addition to doctor-patient consultations, telehealth includes health education services, remote monitoring of vital signs, ECG, and blood pressure, and telecare. Telecare involves remote monitoring devices and medical alert systems that allow physicians to continuously monitor patients to track changes over time and be alerted to emergency situations. For the patients, these monitors allow them to maintain independence and safety while living in their homes.

Today’s market size shows global telehealth revenues for 2019 and projected for 2027. Data include both products and services, with services claiming more than half of revenues. Revenues in North America totaled $26.4 billion in 2019, nearly half of worldwide revenues. Increasing patient preference for online healthcare consultation due to its cost-effectiveness, reduced wait times, and easy access coupled with a growing number of insurance companies reimbursing health care providers for this service will contribute to significant growth in this region of the world. However, not everyone prefers telehealth visits. In a University of Michigan study of older adults, while an overwhelming majority were comfortable with videoconferencing and were interested in using telemedicine for follow-ups with their doctor, 64% of those that actually used telehealth services felt that the health care quality was not as good as an in-person visit (4 out of 5 people were concerned because the doctor couldn’t physically examine them).

In rural areas around the world where healthcare services are lacking, telemedicine is a way to bring these services to those who need them. Government initiatives and investment to improve health care in rural areas will fuel growth worldwide in the coming years. But hampering growth is the lack of infrastructure in many developing counties. Deploying telehealth technology requires the latest telecommunications technology and high-speed internet with high bandwidth and storage capacity. Hundreds of millions of people around the world still lack internet access, especially those living in rural, remote areas. In India, the country with the second-highest number of internet users also has the highest number of people without internet access, more than 685 million. More than 582 million people in China lack internet access. By region, Africa and the Asia-Pacific region have the lowest percentage of internet users, 28.2% and 48.4%, respectively.

The telemedicine segment had the highest revenues in 2019 and is expected to continue to dominate the market through 2027 as more doctors integrate telemedicine into their everyday practices, purchasing telemedicine software and virtual conference apps to do so. Established companies and a growing number of startups are bringing more telehealth software and remote monitoring devices to market as they expand their scope into solutions for various specialties such as mental health, dermatology, and cardiology, to name a few.

The continuous monitoring segment is expected to see significant growth over this time period due to an aging population, advancements in the integration of medical data, and increased availability of wearable remote monitoring devices. According to the American Telemedicine Association, one million people in the United States use remote cardiac monitors. But, not all monitors need to be applied in a medical setting. The newer versions of several smartwatches by Apple, Samsung, Fitbit, Withings, and Amazfit have the ability to take an electrocardiograph (ECG) to detect atrial fibrillation and abnormal heart rhythms. Some smartwatches also have the ability to monitor blood oxygen levels.3 While ECGs taken using a smartwatch may not be as accurate or be able to detect as many problems as ECGs done in a hospital, “irregularities in heart rate can be episodic, and difficult to capture…so a personal ECG that you carry with you can help clinicians record when palpitations happen and help with diagnosis,” according to Dr. Keith Grimes, Medical Director and pioneer in clinical VR and artificial intelligence at Babylon Health in London, U.K.

Teledoc Health Inc. is the leading company in the telehealth market owing to its large customer base and an increasing number of paid memberships and virtual doctor visits. Its virtual doctor visits between January 2020 and March 2020 increased 60% from the fourth quarter of 2019. In January 2020 it acquired InTouch Health, which gave it access to a network of more than 450 hospitals and healthcare facilities. It also acquired InTouch Health’s Solo, an end-to-end fully integrated virtual care platform. Other major telehealth companies include American Well, MDLIVE Inc., Doctor on Demand Inc., Dictum Health Inc., Grand Rounds Inc., and OpenTeleHealth. Except for OpenTeleHealth which is headquartered in Denmark, all the other companies are located in the United States.

1 Medicare is the federal health insurance program for people age 65 or older in the United States. People younger than age 65 with certain disabilities, permanent kidney failure, or amyotrophic lateral sclerosis (Lou Gehrig’s disease), can also qualify for Medicare. Those that qualify for Medicare are generally at high risk for complications from COVID-19. Data are for those that have Fee-for-service Medicare.
2 Before the PHE, covered telehealth services were limited for Medicare beneficiaries. Passage of the Coronavirus Aid, Relief, and Economic Security (CARES) Act on March 27, 2020, expanded the list of telehealth-eligible services, allowing for audio-only communications as well as expanding the types of practitioners eligible to provide telehealth services. Due to a waiver, as of March 6, 2020, telehealth services were allowed to be delivered wherever a patient is located, including in their home or a temporary health facility. Before, a patient needed to go to a health care facility to receive telehealth services from a distant practitioner. These visits were generally reserved for rural residents.
3 Apple and Samsung smartwatches have U.S. Food and Drug Administration approval for detecting atrial fibrillation. Approval is pending for Fitbit.

Sources:“Telehealth Market to Exhibit 25.2% CAGR till 2027; Rising Video & Audio Consultation with Physicians to Boost Growth,” Fortune Business Insights Press Release, July 29, 2020 available online here; “Telehealth Market Size, Share & COVID-19 Impact Analysis, by Type (Products and Services), by Application (Telemedicine, Patient Monitoring, Continuous Medical Education, and Others), by Modality (Real-time (Synchronous), Store-and-forward (Asynchronous), and Remote Patient Monitoring), by End User (Hospital Facilities, Homecare, and Others), and Regional Forecast, 2020-2027,” Fortune Business Insights Summary, July 2020 available online here; “What’s the Difference Between Telemedicine, Telecare and Telehealth?” eVisit available online here; “HHS Issues New Report Highlighting Dramatic Trends in Medicare Beneficiary Telehealth Utilization amid COVID-19,” U.S. Department of Health and Human Services Press Release, July 28, 2020 available online here; “Thriving in the Post-COVID-19 World—Key Areas of Focus,” IQVIA Consumer Health available online here; “Medicare,” Social Security Administration, November 2019 available online here; “Medicare Beneficiary Use of Telehealth Visits: Early Data from the Start of the COVID-19 Pandemic,” Issue Brief, Assistant Secretary for Planning and Evaluation, U.S. Department of Health and Human Services, July 28, 2020 available online here; “List of Countries by Number of Internet Users,” Wikipedia, September 30, 2020 available online here; Carmen Ang, “These are the Countries Where Internet Access is Lowest,” World Economic Forum, August 17, 2020 available online here; Michael Sawh, “ECG Wearables: How They Work and the Best on the Market,” Wareable, August 28, 2020 available online here; Thomas S. Nesbitt, “The Role of Telehealth in an Evolving Health Care Environment: Workshop Summary,” Board on Health Care Services, Institute of Medicine, November 20, 2012 available online here.
Image source: National Cancer Institute, “Doctor Holding Cell Phone,” Unsplash, December 11, 2019 available online here.

CBD Pet Products

Dog being given a CBD pet product - CBD oil
A dog being given CBD oil. CBD oil is usually given to pets to relieve joint pain. Increasingly it is given to treat anxiety and stress-related disorders. Joint pain can be a consequence of obesity. October 14, 2020, is National Pet Obesity Awareness Day. Click the picture to be taken to the Association for Pet Obesity Prevention website for more information.
Geographic reference: World
Year: 2019 and 2027
Market size: $27.7 million and $399.2 million, respectively

Today’s market size shows the global revenues for CBD-infused pet products in 2019 and projected for 2027.1 The CBD pet product market is a minuscule segment in the overall $4.6 billion CBD product market,2 however, the compound annual growth rate (CAGR) is expected to be nearly double that of the overall market, 40.3% vs. 22.2% in the near future.3 Growth in this industry is unsurprising. According to a Gallup poll, 64% of people in the United States alone are familiar with CBD and/or CBD products. In 2019, Consumer Reports announced that 64 million Americans had tried CBD products between 2017 and 2019, with 22% saying it helped them supplement or replace over-the-counter or prescription drugs. Twenty-four percent of pet owners consume CBD products either for themselves or for their pets.

As more CBD products become available, more people are expected to try these products. And, for those that are helped by them, they may be more inclined to try CBD products on their pets. Even those that have not tried CBD themselves, but have heard the health claims, may consider it for their pets’ health, especially those looking for natural and organic remedies.

CBD is legal in most countries around the world, however, some countries where it’s legal impose regulations about who can grow, produce, or purchase it. In the United States, President Donald Trump signed the Agriculture Improvement Act of 2018, commonly called the Farm Bill. This bill made hemp and hemp products legal by modifying the Controlled Substance Act to exclude hemp from the definition of marijuana and excludes the THC in hemp from being classified as a Schedule I controlled substance, as long as the THC content does not exceed 0.3 percent.

The U.S. Food and Drug Administration (FDA) has the authority to regulate cannabis and cannabis-derived compounds, including hemp-derived CBD under the Federal Food, Drug, and Cosmetics Act. Marketing CBD products promoting use in the “diagnosis, cure, mitigation, treatment or prevention of diseases” without first getting FDA approval and selling unapproved products with unsubstantiated health claims violate this Act.4 To date, only one CBD product has been approved by the FDA, a prescription drug used to treat two rare forms of epilepsy in humans.

In 2019, there were more than 4 dozen types of products containing CBD on the market, with three — oil/tincture, treats/chews, and topicals — geared toward pets. The pet food-grade segment of the market accounted for the largest market share, more than 60%, as pet parents spend more on products for their pets’ health. The therapeutic grade segment of the market is expected to see significant growth through 2027 as CBD oils become increasingly popular to treat inflammation and pain. According to the Association for Pet Obesity Prevention, about 56% of dogs and 60% of cats in the United States are overweight or obese.4 As with humans, obesity in pets can lead to joint pain. As pets age, joint pain from arthritis becomes a concern. The American Pet Products Association reports that 25% of dogs in the U.S. suffer from arthritis. In 2019, the treatment of joint pain disorders claimed a 23.6% revenue share with CBD oil driving this segment of the market. Revenues from CBD products used to treat anxiety and stress-related disorders in pets is expected to grow the fastest through 2027. In a survey conducted by the cannabis market research firm Brightfield Group, more than 60% of human CBD users have taken it for anxiety.

The easy online availability of CBD products without a prescription led to a more than 40% share for the e-commerce segment in 2019. Discounted prices and increasing use of smartphones and the internet in developing countries are expected to contribute to e-commerce growth. Pet specialty stores held the second-highest revenue share. North America accounted for more than 35% of global revenues. The passage of the Farm Bill as well as several major manufacturers located in the region contribute to growth there. In addition, according to a survey conducted by the American Pet Products Association, 34% of cat owners and 39% of dog owners prefer CBD-infused pet products. Europe also held a significant market share in 2019 as CBD is legal in most countries in the region, and both the pet population and people’s expenditures on their pets have been increasing. The Asia-Pacific region is expected to experience significant growth through 2027 due to a growing pet population, higher disposable income, and an unregulated market.

Leading companies include Honest Paws, Canna-Pet, Fomo Bones, Pet Relief, HolistaPet, Joy Organics, Wet Noses, CBD Living, Pet stock, Petco, and Charlotte’s Web. While CBD pet products exist in legal limbo in the United States, products from Honest Paws and Charlotte’s Web have earned the National Animal Supplement Council (NASC) Quality Seal. NASC is an independent agency that performs facility audits on companies that manufacture veterinary supplements. To obtain permission to display the Quality Seal on their products, companies must pass an independent facility audit every two years and demonstrate ongoing compliance with a set of guidelines, two of which include: “having an adverse event reporting/complaint system in place to monitor and evaluate products in real time” and “submitting to random product testing by an independent lab to ensure ingredients meet label claim.”6

To capitalize on the growing popularity of CBD pet products large companies such as Nestlé, Mars Inc., and General Mills plan to enter the market in the near future either with new product launches, by acquiring companies that currently manufacture CBD products, or with collaboration. In February 2019, Martha Stewart collaborated with Canopy Growth Corp., a Canadian cannabis research, product development, and production company, to develop a line of CBD infused animal health products.

1 CBD stands for cannabidiol, the nonpsycoactive ingredient in hemp and marijuana. THC stands for tetrahyrocannabinols. It’s the psychoactive ingredient in these plants.
2 Data for 2018.
3 Revenue for CBD pet products is expected to grow at a compound annual growth rate (CAGR) of 40.3% from 2020 to 2027. Revenue for CBD products overall is expected to grow at a CAGR of 22.2% from 2019 to 2025.
4 Source: Harold B. Hilborn, “2018 Farm Bill Legalizes Hemp, but Obstacles to Sale of CBD Products Remain,” The National Law Review, March 5, 2019 available online here.
5 October 14, 2020 is National Pet Obesity Awareness Day
6 Source: “The NASC Quality Seal,” National Animal Supplement Council available online here.

Sources: “CBD Pet Market Size, Share & Trends Analysis Report by Product (Therapeutic Grade, Food Grade), by Application (Joint Pain, Anxiety), by End-use, by Region (North America, Europe, APAC, Latin America, MEA), and Segment Forecasts, 2020 – 2027,” Grand View Research Report Summary, August 2020 available online here; “CBD Pet Market Size Worth $399.2 Million by 2027 | CAGR: 40.3%: Grand View Research, Inc.,” CISION PR Newswire, September 16, 2020 available online here; “Cannabidiol Market Size, Share & Trends Analysis Report by Source Type (Hemp, Marijuana), by Distribution Channel (B2B, B2C), by End Use, by Region, and Segment Forecasts, 2019 – 2025,” Grand View Research Report Summary, December 2019 available online here; Harold B. Hilborn, “2018 Farm Bill Legalizes Hemp, but Obstacles to Sale of CBD Products Remain,” The National Law Review, March 5, 2019 available online here; Dawn MacKeen, “What are the Benefits of CBD?” The New York Times, October 16, 2019 available online here; “The NASC Quality Seal,” National Animal Supplement Council available online here; “CBD Products are Everywhere But Do They Work?” Harvard Women’s Health Watch, August 2019 available online here; “CBD Statistics 2020,” The Checkup, May 13, 2020 available online here; “52 CBD Products on the Market in 2019,” Ministry of Hemp, September 30, 2019 available online here.
Image source: RR_Medicinals, “dog-husky-cbd-oil-cbd-hemp-oil-4432830,” Pixabay, August 27, 2019 available online here.

Pharmaceutical Packaging

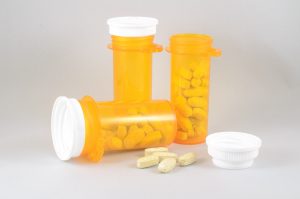
bottles, pharmaceutical packaging
Plastic bottles had the highest revenue share in the primary packaging segment of the market.
Geographic reference: World
Year: 2019 and 2027
Market size: $98.58 billion and $188.79 billion, respectively

Today’s market size shows the total global revenues for pharmaceutical packaging in 2019 and projected for 2027 according to a report by Grand View Research. Demand for pharmaceutical packaging is expected to rise based on many factors: a growing pharmaceutical industry in China, India, and Brazil; rising demand for over-the-counter drugs; new drug discoveries; increased access to medicines as healthcare infrastructure improves in developing countries; an aging population; and a rise in the number of people with chronic diseases. 

Growth is also expected as demand rises for more convenient packaging types, such as pre-filled syringes and autoinjectors, and for sustainable packaging made of biodegradable and recycled materials. The growing use of biologics to treat illnesses will increase demand for specialized packaging. Biologics are manufactured using animal, human, or plant cells which tend to be heat sensitive and prone to contamination.

Increasing regulations and anti-counterfeit measures such as the Drug Supply Chain Security Act in the United States and the European Union’s Falsified Medicine Derivative have increased packaging costs as new infrastructure has to be developed to meet the requirements outlined in the laws.1 As costs go up, more pharmaceutical companies are outsourcing their packaging needs. Pharmaceutical contract packaging revenues totaled $28.2 billion in 2019 or 28.6% of the overall global pharmaceutical packaging market. This is expected to increase to $47.7 billion in 2027. Many small pharmaceutical companies without packaging capabilities have maintained relationships with contract packaging organizations and contract development and manufacturing organizations all along.

Primary packaging, the packaging that comes in direct contact with the product itself, held the highest revenue share in 2019, 75.16%, with plastic bottles having the highest share within this category. Oral drug delivery packaging and injectable packaging together accounted for more than three-quarters of all pharmaceutical packaging revenue. By end-use, most revenues came from pharmaceutical manufacturers, then retail pharmacies, contract packaging, institutional pharmacies, and others.

North America had the highest revenue share in 2019, 37.8%. The United States is the largest pharmaceutical market worldwide. It has a large healthcare system, the population has high per capita income, and it invests heavily in new drug development. Also, many large pharmaceutical companies such as Pfizer Inc., Johnson & Johnson, Merck & Co. Inc., Bristol-Myers Squibb Company, and AbbVie Inc. are located there. The Asia-Pacific region is expected to see the highest compound annual growth rate through 2027 with China, India, Japan, and South Korea being the largest markets. Economic growth along with population growth and increasing drug safety regulations are expected to increase product demand. While the global market is fragmented with several regional and local pharmaceutical packaging companies, some major companies in this industry include Amcor PLC; Gerresheimer AG; AptarGroup Inc.; Becton, Dickinson and Company; Schott AG; West Pharmaceutical Services Inc., Berry Global Inc.; WestRock Company; International Paper Company; Comar LLC; CCL Industries Inc.; and Vetter Pharma International.

1 Some product tracing and product identification regulations under the Drug Supply Chain Security Act were waived for certain COVID-19 medications. Source: “FDA Lifts Drug Supply Chain Security Requirements for COVID-19 Products,” Regulatory Focus, Regulatory Affairs Professionals Society, April 30, 2020 available online here.

Sources: “Pharmaceutical Packaging Market Size, Share & Trends Analysis Report by Material (Plastics & Polymers, Paper & Paperboard, Glass), by Product, by End Use, and Segment Forecasts, 2020 – 2027,” Grand View Research Report Summary, February 2020 available online here; “Pharmaceutical Packaging Market Size Worth $188.79 Billion by 2027: Grand View Research, Inc.,” CISION PR Newswire, February 11, 2020 available online here; “Pharmaceutical Contract Packaging Market Size, Share & Trends Analysis Report by Type (Primary, Secondary, Tertiary), by Material (Plastic & Polymer, Glass), by Region, and Segment Forecasts, 2020 – 2027,” Grand View Research Report Summary, August 2020 available online here; “Pharmaceutical Contract Packaging Market Size Worth $47.7 Billion by 2027: Grand View Research, Inc.,” CISION PR Newswire, August 26, 2020 available online here; “Pharmaceutical Packaging Market to Hit USD 142.59 Bn by 2027; Rising Demand for Efficient Packaging of Drugs by Healthcare Facilities to Boost Market Growth: Fortune Business Insights,” CISION PR Newswire, June 2020 available online here; “Pharmaceutical Packaging Market Size, Share & Industry Analysis, by Material (Plastics, Glass, Metal, Paper & Paperboard), by Product (Plastic Bottles, Caps & Closures, Pre-Fillable Inhalers, Vials & Ampoules), by Packaging Type (Primary, Secondary, and Tertiary), by Drug Delivery Mode (Oral Drug Delivery Packaging, Injectable Packaging, Topical Drug Delivery Packaging, Pulmonary Drug Delivery Packaging), and Regional Forecast, 2020-2027,” Fortune Business Insights Report Summary, June 2020 available online here; “Drug Supply Chain Security Act (DSCSA),” U.S. Food and Drug Administration, May 8, 2020 available online here; “Falsified Medicines,” Medicinal Products, European Commission, June 30, 2017 available online here; Michael Mezher, “FDA Lifts Drug Supply Chain Security Requirements for COVID-19 Products,” Regulatory Focus, Regulatory Affairs Professionals Society, April 30, 2020 available online here.
Image source: Bob Williams, “medicine-bottle-medical-health-2520463,” Pixabay, July 19, 2017 available online here.

Clinical Trials

clinical trial laboratory
Geographic reference: World
Year: 2019 and 2027
Market size: $46.8 billion and $69.8 billion, respectively

Clinical trials are carefully designed studies that test the benefits and risks of new medical treatments and devices. Each clinical trial is led by a principal investigator, usually a doctor, along with a team of nurses and researchers. In the United States, once scientists have completed laboratory research and pre-clinical testing and achieved a successful result—work that can involve years of experiments on animal and human cells—the pharmaceutical or device company submits its data to the Food and Drug Administration (FDA) for approval to begin testing on human volunteers.

Before an investigational medication1 can be sold to the public, it must successfully pass through 3 clinical trial phases. Phase I trials last several months and involve small numbers of volunteers, 20 to 100. This study determines the effects of the drug on humans and the side effects as dosages are increased. About 70% of experimental drugs pass this phase of clinical trials.

Phase II trials typically last several months to two years. They test the efficacy of a drug. Several hundred volunteers participate in randomized trials where one group receives the experimental drug and another either receives a standard treatment or a placebo. Often neither the patient nor the researchers know who is receiving the experimental drug. This allows investigators to compare information about relative safety and effectiveness. About 33% of experimental drugs pass these first two phases.

Phase III trials are also randomized, blind studies but involve several hundred to several thousand patients. This stage can last several years and provides the pharmaceutical company and the FDA a more complete picture of the drug’s effectiveness, benefits, and adverse reactions. Between 70% and 90% of drugs that enter Phase III successfully complete this level of testing. Phase III trials garnered a 53% revenue share in 2019, followed by Phase II with a 19.8% share. Phase III trials are the most expensive because they involve a large number of patients and a long treatment period.

After a successful Phase III completion, the pharmaceutical company can request FDA approval to market the product. According to PhRMA, less than 12% of drugs that enter Phase I trials go on to be approved by the FDA. Over the past decade, the average research and development cost to bring a new FDA-approved medication to market was $2.6 billion, the development process taking an average of 10-15 years.

With COVID-19 affecting the lives and livelihoods of millions of people around the world and causing hundreds of thousands of deaths, currently more than 150,000 in the United States alone, President Donald Trump announced Operation Warp Speed on May 15, 2020. This is a public-private initiative to “accelerate the development, manufacturing, and distribution of COVID-19 vaccines, therapeutics, and diagnostics.” One of its goals is to “have substantial quantities of a safe and effective vaccine available for Americans by January 2021,” a mere 7 months in the future, although researchers had been working on a vaccine since January 2020. As of July 30, 2020, there were 42 potential vaccines in various stages of development around the world according to the Regulatory Affairs Professionals Society COVID-19 Vaccine Tracker.2 Earlier in 2020, the World Health Organization announced an international clinical trial launch, called Solidarity, to find effective treatments for this virus. In May 2020, as a part of Solidarity, it announced an international alliance for simultaneously developing a number of vaccines for COVID-19. In addition, regulatory agencies across the globe issued guidelines related to conducting clinical trials during the COVID-19 pandemic, restricting face-to-face interactions and supporting the incorporation of virtual services, including performing decentralized clinical trials in which many trial functions are done remotely and researchers rely on help from the patients, their family members, and other caregivers instead of healthcare professionals.

Today’s market size shows the revenues for clinical trials worldwide in 2019 and projected for 2027. Funding for clinical trials comes from government agencies such as the National Institutes of Health and the Department of Defense in the United States, pharmaceutical and biotechnology companies, medical institutes, and foundations. Predicted revenue growth during this time period will be due to many factors: the increasing prevalence of chronic diseases, the rising number of biologics, the need for personalized medicines and orphan drugs, as well as increasing demand for clinical trials in developing countries. The globalization of clinical trials, increased use of technology to meet stringent regulations, and increased use of contract research organizations by pharmaceutical companies to organize and conduct clinical trials are additional factors contributing to future growth. In 2019, oncology clinical trials accounted for the largest share of revenue, 23.2%, followed by trials for drugs to treat central nervous system conditions, autoimmune diseases/inflammation, and diabetes. As of August 4, 2020, there were more than 347,000 studies registered at ClinicalTrials.gov, located in all 50 states and 216 countries. Recruiting studies totaled 52,249.

The coronavirus pandemic has disrupted clinical trials for a variety of disease treatments. The number of patients enrolled in clinical trials in March 2020 dropped 65% worldwide from a year earlier. Some studies have halted altogether as medical center resources are diverted to treating patients with COVID-19 and biotechnology firms divert resources to develop therapeutics and vaccines to treat and prevent the spread of the virus.

As of May 2020, interventional design studies accounted for 79% of all registered studies, the majority being for drugs and biologics. Expanded access trials, also known as compassionate use trials, are predicted to grow at the fastest rate, a compound annual growth rate (CAGR) of 5.2%, through 2027. These trials are a way for patients with serious diseases to obtain treatment outside of clinical trials when other treatments prove ineffectual. For example, many oncology drugs considered as a part of expanded access trials are administered to patients before getting FDA approval. As of May 2020, there were 20 therapeutics for COVID-19 in Phase II and Phase III expanded access trials.

North America accounted for 51.2% of the market in 2019 and is expected to maintain its majority share due to increasing research and development and adoption of new technologies. The Asia-Pacific region is expected to grow the fastest, at a CAGR of 6.1%. A growing number of biotechnology firms are seeking to recruit patients for their COVID-19 trials in this region due to its large patient pool and fast-track trial procedures.

Some major companies in the clinical trial market include ICON Plc, Wuxi AppTec, PRA Health Sciences, SGS SA, Syneos Health, Eli Lilly and Company, Novo Nordisk A/S, Pfizer, Clinipace, IQVIA, PAREXEL International Corp., Pharmaceutical Product Development LLC, and Charles River Laboratory.

1 We concentrate on investigational medications in the text, but the market size figures include revenue for all types of clinical trials: drug, biologic, behavioral, clinical procedure, and device studies.
2 According to a June 16, 2020 U.S. Department of Health & Human Services press release, there are more than 100 COVID-19 vaccines in development.

Sources: “Clinical Trials Market Size, Share & Trends Analysis Report by Phase (Phase I, Phase II, Phase III, Phase IV), by Study Design (Interventional, Observational, Expanded Access), by Indication, and Segment Forecasts, 2020 – 2027,” Grand View Research Report Summary, May 2020 available online here; “Clinical Trials Market Size Worth $69.8 Billion by 2027 | CAGR: 5.1%: Grand View Research, Inc.,” CISION PR Newswire, February 18, 2020 available online here; “What is Clinical Research?” WCG CenterWatch available online here; “Clinical Trials,” PhRMA available online here; “Trends, Charts, and Maps,” ClinicalTrials.gov, National Institutes of Health, U.S. National Library of Medicine, August 4, 2020 available online here; “The Impact of Industry Sponsored Clinical Trials,” PhRMA available online here; Jeff Craven, “COVID-19 Vaccine Tracker,” Regulatory Focus, Regulatory Affairs Professionals Society, July 30, 2020 available online here; “Trump Administration Announces Framework and Leadership for ‘Operation Warp Speed,'” U.S. Department of Health & Human Services Press Release, May 15, 2020 available online here; “Fact Sheet: Explaining Operation Warp Speed,” U.S. Department of Health & Human Services Press Release, June 16, 2020 available online here; Bryan Hill, Pratik Maroo, Venu Mallarapu, and Vidya Viswanathan, “Reinventing Clinical Trials for a Stay-at-Home World,” Perspectives, June 22, 2020 available online here; Ben Fidler, “A Guide to Clinical Trials Disrupted by the Coronavirus Pandemic,” BioPharma Dive, May 15, 2020 available online here.
Image source: Belova59, “laboratory-medical-medicine-hand-3827745,” Pixabay, November 15, 2018 available online here.

Enzymes

enzymes in laundry detergent
Laundry detergent. Enzymes in laundry detergent allow clothes to be washed in cold water.
Geographic reference: World
Year: 2019 and 2027
Market size: $9.9 billion and $17.2 billion, respectively
Sources: “Enzymes Market Size, Share & Trends Analysis Report by Application (Industrial Enzymes, Specialty Enzymes), by Product (Carbohydrase, Proteases, Lipases), by Source, by Region, and Segment Forecasts, 2020 – 2027,” Grand View Research Report Summary, March 2020 available online here; “Enzymes Market Size Worth $17.2 Billion by 2027 | CAGR 7.1%: Grand View Research, Inc.,” CISION PR Newswire, March 16, 2020 available online here; Sindhu Raveendran, et. al., “Applications of Microbial Enzymes in Food Industry,” Food Technology & Biotechnology, March 2018 available online at the U.S. National Library of Medicine, National Institutes of Health here; JanMaarten van Dijl and Michael Hecker, “Bacillus Subtilis: From Soil Bacterium to Super-secreting Cell Factory,” Microbial Cell Factories, January 14, 2013 available online here; “A Global Fermentation Approach,” Leaf by Lesaffre available online here; “Specialty Enzymes Market Worth $6.6 Billion by 2025,” MarketsandMarkets Press Release, April 20, 2020 available online here.
Image source: habelfrank, “washing-powder-detergent-1500058,” PIxabay, July 7, 2016 available online here.

Enzymes are proteins that act as catalysts. Enzymes in the body run cellular processes and convert food to energy and to building blocks for proteins, lipids, nucleic acids, and some carbohydrates. Industrial enzymes such as proteases, amylases, lipases, and others are used in various applications: in the food and beverage industry, in detergents, animal feed, biofuels, textiles, pulp and paper, nutraceuticals, personal care products and cosmetics, wastewater treatment, and medications. In 2018, 60% of industrial enzymes on the market were proteases. In Europe, 900 tons of protease enzymes are used for detergents alone every year.

Today’s market size shows the global enzyme revenues for 2019 and projected for 2027. Microorganism-based enzymes comprised the vast majority of the industrial enzyme market in 2019, about 85%, followed by animal-based and plant-based enzymes. Microorganisms are preferred as a source due to their more predictable and controllable enzyme content. This type of enzyme can also be produced in a cost-effective manner with less space and time necessary than animal-based or plant-based enzymes. There are three types of microorganism-based enzymes: bacterial, fungal, and yeast. Bacterial enzymes are mostly sourced from Bacillus. They’re used in food and detergent and in pharmaceutical applications to diagnose diseases, promote wound healing, and kill disease-causing microorganisms. Fungal enzymes are used in the preparation and production of soy sauce, beer, baked goods, processed fruits, and dairy products. Yeast is used in beer, baked goods, and industrial ethanol production.

Increased investment in biotechnology research for the development of specialty enzymes for medicinal and diagnostic purposes is one of the main factors driving product demand globally. Increasing demand from the food and beverage, biofuel, animal feed, and home cleaning sectors along with the growing consumption of functional foods will contribute to the growth in the market through 2027. By region, growing biofuel production in North America and Europe, as well as increasing meat production in Europe and the Russian Federation, are expected to contribute to growth in these regions. Enzymes are used extensively in meat processing to improve the tenderness of the meat. Europe was third behind China and North America in meat production in 2018. The top three companies in this industry—Novozymes, DuPont Danisco, and DSM— claimed more than 75% of the market in 2019.1 Other major companies in this industry include BASF SE, Associated British Foods PLC, Chr. Hansen Holding A/S, and Advanced Enzyme Technologies.

1 Source: Grand View Research. The press release from CISION PR Newswire mentioning the same Grand View Research report states that the top 3 companies are Novozymes, DuPont Danisco, and BASF SE.

Floatation Centers

floatation centers, still water

Floatation centers are alternative health and wellness businesses that have one or more float tanks for their clients’ use. Float tanks are tanks filled with skin-temperature warm water mixed with enough Epsom salt to allow a person’s body to float. The temperature of the water makes it imperceptible to the person floating in the tank. The tank is sound-proof and pitch-black blocking out any outside stimuli. These tanks are sometimes called sensory deprivation tanks or isolation tanks.

In the 1950s, interest in the brain’s reaction to sensory deprivation began among neuroscientists. Some scientists believed that the brain would shut down into a coma-like state. Others believed that the brain would still remain active, just looking inward for stimulation. Neuroscientist John C. Lilly built the first float tank in 1954 at the National Institute of Mental Health Laboratory in the Virgin Islands; however, unlike modern floatation tank clients, the subjects of Lilly’s experiments were submerged underwater and needed to wear divers helmets with tubes to breathe. The results of the experiments proved that the brain does not go into a comatose state when deprived of stimuli. Subjects reported feeling energized and motivated to fulfill their highest life potential afterward. This led Lilly to build more float tanks in research centers in the United States.

In the early 1970s, Lilly partnered with Glenn and Lee Perry to develop a commercially available float tank that people could have in their homes. In 1979, the first floatation center opened in Beverly Hills, California with 5 of these tanks. The business was a success and floatation centers opened across the United States. Business boomed in the early 1980s. Now called Restricted Environmental Stimulation Therapy (REST), research continued although some scientists found it difficult to get funding. Lilly’s reputation for being eccentric and the 1980 cult-classic movie Altered States, inspired by Lilly’s life, led some to believe that floatation tank research was “a hippie fad.” By the mid-1980s, AIDS was taking a toll on the population and on floatation center businesses. Most went out of business. Then in the 2000s and especially the 2010s, floatation centers saw a resurgence in popularity as alternative health and wellness practices became more available and acceptable.

According to some studies, after float sessions, patients experience lower levels of stress-related hormones.1 Lower blood pressure and improvements in mood, pain, and muscle tension have also been reported. In some cases, effects last for several months. Floating has been shown to lessen stress-related pain, anxiety, and depression. Patients suffering from various conditions such as addiction, arthritis, fibromyalgia, and post-traumatic stress disorder may also be helped by floating.

Today’s market size shows the number of floatation centers in the United States in 2011 and 2019. California had the highest number of floatation centers in 2019, 70, followed by New York and Florida (tied with 29 each), Texas (20), Pennsylvania (18), and Illinois (17). In a majority of cases, floatation centers offer other services such as massage, infrared saunas, reiki, yoga, meditation, sound and light therapy, counseling services, and acupuncture. Despite this, according to a survey conducted by Float Tank Solutions, more than three-quarters of these businesses earn most of their income from floating. In 2019, the average annual revenue from a float tank totaled $41,939.

1 Float sessions last a minimum of 30 minutes at floatation centers.

Geographic reference: United States
Year: 2011 and 2019
Market size: 85 and 462, respectively
Sources: Mandy Oaklander, “Float Hopes, Moods Lift,” Time Special Edition: Mental Health a New Understanding Reissue, 2019, pp. 50-53; “Sensory Deprivation Tank Locations by Region,” Floatation Locations available online here; 2019 State of the Float Industry, Float Tank Solutions available online here; “Float HIstory,” True REST: The Science of Feeling Great available online here.
Image source: Dimhou, “sea-water-ocean-quiet-horizon-3652697,” Pixabay, September 5, 2018 available online here.

Digestive Health Supplements

Digestive health supplements

Soft drinks, potato chips, candy, fast food. Tasty, yes. But also high in fat, added sugar and salt. Some researchers believe that a diet high in these types of food, along with a diet of highly processed foods, can be a factor in the development of digestive disorders. Other top factors include smoking, pollution, and genetics.

As consumers become aware that gut health contributes to overall health, demand for digestive health supplements is predicted to increase. Probiotics, prebiotics, enzymes, and fulvic acid are some types of digestive health supplements. Probiotics, prebiotics, and enzymes can also be found in some types of food, food which also contains many beneficial nutrients.

Probiotics are live bacteria and yeasts that are beneficial for the digestive system. They are found in foods such as yogurt,1 kefir, unpasteurized sauerkraut, and kimchi. Probiotic supplements are used to treat antibiotic-associated diarrhea in adults and infectious diarrhea in infants and children. They are also given to people with Crohn’s disease, ulcerative colitis, and irritable bowel syndrome to help them maintain remission of their disease. Supplements contain various strains of probiotics, depending on the brand. Some popular brands of over-the-counter probiotic supplements that have been tested for use with gastrointestinal disorders include Align (Bifidobacterium infantis 35624), Culturelle (L. rhamnosus GG), and Florastor (Saccharomyces Boulardii).2 

Prebiotics are a type of plant-based fiber that the human body cannot digest. Prebiotics provide food for probiotics; together they maintain a healthy colony of bacteria and microorganisms in a person’s gastrointestinal tract. Prebiotics can be found in fruits, vegetables, and whole grains. Apples, garlic, onions, asparagus, barley, and oats are some foods that contain prebiotics. Most people get enough prebiotics in their diet if they eat a variety of fruits, vegetables, whole grains, and fermented foods, but for those that don’t, prebiotic supplements may be beneficial. Some popular brands of prebiotic supplements include Benefiber, Metamucil, and Fiber Choice.

Digestive enzymes break down food so that a person can absorb its nutrients. A majority of digestive enzymes are manufactured in the pancreas. Lipase breaks down fats. Amylase breaks down carbohydrates. Proteases and peptidases break down proteins. Doctors prescribe digestive enzyme supplements to people with cystic fibrosis, chronic pancreatitis, and pancreatic cancer. These conditions cause a person’s digestive enzyme levels to be low. Over-the-counter digestive enzyme supplements include lactase supplements to break down lactose, the sugar in dairy products, and alpha-galactosidase supplements, to break down the complex carbohydrates in foods such as beans, broccoli, cabbage, and cauliflower. Lactaid and Beano are two popular brands of these types of digestive enzymes, respectively.

Fulvic acid has been used in traditional Indian medicine for 3,000 years. Shilajit, a tar-like substance found in the Himalayas, Caucasus mountains, Altai Mountains and the mountains of Gilgit Baltistan, is created from the decomposition of plants. It contains soil-based organisms and is composed of 15-20% fulvic acid. Some believe that ingesting fulvic acid supplements such as shilajit can improve a person’s gut flora to treat such conditions as small intestinal bacterial overgrowth, irritable bowel syndrome, leaky gut, chronic constipation, and diarrhea. It’s believed that poor gut health caused by oxidative stress leads to chronic inflammatory diseases. As an antioxidant, fulvic acid is thought to counteract the oxidative stress.

Today’s market size shows the total global revenue for digestive health supplements in 2018 and projected for 2025. In Japan, the incidence of ulcerative colitis alone increased from 8 cases per 100,000 people in 1985 to 64 cases per 100,000 in 2005. In the United States, 60-70 million people are afflicted with digestive diseases according to the National Institute of Diabetes and Digestive and Kidney Diseases. The growing prevalence of digestive disorders in Japan, the United States, and several European countries has contributed to the increased demand for digestive health supplements. This is projected to continue through 2025. In the United States, probiotics constitute an overwhelming share of the digestive health supplement market. Currently three-quarters of the supplements sold are in the form of tablets and capsules, however; powdered supplements are expected to gain in popularity in the coming years due to consumer interest in organic ingredients and the convenience of being able to add powdered supplements to the foods they eat. Also, powdered supplements can be absorbed by the body faster. Nearly a third of the supplements sold worldwide in 2018 were manufactured in Italy, Japan, and the United States. Top manufacturers of digestive health supplements include Bayer AG, Amway, Nature’s Bounty Co., and NOW Foods, among others.

1 Manufacturers of some brands of yogurt add additional probiotics to their product. Two such brands are Activia and Danactive.
2 Any mention of brands in this post does not constitute an endorsement. The strain of probiotic in the product is included within the parentheses.

Geographic reference: World
Year: 2018 and 2025
Market size: $8.67 billion and $15.67 billion, respectively
Sources: “Digestive Health Supplements Market Size, Share & Trends Analysis Report by Product (Prebiotics, Probiotics, Enzymes), by Form, by Distribution Channel (OTC, Prescribed), by Region, and Segment Forecasts, 2019 – 2025,” Grand View Research Report Summary, October 2019 available online here; “Digestive Health Supplements Market Size Worth $15.67 Billion by 2025: Grand View Research, Inc.,” CISION PR Newswire, October 23, 2019 available online here; Ames Gross, “Gastrointestinal Diseases Rise in Asia,” MedTech Intelligence, January 22, 2016 available online here; Hrefina Palsdottir, “11 Probiotic Foods That Are Super Healthy,” Healthline, August 28, 2018 available online here; Matthew A. Ciorba, “A Gastroenterologist’s Guide to Probiotics,” Clinical Gastroenterology and Hepatology, U.S. National Library of Medicine, National Institutes of Health, September 2012 available online here; Arlene Semeco, “The 19 Best Prebiotic Foods You Should Eat,” Healthline, June 8, 2016 available online here; “Gut Reaction: A Limited Role for Digestive Enzyme Supplements,” Harvard Health Letter, Harvard Health Publishing, Harvard Medical School, March 2018 available online here; Zawn Villines, “What is the Difference Between Prebiotics and Probiotics?” Medical News Today, October 29, 2018 available online here; Joanne Slavin, “Dietary Fiber: The Prebiotic Connection,” Clinical Advisor, April 20, 2015 available online here; Angela Stringfellow, “The Best Fiber Supplements (2019 Reviews),” Family Living Today, January 9, 2019 available online here; Janet Renee, “About the Enzyme Alpha Galactosidase,” Livestrong.com available online here; “Should You Take Probiotics?” Harvard Health Letter, Harvard Health Publishing, Harvard Medical School, April 2015 available online here; John Winkler and Sanjoy Ghosh, “Therapeutic Potential of Fulvic Acid in Chronic Inflammatory Diseases and Diabetes,” Journal of Diabetes Research, U.S. National Library of Medicine, National Institutes of Health, September 10, 2018 available online here; “Digestive Diseases Statistics for the United States,” National Institute of Diabetes and Digestive and Kidney Diseases, November 2014 available online here; “Shilajit,” Wikipedia, November 6, 2019 available online here.
Image source: Efraimstochter, “dietary-supplements-pills-3512184,” Pixabay, July 3, 2018 available online here.

Gold Nanoparticles

Gold nanoparticles in water

Gold nanoparticles are microscopic particles of gold measuring 1 to 100 nanometers in diameter. Due to their uniformity, conductance and optical properties, they have a variety of uses as sensors and catalysts and for biological imaging. Gold nanoparticles are also used in consumer electronics chip design as conductors and to connect resistors.

Colloidal gold—gold nanoparticles in a solution— has been used in health care since the fourth and fifth centuries B.C. in China, Arabia, and India. In Europe during the Middle Ages, Paracelsus, Swiss philosopher, alchemist, and astrologer, used it to treat mental illnesses and syphilis. Giovanni Andrea, a contemporary of Paracelsus, used colloidal gold to treat his patients’ leprosy, plague, epilepsy, and diarrhea.

In modern times, colloidal gold is used for photodynamic therapy, therapeutic agent delivery, and diagnostics. Photodynamic therapy, used to kill cancer cells, involves injecting a person’s bloodstream with colloidal gold. The gold particles stay in the tumor longer than in other cells. After a certain amount of time, the tumor is exposed to infrared light. The light causes the gold to heat up and kill the surrounding cancer cells.

In therapeutic agent delivery systems, also known as targeted drug therapy, the gold particles are coated with substances to treat a specific medical condition and targeting agents that will bind specifically to the tissue being treated. In some cases, the medication will only be activated by certain conditions in the body, for instance, a specific pH level. In this way, more of the medication gets to the area being treated than it would through traditional means of medication delivery such as oral ingestion or injection into the bloodstream. As a result, outcomes are better and side effects are minimized.

In addition, gold nanoparticles are used to diagnose heart disease, cancer, and infectious diseases by detecting biomarkers. Home pregnancy tests also use gold nanoparticles. The gold nanoparticles are coated with an antibody that detects one component of the hCG hormone, the one present in a woman’s urine when pregnant. When this hormone is present in high concentrations, it combines with the gold and the other hCG component on the test strip and the telltale red color becomes visible.

Today’s market size shows the total global revenues for gold nanoparticles in 2018 and projected for 2027. The health care and electronics sectors generated the most revenue. Use as a catalyst in chemical reactions garnered the third-highest revenue. Within the health care sector, targeted drug therapy and in-vivo imaging topped the end uses in 2018. They are expected to do likewise through 2027. Growth in gold nanoparticle revenue is expected over this time period due to increasing demand for consumer electronics, compact storage devices, and photovoltaic cells as well as growing research and development into improvements in biological imaging and in detecting and treating cancerous tumors. North America is expected to top demand for gold nanoparticles worldwide. Leading manufacturers include Agilent Technologies Inc., Hitachi Ltd., Tanaka Kikinzoku Kogyo K.K., and Danaher Corp.

Geographic reference: World
Year: 2018 and 2027
Market size: $2.52 billion and $10.15 billion, respectively
Sources: “Global Gold Nanoparticles Forecast 2019-2027,” Inkwood Research Report Summary available online here; “Gold Nanoparticles: Properties and Applications,” Millipore Sigma available online here; “Targeted Drug Delivery,” Wikipedia, September 28, 2019 available online here; Esther Inglis-Arkell, “What Do a Pregnancy Test and a Roman Goblet Have in Common?” Gizmodo, November 4, 2014 available online here; “Paracelsus,” Wikipedia, October 2, 2019 available online here; L.A. Dykman and N.G. Khlebtsov, “Gold Nanoparticles in Biology and Medicine: Recent Advances and Prospects,” Acta Naturae, April-June 2011, available online here; Aishwarya Nirmal, “A Color Spectrum Chart with Frequencies and Wavelengths,” Science Struck, January 29, 2018 available online here; “The Global Gold Nanoparticles Market Size is Expected to Reach USD 6.33 Billion by 2025,” Cision PR Newswire Press Release, October 1, 2019 available online here.
Image source: Gold nanoparticles dispersed in water. Different sized particles interact with light in different ways, hence the three colors. Nikonianman, “Au_nanoparticles,” Wikimedia Commons, [CC BY-SA 4.0], January 7, 2012 available online here. No changes were made to the original image.

Smart Inhalers

inhalers

According to the World Health Organization, 235 million people suffer from asthma worldwide.1 Chronic obstructive pulmonary disease (COPD) sufferers number 251 million, with 65 million having a moderate to severe form of this respiratory condition. Globally, deaths caused by these diseases numbered 383,000 and 3.17 million, respectively.

Inhaled medication, administered via an inhaler, is one common treatment. Inhalers have been used since the late 1700s, but the pressurized metered-dose inhalers that patients use today weren’t invented until 1955, by American doctor George Maison. Maison’s invention allowed the prescribed dose of asthma medication to be expelled into the lungs by pushing a button. These inhalers were meant to be an improvement over nebulizers which some patients found difficult to use and as a result failed to get the proper dose of medicine.

Despite metered-dose inhalers being an improvement from earlier methods of medication delivery, studies have shown that patients who use them make at least one mistake while taking their medication in this manner 70-90% of the time, resulting in only 7-40% of the medication reaching their lungs. The two most common mistakes include a delay between inhalation and administering the dose of medication and not breathing deeply enough.

An improvement over these traditional inhalers may be smart inhalers. Smart inhalers have either built-in sensors or clip-on sensors that turn a traditional inhaler into a smart inhaler. The sensors are used to track the medication, dosage and time taken for each dose. Some have monitors for inspiratory flow rate. These sensors link with an app on a smartphone or tablet, with the data saved to the cloud so that doctors and caregivers can access the data. Doctors can monitor whether patients are taking their medication as prescribed and if they are using their inhaler correctly. The app can also provide reminders to patients when they need to take another dose. All of these innovations are meant to help patients get the proper dose of medication on a more consistent basis so that the use of a rescue inhaler is minimized and their quality of life improves. There are also clip-on sensors for rescue inhalers that monitor usage and send notifications when the users leave their inhalers behind. The data gathered can also be used to determine what triggers their asthma attacks.

Today’s market size shows the global revenue for smart inhalers in 2018 and projected for 2026. The North American market generated the highest revenue in 2018 while the Asia-Pacific region is expected to experience the highest growth over this period. Some leading companies in this industry include Propeller Health; Adherium Ltd.; Teva Pharmaceutical Industries Ltd.; AstraZeneca, PLC and GlaxoSmithKline, PLC.

1 According to the Global Asthma Network’s report The Global Asthma Report 2018, 339 million people worldwide suffer from asthma.

Geographic reference: World
Year: 2018 and 2026
Market size: $34 million and $1.4 billion, respectively
Sources: “The Global Smart Inhalers Market Size Was Valued at $34 Million in 2018 and Is Estimated to Reach $1,406 Million by 2026, Growing at a CAGR of 58.4% from 2019 to 2026,” CISION PR Newswire, August 7, 2019 available online here; “Asthma,” World Health Organization, August 31, 2017 available online here; “Chronic Obstructive Pulmonary Disease (COPD),” World Health Organization, December 1, 2017 available online here; “Chronic Respiratory Diseases: Burden of COPD,” World Health Organization available online here; “Inhalers,” Brought to Life: Exploring the History of Medicine available online here; Laura Lovett, “Teva Pharmaceutical’s AirDuo Digihaler Gets FDA Green Light,” MobiHealthNews, July 15, 2019 available online here; Dr. Andreas Alt, “Flow Measurement in Smart Inhalers for Connected Drug Delivery,” Medical Product Outsourcing, March 1, 2019 available online here; The Global Asthma Report 2018, Global Asthma Network, 2018 available online here; “Smart Inhalers,” Asthma UK available online here; “Control Your Asthma with FindAir Smart Inhaler,” FindAir, 2018 available online here.
Image source: Bob Williams, “inhaler-breath-asthma-breathing-2520471,” PIxabay, July 19, 2017 available online here. Picture shows a traditional inhaler, not a smart inhaler.

Irritable Bowel Syndrome Treatments

irritable bowel syndrome treatments

Irritable bowel syndrome (IBS) is a chronic disease that affects the large intestine. People with this disease experience cramping, abdominal pain, bloating, gas and diarrhea or constipation, or alternating bouts of diarrhea and constipation. Unlike inflammatory bowel diseases such as ulcerative colitis or Crohn’s disease, IBS does not cause changes in bowel tissue, and sufferers are not at increased risk of contracting colon cancer.

Currently, a precise cause for this disease is not known, but it may be due to be a faulty interaction between the brain, the nervous system, and the gut. An overactive immune system may also be to blame in those sufferers who have increased numbers of immune-system cells in their intestines or those whose IBS developed after a severe bout of gastroenteritis brought on by a bacterial infection or virus.

Globally, 10-15% of the population has this disease, most under the age of 50. Symptoms of IBS can be triggered by stress and certain foods such as wheat, dairy products, cruciferous vegetables, and carbonated drinks. More women than men have IBS; in the United States, 2 out of 3 patients are women. Many women with this disease report worsening of symptoms around the time of their menstrual periods, indicating that hormonal changes may also be a trigger in some people.

In the United States, 25-45 million people suffer from IBS. Because signs and symptoms can indicate many different conditions, doctors have trouble diagnosing this disease. According to a survey by IFFGD,1 a diagnosis of IBS typically takes more than 6 years after the onset of symptoms. Globally, 40% of patients have mild IBS, 35% a moderate form of the disease, and 25% a severe form. While IBS can affect a person’s emotional, physical, social and financial well-being no matter how mild or severe the symptoms, most patients taking prescription medication for their symptoms have moderate to severe IBS.

Today’s market size shows the worldwide irritable bowel syndrome treatment revenues for 2018 and projected for 2026. Growth in the market is expected over this time period due to a growing prevalence of the disease, especially IBS-C,2 and doctors increasingly prescribing medications to treat it. Several new drugs to treat this disease, currently in clinical trials, are expected to come to market in the coming years. Pharmaceutical companies are also expanding their product offerings in several regions of the world. In January 2019, Ironwood Pharmaceuticals and AstraZeneca received approval to market Linzess, a treatment for IBS-C, in China, enabling them to sell their product to potentially tens of millions of more patients. In addition to Linzess, other leading brand-name treatments include Xifaxan, Viberzi, and Amitiza.3 Linzess/Constella4 generated the largest revenue in 2018. Some major manufacturers of IBS treatments include Ironwood Pharmaceuticals, Inc.; Allergan; Astellas Pharma, Inc.; Takeda Pharmaceutical Co. Ltd. AstraZeneca; and Sebela Pharmaceuticals Inc.

1 International Foundation for Functional Gastrointestinal Disorders
2 Constipation-predominant IBS
3 Xifaxan and Viberzi treat IBS-D, diarrhea-predominant IBS. Amitiza treats IBS-C.
4 Linzess is marketed as Constella in Europe.


Geographic reference: World
Year: 2018 and 2026
Market size: $1.5 billion and $3.4 billion, respectively
Sources: “Irritable Bowel Syndrome Treatment Market Size, Share & Analysis Report by Type (IBS-C, IBS-D), by Region, and Segment Forecasts, 2019-2026,” Grand View Research Report Summary, July 2019 available online here; “Irritable Bowel Syndrome Treatment Market Size Worth Around US$ 3.4 Bn by 2026,”Acumen Research and Consulting Press Release, July 16, 2019 available online here; and “Irritable Bowel Syndrome,” Mayo Clinic, March 17, 2018 available online here.
Image source: newsong, “pill-medicine-capsule-illness-pain-3264951,” Pixabay, March 27, 2018 available online here.

Sterilization Indicators

Hospital or healthcare-associated infections (HAIs) are acquired by patients after they are admitted to a hospital or other health care facility. According to the World Health Organization, 7% of hospitalized patients in developed countries and 10% of hospitalized patients in developing countries will acquire at least one HAI. Patients in intensive care units have dramatically higher rates of HAIs. In the United States, 1 in 25 patients develops this type of infection, resulting in 90,000 deaths per year.

Improperly sanitized medical and surgical instruments1 can transmit infections to vulnerable patients. In 2009, the U.S. Department of Veterans Affairs reported that between 2002 and 2009 nearly 11,000 patients were exposed to HIV, hepatitis B and hepatitis C due to improperly sterilized endoscopes. After a hepatitis C outbreak in a Las Vegas surgery center sickened several people in 2008, the Centers for Medicare and Medicaid Services inspected 1,500 surgery centers and cited 28% of them for deficiencies in equipment cleaning and sterilization. In 2018, outbreaks of infections due to improperly sterilized medical instruments occurred in California, Colorado, Michigan, and New Jersey among others.

At one time, most medical instruments were made of steel or glass. Sterilization was simple. As medical instruments become more specialized, complex and smaller due to the popularity of minimally-invasive surgeries, sterilization procedures have become more complex.

Sterilization, whether by heat, chemicals, irradiation, high pressure or filtration “kills, deactivates, or eliminates all forms of life and other biological agents which are present.”2 In order to ensure proper sterilization of medical instruments, the U.S. Centers for Disease Control and Prevention (CDC) recommends monitoring the sterilization process using mechanical, chemical, and biological indicators. Mechanical monitoring involves checking gauges and displays on the sterilization equipment itself to ensure that the temperature, pressure, and exposure time have reached the recommended levels. These readings can be observed while the sterilization process is happening so any anomalies or malfunctions can be caught early in the process. Chemical indicators such as tapes, strips, tabs, or special package markings contain chemicals that change color when exposed to high temperatures or other sterilizing conditions. Packages with chemical indicators allow medical personnel to distinguish between processed and unprocessed instruments, virtually eliminating the possibility of using instruments that have not undergone a sterilization process. The CDC recommends using mechanical and chemical monitoring each time instruments are sterilized. Biological monitoring involves vials, strips, or tape containing highly resistant microorganisms, strains of bacterial spores. The sterilization process is monitored by how well it kills these organisms.

This week’s market size shows the amount spent on biological and chemical sterilization indicators worldwide for 2017 and projected for 2025. Demand is expected to increase due to a growing geriatric population with chronic health conditions. Increasingly stringent regulations regarding the sterility of healthcare products in order to prevent HAIs is also expected to fuel demand for these products. Biological indicators claimed the largest market share in 2017. Leading companies that manufacture sterilization indicators include Getings AB, Cantel Medical Corp., 3M Co., Cardinal Health Inc., Matachana Group, Mesa Laboratories, and Anderson Products Inc.

1 From here onward “medical instruments” also includes surgical instruments.
2 Source: “Sterilization (Microbiology),” Wikipedia, April 3, 2019 available online here

Geographic reference: World
Year: 2017 and 2025
Market size: $548 million and $1.24 billion, respectively
Sources: “Sterility Indicators Market Size, Share & Trends Analysis Report by Type (Chemical, Biological), by Technique (Heat, Low Temperature, Filtration, Radiation, Liquid), by End User, and Segment Forecasts, 2018 – 2025,” Grand View Research Report Summary, November 2018 available online here; “Global Sterility Indicators Market Size, Share & Trends 2014-2018 & 2025 by Type (Chemical, Biological), & Technique (Heat, Low Temperature, Filtration, Radiation, Liquid) – ResearchAndMarkets.com,” Yahoo! Finance, April 25, 2019 available online here; “Health Care-Associated Infections Fact Sheet,” World Health Organization available online here; Joe Eaton, “Filthy Surgical Instruments: The Hidden Threat in America’s Operating Rooms,” The Center for Public Integrity, February 22, 2012, updated May 19, 2014 available online here; “Sterilization (Microbiology),” Wikipedia, April 3, 2019 available online here; “Biological & Chemical Indicators,” STERIS Life Sciences available online here; “Sterilization: Monitoring,” Centers for Disease Control and Prevention, March 22, 2018 available online here; Chris H. Miller, “Sterilization: Instrumental in Patient Safety,” Sterilizers.com available online here; Karen Bouffard, “Dirty Instruments Cause Second DMC Hospital to Fail Federal Inspection,” The Detroit News, November 28, 2018 available online here; Alyssa Rege, “State Declares ‘Immediate Jeopardy’ at UC San Diego Hospital Over Dirty Surgical Instruments,” Becker’s Clinical Leadership & Infection Control, June 8, 2018 available online here; Alyssa Rege, “Bone, Blood, Bugs Found on Instruments at Denver Hospital After Surgical Breach, Report Says,” Becker’s Clinical Leadership & Infection Control, June 14, 2018 available online here; Julia Jones, “3,000 People May Have Been Exposed to Bloodborne Infections at NJ Surgery Facility,” CNN, December 26, 2018 available online here.

Image source: rawpixel, “steel-black-and-white-bw-care-3309870,” Pixabay, April 11, 2018 available online here.

Viscosupplementation

injectable treatments syringe

Osteoarthritis is the degeneration of the cartilage that cushions the ends of bones. This causes stiffness, pain, swelling, and loss of mobility in the affected joint. It is the fifth leading cause of disability in the world, affecting 10% of the world’s population 60 years of age and older. In high-income countries, up to 80% of people aged 65 and older will suffer from osteoarthritis. In the United States, it is the most common cause of disability in adults. More than 30 million Americans suffer from this condition and 14 million have symptomatic knee osteoarthritis.

Viscosupplementation is one type of treatment for this condition. It was developed in Europe in the 1980s specifically to treat knee osteoarthritis. In 1997, the U.S. Food and Drug Administration approved it “for the treatment of pain in osteoarthritis … of the knee in patients who have failed to respond adequately to conservative non-pharmacologic therapy and simple analgesics, e.g. acetaminophen.”1

Viscosupplementation is a medical procedure in which a gel-like fluid containing synthetic hyaluronic acid is injected into a joint to treat symptoms of osteoarthritis. The fluid provides cushioning for the bones. Hyaluronic acid is naturally secreted by mesothelial cells present in the joints. Treatments are performed once a week for three to five weeks. Some newer forms only require one injection. Once the pain and swelling from the procedure itself dissipate, some patients experience reduced arthritis pain and better mobility for up to 6 months. Others may not experience any pain relief at all. Viscosupplementation is generally prescribed for people who have early, mild to moderate knee osteoarthritis, patients who previously have taken NSAID pain relievers but whose pain was not alleviated. Some brand names include Synvisc, Euflexxa, Orthovisc, Hyalgan, and Monovisc, to name a few.

Today’s market size shows the amount spent on viscosupplementation worldwide in 2016 and projected for 2026. Demand for viscosupplementation treatments is expected to increase due to the preference for minimally-invasive procedures, the growing geriatric population worldwide and the increase in the number of people who have conditions that make them prone to osteoarthritis such as obesity, diabetes, hypertension, cardiovascular disease, and trauma to the joints due to repetitive movements. Several leading companies in this industry include Sanofi, Allergan, Hoffmann-La Roche, Zimmer Biomet, Smith & Nephew Plc, Anika Therapeutics Inc., Fidia Farmaceutici S.P.A., Ferring B.V., Bioventus, Regen Lab SA, among others.

1 Source: “American College of Rheumatology Position Statement” available online here.

Geographic reference: World
Year: 2016 and 2026
Market size: $3 billion and $6.6 billion, respectively
Sources: “Viscosupplementation Market by Product (Single Injection, Three Injection, Five Injection), by Region (North America, Europe, Asia Pacific, Latin America, MEA), and Segment Forecasts, 2018 – 2025,” Grand View Research, August 2017 available online here; “Viscosupplementation Market Size to Cross 6.6 billion USD by 2026,” MarketWatch Press Release, April 15, 2019 available online here; “Osteoarthritis,” Mayo Clinic, March 6, 2018 available online here; Beth W. Orenstein, “A Closer Look at Knee Injections,” Healthgrades, Reviewed by William C. Lloyd III June 12, 2017 available online here; “American College of Rheumatology Position Statement” available online here; “Hyaluronic Acid (Injection Route),” Mayo Clinic, February 1, 2019 available online here; Arthritis by the Numbers: Book of Trusted Facts & Figures, Arthritis Foundation, 2018 available online here; “Viscosupplementation Market: Hyaluronic Acid Type (Stabilized Hyaluronic Acid), Procedure Type (Three-Injection Procedure), Application, and Region (Asia-Pacific, Europe, North America, Latin America, and Middle East & Africa) — Global Forecast till 2023,” Market Research Future, March 2019 available online here.

Image source: qimono, “syringe-shot-medicine-bottle-1884758,” Pixabay, December 6, 2016 available online here.

Medicare Advantage

Medicare for All. That’s the new buzz phrase among Democratic Presidential candidates for the 2020 election. But, proposals for a national health insurance program are nothing new. By the 1930s many Western democratic countries were adopting national health insurance programs, but the United States continued to rely on private health insurers. In 1934, in the midst of the Great Depression, President Franklin D. Roosevelt created the Committee on Economic Security. This committee was to draft a bill that would do just that, namely give economic security to Americans. The Social Security Act that was drafted included an old-age pension program, unemployment insurance financed by employers, health insurance for people in poverty, and financial assistance for widows with children and the disabled. However, the bill that Roosevelt signed into law on August 14, 1935, was more limited in scope and did not contain a health insurance component. President Roosevelt wanted to keep provisions for health insurance in the Social Security Act but feared the backlash would jeopardize passage of this legislation. Opponents argued that government-financed health care would allow the government to come between the doctor and the patient, mandating how doctors treat patients and how much they charge.

In 1937, the U.S. Surgeon General proposed that National Health Insurance, which was still being debated in Congress, first include Social Security beneficiaries. Two decades later in 1957, after years of national health insurance proposals going nowhere,1 Congressmen Aime Forand and Cecil King proposed limiting this type of insurance to only cover some of the medical expenses of those 65 years of age and older, paid for by Social Security payroll taxes. The media dubbed this proposal Medicare. Those in this age cohort required twice as much hospital care as those younger than 65, and despite getting Social Security benefits, could not afford the rising cost of hospitalization. Only half had health insurance. Nearly one in three lived in poverty.

Despite Democratic support in the House and Senate, support from labor unions, and support from the candidate, then President John F. Kennedy, the strong opposition from fiscal conservatives in Congress, the insurance companies and the American Medical Association stalled legislation. It would take more debate, compromise, a landslide victory for Democrats in the 1964 election, reforms and reorganizations of committees and their rules and the newly elected President, Lyndon B. Johnson, to make this program his top priority to get Medicare passed and signed into law on July 30, 1965. When the law took effect in 1966, more than 19 million people enrolled in the program.

Original Medicare, as it is now called, contains Part A, inpatient hospital coverage,2 and Part B, outpatient medical coverage,3 for Americans aged 65 and older receiving Social Security or Railroad Retirement benefits. Part B premiums are deducted from beneficiaries’ monthly Social Security or Railroad Retirement payments. In 1972, Medicare eligibility was extended to Social Security Disability Insurance beneficiaries younger than 65 and those with end-stage renal disease.

In June 1980, President Jimmy Carter signed the Social Security Disability Act of 1980 which created Medigap insurance policies. These policies, issued by private insurance companies and paid for by monthly premiums, pay for some or all of what Medicare does not, such as deductibles, coinsurances, and copayments, depending on the policy. Federal standards for these policies were not established until 1990.

The Balanced Budget Act of 1997 established the Medicare+Choice program, now called Medicare Part C or Medicare Advantage.4 These plans, alternatives to Original Medicare, are run by private insurance companies and are regulated by the Federal government. They must cover all of the services Original Medicare Part A and Part B covers. Medicare pays Medicare Advantage providers a per-enrollee fee to provide this coverage.5 In addition, many plans cover services Original Medicare does not such as vision and dental care. Most also offer prescription drug coverage, although Original Medicare beneficiaries can also opt-in for prescription coverage through Medicare Part D. Medicare Part D is administered by private insurance companies. Regardless of whether Medicare beneficiaries opt for Original Medicare or choose to pay for a Medicare Advantage plan, they must pay the Original Medicare Part B premium, which is $135.50 per month in 2019.6

While these plans offered new choices in health coverage for many seniors, they also complicated the process of choosing health coverage. To provide information for seniors about their choices, the Federal government launched the Medicare.gov website in 1998. Starting January 1, 1999, the 1-800-MEDICARE toll-free phone number was available nationwide and the first annual Medicare & You Handbook was mailed to all Medicare beneficiaries. Whether these informational resources help or not is debatable, but more than two decades later, the process is still confusing for many seniors and their loved ones who are trying to help them.7

Today’s market size shows the number of enrollees in Medicare Advantage plans in 1999, 2009, and 2018 in the United States. In 1999, 18% of Medicare beneficiaries were enrolled in Medicare Advantage plans; in 2009, 23% and in 2018, 34%. From 1999 to 2004, Medicare Advantage plan enrollment fell from 6.9 million to 5.3 million enrollees. Since then, however, enrollment has grown year after year. In 2018, 67% of Medicare Advantage enrollees had individual plans. Twenty percent were covered by employer- and union-sponsored group plans and the remaining 13% had special needs plans. Special needs plans are tailored to beneficiaries who have certain chronic conditions, are institutionalized, or qualify for both Medicare and Medicaid. While only 20% of enrollees nationwide are covered by Medicare Advantage group plans, nine states have a disproportionately high percentage of enrollees covered by such plans. In Alaska, 100% of Medicare Advantage enrollees were covered by group plans in 2018. The other eight states include West Virginia (53%), Michigan (51%), Illinois (42%), Kentucky (39%), Delaware (37%), Maryland (35%), New Jersey (34%), and Wyoming (30%). As more unions and large employers, including state governments, seek to lower their retiree healthcare costs, more are turning to Medicare Advantage plans to provide healthcare coverage. The Congressional Budget Office predicts that enrollment in all types of Medicare Advantage plans nationwide will include 42% of all Medicare beneficiaries by 2028.

1 Thanks in part to lobbying efforts by the American Medical Association, which characterized National Health Insurance as “un-American” and implied that those in President Harry Truman’s Administration who supported it were Communists.
2 Includes inpatient hospital stays, care in a skilled nursing facility on a short-term basis, hospice care, and some home health care.
3 Includes doctors’ services, outpatient care, medical supplies, and preventative services.
4 Medicare+Choice was renamed Medicare Advantage in the Medicare Prescription Drug, Improvement, and Modernization Act of 2003, signed by President George W. Bush. This law also established the Medicare Part D prescription drug benefit.
5 Before the Affordable Care Act revised payment structures to insurance companies that administer Medicare Advantage plans, the Medicare Payment Advisory Committee found that Medicare was paying 14% more per Medicare Advantage enrollee than the cost of care for an enrollee in Original Medicare due to changes over the years to encourage private plan participation and enrollment.
6 In 1965 the monthly premium was $3; in the early 2000s, about $50.
7 Judging from the more than 100 comments below the Center for Medicare & Medicaid Services YouTube video titled “Medicare & You: Understanding Your Medicare Choices”.

Geographic reference: United States
Year: 1999, 2009 and 2018
Market size: 6.9 million, 10.5 million and 20.4 million enrollees, respectively
Sources: Gretchen Jacobson, et. al., “A Dozen Facts About Medicare Advantage,” Henry J. Kaiser Family Foundation, November 13, 2018 available online here; Julian E. Zelizer, “How Medicare Was Made,” The New Yorker, February 15, 2015 available online here; History.com Editors, “Social Security Act,” A&E Television Networks, Last updated August 21, 2019 available online here; “National Health Insurance—A Brief History of Reform Efforts in the U.S.” Focus on Health Reform, The Henry J. Kaiser Family Foundation, March 2009 available online here; Nancy De Lew, “Medicare: 35 Years of Service,” Health Care Finance Review, Fall 2000, page 22, Medicare and Medicaid Research Review, U.S. National Library of Medicine, National Institutes of Health available online here; “The Parts of Medicare (A, B, C, D),” Medicare Interactive.org available online here; “Filling Gaps in Medicare Coverage and Getting Help with Medicare Costs,” Medicare Interactive.org available online here; “Medicare Timeline,” Henry J. Kaiser Family Foundation, March 24, 2015 available online here; Medicare & Medicaid Milestones 1937-2015, Center for Medicare & Medicaid Services, July 2015 available online here; “CMS’ Program History,” Center for Medicare & Medicaid Services, June 20, 2018 available online here; CMSHHSgov, “Medicare & You: Understanding Your Medicare Choices,” YouTube, April 30, 2015 available online here; “Medicare.gov” available online here; Chris I. Young, “Medicare vs. Medicare Advantage: How to Choose,” U.S. News & World Report, March 23, 2018 available online here; “Medicare Advantage (Part C),” eHealth Medicare, November 1, 2017 available online here; Steve Anderson, “A Brief History of Medicare in America,” Medicare Resources.org, February 27, 2018 available online here; George B. Moseley III, “The U.S. Health Care Non-System, 1908-2008,” AMA Journal of Ethics,” May 2008 available online here; “Medicare Advantage,” Henry J. Kaiser Foundation, October 10, 2017 available online here.
Image source: Sabine van Erp, “hands-old-old-age-elderly-2906458,” Pixabay, November 1, 2017 available online here.

Tissue Diagnostics

Microscope slide tissue diagnostics

Cancer is the second leading cause of death in the world.1 In 2018, an estimated 17 million people worldwide were newly diagnosed with cancer, an increase from 12.3 million in 2007. When a doctor suspects cancer, the first step in the diagnosis process is usually a biopsy, a microscopic examination of a patient’s tissue sample performed by a pathologist. After the sample is prepped, the tissue undergoes hematoxylin and eosin staining. This process stains different cells and structures so that they’re visible under a microscope. The pathologist can then detect any abnormalities. In most cases, this is the only step needed for diagnosis.

In other cases, specialized staining is needed to determine amounts of specific proteins or the presence of certain genes, which then determines how a patient might respond to treatment. In an immunohistochemistry (IHS) test a diagnostic antibody is used to detect proteins in cells or cell membranes. If the specific protein looked for is present, the antibody binds to it. This can be detected as a color change under a microscope. In this way, an IHS test can determine what type of drug therapy will be most effective. An IHS test can also detect if a tumor is benign or malignant.

Beyond cancer diagnosis, IHS tests are used to diagnose autoimmune, cardiovascular, infectious, and nephrological diseases. They are also used to diagnose diabetes. In medical research laboratories, they’re used to test the effectiveness of new therapeutic drugs. This type of test is considered the most profitable tissue diagnostic test. In 2017, IHS test revenue was valued at $1.6 billion.

Other types of tissue diagnostic tests include fluorescent in situ hybridization and silver in situ hybridization. They are used to detect the presence of human epidural growth factor receptor 2 proteins, also known as HER2 proteins, on breast cancer tumors. Tumors that tend to grow and spread faster have higher than normal levels of the HER2 protein. These tumors respond better to newer cancer drugs that specifically target HER2-positive tumors.

Today’s market size shows the total revenue from tissue diagnostic tests globally in 2018 and projected for 2025. Demand for tissue diagnostics is expected to grow due to an aging population and rising incidence of chronic diseases worldwide. Not surprisingly, hospitals claimed half of the market share due to the high volume of tests done for disease diagnosis, monitoring, and treatment. Research laboratories claimed about 25% of the market. Pharmaceutical organizations and clinical research organizations combined claimed the rest. Leading companies in this industry include F. Hoffmann-La Roche Ltd., Abbott, Siemens Healthineers, and QIAGEN.

1 According to the World Health Organization, cardiovascular diseases claimed 17 million, cancer 9 million, and infectious and parasitic diseases 5.5 million lives worldwide in 2018.

Geographic reference: World
Year: 2018 and 2025
Market size: $3.9 billion and $6.03 billion, respectively
Sources: “Tissue Diagnostics Market Analysis Report by Technology (Immunohistochemistry, In Situ Hybridization, Digital & Anatomic Pathology), by Application, by End Use, and Segment Forecasts, 2019 – 2025,” Grand View Research Report Summary, January 2019 available online here; “Tissue Diagnostics Market Worth $6.03 Billion by 2025 | CAGR: 6.6%,” Grand View Research Press Release, January 2019 available online here; Global Cancer Facts & Figures 4th Edition, American Cancer Society, 2018 available online here; Global Cancer Facts & Figures 2007, American Cancer Society, 2007 available online here; “What Happens With a Biopsy?” F. Hoffman-La Roche Ltd., 2019 available online here; “Breast Cancer HER2 Status,” American Cancer Society, September 25, 2017 available online here.
Image source: Konstantin Kolosov, “analysis-biochemistry-biologist-2030265,” Pixabay, February 1, 2017 available online here.