Milk

Today’s market size is the size of milk production in the United States in 2007 and 2011. Milk prices in 2011 were at an historic high, in part because the costs of feed were also very high. The drought of 2012 has only served to tighten the feed market further and it is anticipated that both feed and milk costs will continue to rise through 2012 and beyond.

Geographic reference: United States
Year: 2007 and 2011
Market size: 185,655 and 196,246 million pounds
Source: “Milk Cows and Production by State and Region,” September 20, 2012, part of a series of reports produced by various agencies within the USDA’s Economic Research Service and available online here.
Original source: U.S. Department of Agriculture
Posted on September 21, 2012

Food and Beverage Store Sales

Food & Beverage Store Sales

In the United States, people pay less for food than anywhere else in the world, as a percentage of their total expenditures. Here is a link to a site with a very interesting world map showing U.S. Department of Agriculture and Euromonitor data on how much of our total expenditures we spend on food worldwide, nation by nation. As many people worry about the cost of food rising it is worth noting, at the most basic level, just how inexpensively we’re able to feed ourselves in the United States.

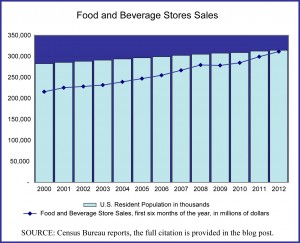
Today’s market size is the value of food and beverage store sales in the United States for the first six months of 2000 and 2012. The graph shows the first six months of each year’s food and beverage store sales for the entire period.

Geographic reference: United States
Year: 2000 and 2012 (January – June)
Market size: $215.6 and $311.2 billion respectively
Source: Monthly Retail Trade Report, August 14, 2012, part of a series of reports by the U.S. Census Bureau, available online here.
Original source: U.S. Department of Commerce
Posted on September 13, 2012

Better Burger Restaurants

The better burger restaurant market is defined as establishments that make burgers to order with fresh ingredients, in particular, fresh meat. Examples of the sorts of restaurants that are counted as better burger restaurants include Red Robin Gourmet Burgers, Five Guys Burgers and Fries, and Bagger Dave’s.

Although the market for better burger restaurants is still minuscule compared to the $200 billion fast-food and fast-casual burger restaurant market, sales growth exceeded growth in the fast-food and fast-casual burger restaurant market in 2010. Sales growth for better burger restaurants was 21% compared to a 3.2% growth rate for fast-food and fast-casual burger restaurants. Better burgers are often made with fresh Angus beef, better-quality buns, premium cheeses, and homemade condiments. Some better burger restaurants also offer turkey burgers and veggie burgers. Data represent restaurant sales in 2011.

Geographic reference: United States
Year: 2011
Market Size: $2.2 billion
Source: Davis, Scott, “Building a Better Burger: Mid-Michigan Opens Wide for ‘Better Burger’ Market,” Lansing State Journal, August 12, 2012, page 1E
Original Source: Technomic
Posted on August 14, 2012

Crop Insurance

The drought being experienced this year in most of the United States will have an impact on the cost of food in the not distant future. Farmers will have a difficult year, but how difficult? As it turns out, less than one might expect. Over the last decades there has been a significant increase in the use of crop insurance in the United States and an escalation of the subsidies received from the federal government to cover crop insurance premiums. In 2011, the federal government picked up 60% of crop insurance premiums. In fact, crop and revenue insurance now represents the primary federal support for farm income, paying $5.2 billion in direct payments to farmers and $7.4 billion in insurance premium subsidies.

Today’s market size post lists the number of acres of farmland covered by crop insurance in 1981 and 2011 as well as the total insured liability each year. The level of government subsidies for crop insurance has risen quite substantially over this period. Total premiums paid for crop insurance in 2011 were approximately $12.3 billion, of which the federal government picked up 60%, or $7.4 billion.

Our hope is that all those impacted by this drought are spared serious damage and that starvation in distant places of this ever more connected world does not rise as a result of crop shortfalls in the United States.

Geographic reference: United States
Year: 1981 and 2011
Market size: Acres: 45 million and 262 million respectively
Market size: Insured liability: $6 billion and $113 billion respectively
Source: Keith Collins and Harum Bulut, “Crop Insurance and the Future Farm Safety Net,” February 10, 2012, available online here and Andrew G. Simpson, “Cap on Subsidy of Crop Insurance Premium Would Save $1 Billion: GAO,” April 13, 2012, available online here.
Original source: FarmDocDaily, Insurance Journal, U.S. Department of Agriculture, and the U.S. Government Accounting Office.
Posted on August 1, 2012

Peanut Butter

In the United States peanuts are popular. They form the basis for a staple of many American’s diets, peanut butter, a reasonably priced source of protein. As a consequence, there has been much press coverage lately about the likely increase in the price of peanut butter. The poor peanut crop in 2011 has caused raw peanut prices to rise and this increased price is expected to be seen on grocery store shelves shortly.

Today’s market size is the size of the market for peanuts for use in the production of peanut butter in the United States. In the year 2000 peanut butter accounted for the end use on half the peanut crop and in 2009 peanut butter accounted for 63.5% of peanut usage.

Geographic reference: United States
Year: 2000 and 2009
Market size: 753 million pounds and 1.19 billion pounds respectively.
Source: “Peanut Use by Type of Product,” part of the USDA’s Economic Research Service series of reports on the availability of foods by type, available here.
Original source: U.S. Department of Agriculture, Economic Research Service
Posted on January 17, 2012

Cantaloupes and Other Agricultural Commodities

Being people who work with statistical data every day it was with great pleasure that we read recently that the USDA has decided to reverse its earlier decision to eliminate dozens of longstanding statistical reports that it has maintained for decades. Turns out the industries being covered by these reports find them extremely valuable, essential really. So, industry leaders explained just how important those reports are to their planning and financing and the USDA reconsidered. We find this development most encouraging. Some things really are best done at the large scale by an entity not motivated by its own commercial interests.

Today’s market size, selected from a long list of in-depth USDA commodity reports, is the market for domestic cantaloupe. It is the value (farm value or wholesale value) of cantaloupes harvested in in the United States in 2010 when 77,430 acres were planted with cantaloupe.

Geographic reference: United States
Year: 2010
Market size: $314.4 million
Source: William Neuman, “U.S. Reverses Decision To End Farming Reports,” The New York Times, December 24, 2011, page B3, available online here. The USDA report on cantaloupes can be found online here. The figure used here is from Table 3—U.S. Cantaloupe: Acreage, Yield, Production, and Value, 1950-2010.
Original source: U.S. Department of Agriculture
Posted on December 30, 2011

Caviar

Caviar is one of those luxury items that has not seen a great decline during the recession and financial crisis that started in 2007 and 2008. In fact, demand for caviar has been strong and since overfishing in the Caspian Sea has left the sturgeon species depleted in that region, farms are emerging around the world to produce caviar and meet the strong demand.

In the 1970s, an estimated 550 tons of caviar were produced annually around the world. This caviar came primarily from wild sturgeon. Forty years later, production comes primarily from farm-raised sturgeon and while production is down sharply from the highs of the 1970s, it is expected to continue rising into the foreseeable future.

Today’s market size is the estimated total world production of caviar in 2010.

Geographic reference: World
Year: 2010
Market size: 250 tons with a wholesale price in the range of $500 to $600 per pound.
Source: Raphael Minder, “Caviar Migrates Beyond The Caspian Region,” The New York Times, December 17, 2011, page B3.
Original source: Patrick Williot
Posted on December 17, 2011

Grocery Stores

Groceries

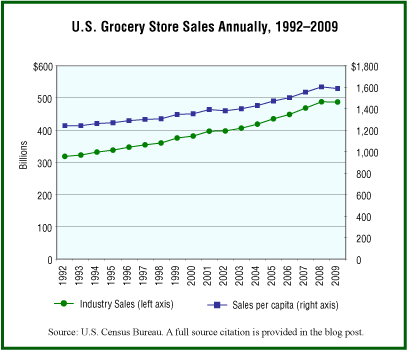
Food is something necessary to life and so it may seem, to those not in the business, that grocery stores would be immune to recessions. For the most part, U.S. grocery stores as an industry have weathered the two recessions of the decade 2000–2009 far better than other industries. But, as can be seen in the graph, even grocery stores saw sales slow during the recessions.

Today’s market size is the estimated total of sales by grocery stores and supermarkets in the United States in 2000 and 2009. These sales totals do not include the sales made through convenience stores.

Geographic reference: United States
Year: 2000 and 2009
Market size: $381.72 billion and $487.41 billion respectively
Source: “Estimated Annual Sales of U.S. Retail and Food Service Firms by Kind of Business: 1998 Through 2009,” Annual Retail Trade Survey—2009, available in a PDF format here. For links to these data as well as earlier U.S. Annual Trade Survey data, check this Census Bureau site.
Original source: U.S. Bureau of the Census
Posted on October 12, 2011

Farmers Markets

Our selection of a market for today’s post was made to honor National Farmers Market Week.

Over the past 40 years, farmers markets have grown in popularity. As people become more health conscious and demand locally- and organically-grown foods, more and more cities and towns host farmers markets in the summertime. In 2010, there were also nearly 900 farmers markets operating in the wintertime (November through March). According to a new report by an agricultural economist with the Union of Concerned Scientists, increasing the number of farmers markets could create tens of thousands of jobs in economically struggling rural and urban areas.

To promote farmers markets, the U.S. Department of Agriculture instituted National Farmers Market Week in 2000. In 2011, National Farmers Market Week is August 7-13. Data show the number of farmers markets nationwide in 1970 and 2011.

Geographic reference: United States
Year: 1970 and 2011
Market size: 340 and more than 7,000 respectively
Source: “Farmers Markets Boost Local Economies,” WLNS.com, August 4, 2011, available online here; Sam Jones-Ellard, “USDA Highlights Nearly 900 Operating Winter Markets; Many Markets Located in Cold-Weather States,” Agricultural Marketing Service, U.S. Department of Agriculture, December 8, 2010, available online here.

Fish Catch

While many spend summer hours in the often leisurely act of fishing, we look today at fishery production for our market size. The market presented below is the size of the domestic catch in the United States for 2008. This does not include, of course, all those Rock Bass, Walleye, Trout, Bluegill, Pike and Perch being pulled from lakes and streams all over the country by sports fisherman. Rather it is the size of the commercial catch.

Geographic reference: United States
Year: 2008
Market size: 8,326 million pounds
Source: “Table 889. Fishery Products—Domestic Catch, Imports, and Disposition: 1990 to 2008,” Statistical Abstract of the United States 2011, January 2011, page 566, available online here.
Original source: U.S. Census Bureau

Agaricus & Specialty Mushrooms

There were 312 growers of agaricus and specialty mushrooms in the United States in the 2009-2010 growing season. Today’s market size is the estimated value of their crop of agaricus and specialty mushrooms. The State of Pennsylvania was the leading state for this crop with a 49.56% share of the total crop. California was the next largest producing state with a 20.78% share and Washington was the third largest with a 2.48% share.

Geographic reference: United States
Year: 2009-2010 Season
Market size: $924.86 million
Source: “Mushrooms,” one in a series of crop reports produced by the U.S. Department of Agriculture, last updated on August 19, 2010. Here is a link to the USDA report on mushrooms.
Original source: U.S. Agriculture Department (USDA)

Pets in Japan

Today’s market size is an estimated size for the pet care sector in Japan. This is a measure of the market for all products and services related to household pets. In Japan, one third of this market is made up of pet food. As in the United States, the pet sector is growing strongly in Japan. However, based on a calculation of population to estimated pet dog and cat numbers, fewer than half as many Japanese households have a dog or cat as a pet as U.S. households.

Geographic reference: Japan
Year: 2009
Market size: ¥1.2 trillion (approximately $12.96 billion based on the exchange rate on December 31, 2009)
Source: “At ¥1.2 Trillion, Pet Sector Recession-Proof,” The Japan Times Online, October 28, 2010, available online here.
Original source: Fuji Keisai Company

Chicken Eggs

Poultry and poultry products are a growing agricultural segment in the United States. The state that produces the greatest number of chicken eggs in the United States is Iowa, which in 2010 accounted for 16% of national production. Their leadership in this market is relatively new. As of 1998 Iowa’s chicken egg production accounted for 7.5% of the national total.

Wishes for a happy Easter Holiday to all.

Geographic reference: United States
Year: 1998 and 2010
Market size: 79,717 and 91,398 million eggs
Source: “Chickens and Eggs 2010 Summary,” one in a series of reports put out regularly by the U.S. Department of Agriculture’s National Agricultural Statistics Service. The report is accessible online here. The 1998 data come from an earlier edition of this same report. These earlier USDA reports may be accessed here.

Fresh Vegetables, Exports & Imports

Today’s market sizes are the value of fresh fruit exported from and imported into the United States. Two year’s worth of import and export figures are provided. The export values are based on free alongside ship (FAS) values at the U.S. port of exportation while the import values are based on customs value at the U.S. port of entry.

Geographic reference: United States
Year: 2010 and 2020
Market size: Exports: $2,060 and $2,791 million respectively
Market size: Imports: $5,180 and $8,985 million respectively
Source: “Table 29. Horticultural Crops Long-Term Export and Import Projections, Fiscal Years,” USDA Agricultural Projections to 2020, February 2011, page 80, available online here.
Original source: U.S. Department of Agriculture, Interagency Agricultural Projections Committee, and the U.S. Department of Commerce, Bureau of the Census

Fresh Fruit, Exports & Imports

Today’s market sizes are the value of fresh fruit exported from and imported into the United States. Two year’s worth of import and export figures are provided. The export values are based on free alongside ship (FAS) values at the U.S. port of exportation while the import values are based on customs values at the U.S. port of entry.

Geographic reference: United States
Year: 2010 and 2020
Market size: Exports: $3,799 and $5,684 million respectively
Market size: Imports: $6,803 and $11,190 million respectively
Source: “Table 29. Horticultural Crops Long-Term Export and Import Projections, Fiscal Years,” USDA Agricultural Projections to 2020, February 2011, page 80, available online here.
Original source: U.S. Department of Agriculture, Interagency Agricultural Projections Committee, and the U.S. Department of Commerce, Bureau of the Census

Trade in Corn

The United States has long been the world’s leader in the production of corn for export. This trend is expected to continue although the percentage of total corn exports coming out of the United States is projected to fall from 54.5% in 2009-2010 to 52.7% in the growing season 2020-2021. This projection is one among many presented in a report titled USDA Agricultural Projections to 2020. In-depth reports such as this one are being put out regularly by the Federal government’s many agencies.

Today’s market size post is a measure of the corn exported in 2010 and projected exports worldwide in 2020.

Geographic reference: United States and World
Year: 2010 and 2020
Market size: United States: 49.5 and 59.7 million metric tons respectively
Market size: World: 93.1 and 113.2 million metric tons respectively
Source: “Table 5. Corn Trade Long-Term Projections,” USDA Agricultural Projections to
2020,
February 2011, page 49, available online here.
Original source: U.S. Department of Agriculture, Interagency Agricultural Projections Committee

Fish and Fishery Product Exports

Exports of fish and fishery products have grown quickly in the last decade, as has all production of fish and fishery products, whether through capture (fishing) or aquaculture (cultivation). Leading fish and fishery product exporters in the world are, in order, China, Norway, Thailand, Denmark, Vietnam, and the United States. Together, the exports of these six countries in 2008 accounted for 36.5% of all exports.

Geographic reference: World
Year: 1998 and 2008
Market size: $51.45 and $101.98 billion respectively.
Source: “Table 11 — Top Ten Exporters and Importers of Fish and Fishery Products,” The State of Fisheries & Aquaculture 2010, page 52, available online here.
Original source: United Nations, Food & Agriculture Organization (FAO), Fisheries and Aquaculture Department.

Fish and Fishery Product Imports

Aquaculture is a fast growing part of the fish and fishery products market and as catches and harvests of this aquatic produce have increased over the last decade, so has the international trade of fish and fishery products. The top countries in terms of fish and fishery product imports are, in order, Japan, United States, Spain, France, Italy and China. Interestingly, China and the United States are also among the leading exporters of aquatic produce.

Geographic reference: World
Year: 1998 and 2008
Market size: $55.05 and $107.13 billion respectively.
Source: “Table 11 — Top Ten Exporters and Importers of Fish and Fishery Products,” The State of Fisheries & Aquaculture 2010, page 52, available online here.
Original source: United Nations, Food & Agriculture Organization (FAO), Fisheries and
Aquaculture Department.

Aquaculture

World Population and Aquaculture Production in 2008

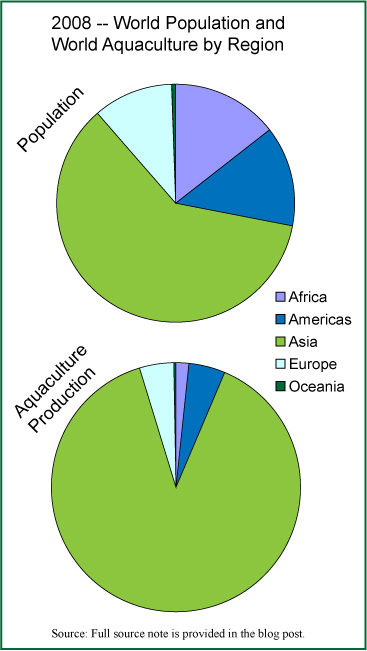
Aquaculture is the cultivation of aquatic plants and animals for human use and is also referred to as aquafarming. To say that aquaculture has grown rapidly since 1970 would miss the point entirely. The quantity of aquatic produce harvested in 1970 was a mere fraction—1/20th—of that harvested in 2008. The growth of aquaculture has been strong across all regions of the world. Nonetheless, Asia has seen enough growth in aquacultural production to raise its already high percentage of world production in 1970 (69.6%) to a remarkable 88.8% in 2008. In the chart we provide here you will see the world’s population presented by region as well as the world’s aquacultural production by region.

The market sizes presented here do not include aquatic plants but do cover all caught and raised fish of any kind from marine and inland waterway sources.

Geographic reference: World
Year: 1980, 2000 and 2008
Market size: 4.7, 32.4 and 52.5 million tons respectively.
Source: “Table 4 — Aquaculture Production by Region: Quantity and Percentage of World Production,” The State of Fisheries & Aquaculture 2010, page 20, available online here. The population data used in the chart are from the Statistical Abstract of the United States 2011, available online here.
Original source: United Nations, Food & Agriculture Organization (FAO), Fisheries and
Aquaculture Department and U.S. Census Bureau.

Fishing and Aquaculture

As the world population grows, so do all efforts to feed that population. An important resource in this effort are our inland waterways, oceans and seas. Aquaculture—the cultivation of aquatic plants and animals also referred to as aquafarming—is the fastest growing sector within this industry. Fishing in the wild is, in many places, becoming more difficult because of regulations to prevent overfishing or because overfishing itself has already caused a serious decline in the fish population, as happened to dramatic effect off the eastern coast of Canada in the early 1990s.

Tomorrow we’ll look at the aquaculture portion of this market.

The market sizes presented here do not include aquatic plants but do cover all caught and raised fish of any kind from marine and inland waterway sources.

Geographic reference: World
Year: 1998 and 2008
Market size: 117.2 and 142.3 million tons respectively. Approximately 80% of both year’s totals were for human consumption—93.3 and 115.1 million tons respectively.
Source: “Table — 1 World Fisheries and Aquaculture Production and Utilization,” The State of Fisheries & Aquaculture 2010, page 3, available online here. The data for 1998 are from the 2000 edition of this same report, same table number, page 6, and available online here.
Original source: United Nations, Food & Agriculture Organization (FAO), Fisheries and Aquaculture Department.