Video on Demand

video on demand streaming
Video on demand is a method of media distribution in which viewers can access a provider’s library of video content with or without a television set and without the constraints of a static broadcasting schedule as is the case with over-the-air programming. Video on demand can be offered through internet protocol television (IPTV) services or through over-the-top (OTT) media services. IPTV uses a dedicated, private network provided by an internet service provider to stream live television, pay-per-view, and video on demand content over the internet through a set-top box or “stick” device connected to a customer’s television or directly through an app on a smart TV that has wi-fi capabilities. IPTV content can also be viewed using apps on tablets and smartphones and on computers through a web browser or through video applications that can play M3U8 files. As of April 2019, there were an estimated 100 million IPTV subscribers worldwide.

While there are many legal IPTV providers such as Sling TV, Xfinity Flex, DirecTV Now, AT&T U-verse and Zattoo, to name a few, there are also many companies that provide content they are not licensed to sell. According to a 2017 Sandvine Intelligent Broadband Networks study, 6.5% of North American households have accessed a pirated IPTV service. Pirated IPTV services were valued at $840 million per year while traditional content providers lost $4.2 billion per year due to copyright infringement. In recent years, content providers have filed lawsuits against IPTV providers that transmit unauthorized content. In 2019, Set TV NOW, with more than 180,000 subscribers, was the first major IPTV provider to shut down. The judge ordered the company to pay DISH Network Corp. more than $90 million in damages. In November 2019, police raids in Spain, Italy, the Netherlands, France, and Bulgaria shut down Xstream-codes.com, a company that provided the software that ran many IPTV systems. Its 5,000 clients, IPTV providers, served more than 50 million customers around the world. In 2020, more lawsuits against these types of companies are expected in the United States and around the world. Lawsuits against companies that make the services possible such as website hosting companies, file hosting companies, and companies that process the payments are also expected.

OTT services use the open internet to stream their video on demand content. A customer’s internet service provider treats data packets for streamed content the same as data packets for any other content sent over the internet. As a result, the quality of the viewing experience depends on the speed and quality of the customer’s internet connection. Customers need either a set-top box, “stick” device, multipurpose device like a game console that can stream video content, or a wi-fi enabled smart TV to view content on their television sets. OTT content can also be viewed on computers, tablets, and smartphones.

There are three types of OTT services: advertising-based (AVOD), transaction-based (TVOD), and subscription-based (SVOD). Advertising-based services are free to use, but customers must watch commercials like they do when they watch over-the-air, cable or satellite TV. YouTube and DailyMotion are examples of AVOD services. Transaction-based services allow users to sign up for the service for free and then the amount they pay is dependent on the content they watch. iTunes is an example of a TVOD service. Subscription-based video on demand services may be the best-known type of OTT. A user pays a monthly or yearly fee to stream an unlimited amount of video content. Netflix and Hulu are two examples of subscription-based OTT services.

Today’s market size shows the total global revenues for video on demand services for 2019 and projected for 2024. OTT services have the highest market share with subscription-based service revenue expected to grow at the highest compound annual growth rate (CAGR) over this time period. Overall, the global video on demand market is expected to grow at a CAGR of 17.5%. According to analysts, growth in this industry will be due to increasing broadband internet access globally, including access to 4G and 5G technologies, and the increasing popularity of smartphones. Services that offer a large variety of content in different genres and languages will also contribute to growth in this industry. North America is expected to account for 40% of the revenue between 2019 and 2024, with the Asia-Pacific region claiming 30%, Europe 20%, Latin America 5% and the Middle East and Africa 5%. Leading companies include Netflix, Amazon, Google, YouTube, Apple, Roku, Vudu, Hulu, Huawei, and Fujitsu among others. In the Asia-Pacific region the following companies are expected to capture most of the market share: YouTube, iQiyi, Tencent Video, Youku, ByteDance, Netflix, Amazon, Hotstar, and Hulu Japan.

Geographic reference: World
Year: 2019 and 2024
Market size: $38.4 billion and $87.1 billion, respectively
Sources: The Video on Demand (VoD) Market Size is Expected to Grow from USD 38.9 Billion in 2019 to USD 87.1 Billion by 2024, at a Compound Annual Growth Rate (CAGR) of 17.5%,” CISION PRNewswire Press Release, January 28, 2020 available online here; “2017 Global Internet Phenomena,” Sandvine Intelligent Broadband Networks, October 27, 2017 available online here; “What is IPTV? Everything Cord Cutters Need to Know,” AntennaJunkies.com available online here; Luke Bouma, “IPTV Came Under Fire in 2019 & in 2020 It Maybe All Out War,” Cord Cutters News, January 1, 2020 available online here; Luke Bouma, “Dish Officially Announces Legal Action Against Two IPTV Services,” Cord Cutters News, January 19, 2018 available online here; Ali Ahmed Awan, “Understanding the Terms SVOD, AVOD, TVOD and the Difference Between VOD and OTT,” ClipBucket, March 7, 2019 available online here; Dan Price, “The Best Legal IPTV Service Providers in 2019,” MakeUseOf, December 4, 2019 available online here;
Image source: Glenn Carstens-Peters, Unsplash, June 10, 2019 available online here.

International Data Flow

The World Wide Web. A decentralized network of data stored on servers all around the world. But many countries—China, Russia, Germany, and Belgium, to name a few—are enacting laws requiring multinational companies to store and process country-specific data on local servers. According to the source, relaxing such restrictions has become a priority of President Donald Trump’s administration as they negotiate trade agreements, including the upcoming renegotiation of NAFTA.
Proponents of these laws say that having their users’ data stored locally aids in cyber security. Opponents say that storing data on local servers is more expensive, especially for small to medium sized companies. High tech companies worry about having their source codes stolen. Some companies worry that governments or political groups will use the data stored on these servers for illegitimate reasons. And many argue that limiting data flow also limits job growth and innovation. According to Nigel Cory, a trade policy analyst at the Information Technology and Innovation Foundation, “data needs to flow to create value.”

Today’s market size is the estimated value of data flowing through international borders in 2014, according to a report by the McKinsey Global Institute.

Geographic reference: World
Year: 2014
Market size: $2.8 trillion
Sources: Yu, Roger, “More Firms Push Back on Foreign Data Rule,” USA TODAY for the Lansing State Journal, August 13, 2017, page 4B
Original source: Manyika, James, et. al., Digital Globalization: The New Era of Global Flows, McKinsey Global Insitute, February 2016 available online here.
Image source: Geralt, “Binary-hands-keyboard-tap-enter-2372131,” Pixabay, June 2017 available online here.

Audiobooks

According to a July 2016 article in The Wall Street Journal, audiobooks are the fastest-growing format in publishing. From 2014 to 2015, sales increased 20.7 percent and unit sales grew 24.1 percent.

Several factors may have contributed to this increase in sales. First, there are more ways consumers can listen to audiobooks: mobile devices, such as smartphones, smartwatches, and tablets; in-car devices, such as Android Auto and Apple CarPlay; and in-home devices, such as Amazon Echo and Google Home. Second, obtaining audiobooks has become easier. Libraries offer digital downloads of audiobooks as do subscription audiobook services and services such as Apple iTunes and Google Play which allow instant access to whatever the consumer wants to read at that moment. Also, according to Ian Small, CEO of Audiobooks.com, the popularity of podcasting has influenced the millennial generation’s new-found interest in audiobooks.

Today’s market size is the total sales of audiobooks in 2015, 90.4 percent of which is made up of adult titles, with a bit more than three-quarters of that being adult fiction.

Geographic reference: United States
Year: 2015
Market size: $1.77 billion
Sources: Bacon, Beth, “Trending Up: What’s Fueling and Feeding the Audiobook Boom?” DBW, April 11, 2017, available online here; Maloney, Jennifer, “The Fastest-Growing Format in Publishing: Audiobooks,” The Wall Street Journal, July 21, 2016, available online here.
Original source: Audio Publishing Association

Electronic Games

The world of games, electronic games, is changing quickly as mobile devices become an ever more important platform on which they’re played. As a result, one may find estimates of sizes for this market that vary greatly, all depending on how a particular source defines the market. What was once primarily a software business—the making of electronic games to be sold, loaded onto a computer and then played—has become something much broader. Access to the Internet and higher speed connections globally have also fueled the growth in this industry.

Today’s market size is an estimate of total revenues—including all platforms, PCs, smartphones, TV and consoles, tablets, and massively multiplayer online (MMO) games—of the global electronic games market in 2012 and a forecast for revenues in 2016.

Geographic reference: World
Year: 2012 and forecast for 2016
Market size: $66.3 billion and $86.1 billion
Source: Dean Takahashi, “Mobile growth will fuel global game market that hits $86.1B by 2016,” VB Gamebeats, June 6, 2013, available online here.
Original source: Newzoo
Posted on March 31, 2014

Spending on Internet Access

Today’s market size is the amount that was spent in the United States on Internet access in 2005 and in 2012. The increased spending from 2005 to 2012, after inflation, was 154% while the increased penetration of Internet access as a percent of the U.S. population grew by only 19% (from approximately 68% to 81%). Clearly, something other than a rising rate of Internet connectivity in the population is behind the rapidly rising national expenditure on Internet connectivity. The increased expenditure is most likely related to the changing infrastructure used to access the Internet. Users are shifting from dial-up connections to more costly, higher speed connections such as DSL (Digital Subscriber Line), Cable Internet access, Satellite Internet access and mobile broadband via cell phone service.

Geographic reference: United States
Year: 2005 and 2012
Market size: $29.7 billion and $80.7 billion respectively
Sources: (1) “Table 2.4.5 Personal Consumption Expenditures by Type of Product,” National Income and Product Accounts Tables, (NIPA), U.S. Bureau of Economic Analysis, August 7, 2013, available from the BEA web site here. (2) “Percent of Individuals Using the Internet 2000–2012,” ITU, available here.
Original source: U.S. Department of Commerce, Bureau of Economic Analysis, International Telecommunications Union (ITU), Federal Communications Commission (FCC)
Posted on January 14, 2014

Digital Ad Spending

Measuring the world of advertising is tricky and when it comes to how much is spent on digital advertising, the task becomes harder yet. Part of the difficulty has to do with how one defines the market being measured, as is always the case when dealing with market sizes. But, in the case of an industry that is still forming and evolving, definitions are crucial. Clear definitions of what is being measured are not always provided by those reporting on these markets or those reporting on those reports. So use this market size data as a general guide to a market whose boundaries are a bit… fluid.

Today’s market size post is the size of the market for digital advertising based on two estimates of how much will be spent worldwide on digital advertising in 2013. The range presented is made up of the two estimates, sources for which are also provided. Worth noting is the fact that these estimates place spending on digital advertising at around one-fifth of the spending on all advertising.

Geographic reference: World
Year: 2013
Market size: $95 to $117 billion
Source: John Bussey, “When Google Brainstorms, The Online World Shudders,” Wall Street Journal, September 27, 2013, page B1. Michael Sebastian, “Ad Spending Forecast Revised Downward,” AdAge, August 14, 2013, available online here.
Original source: eMarketer and GroupM
Posted on October 9, 2013

Newspapers

Newspapers

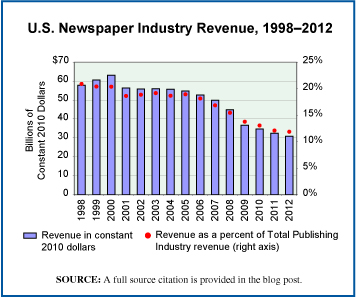
The news this week about The Washington Post being purchased for $250 million by Amazon founder Jeff Bezos made us want to update an earlier post about the newspaper industry, here. And so, we present today’s market size post, including a chart that shows U.S. newspaper industry revenues, annually, since 1998. Clearly, an industry going through significant change.

Geographic reference: United States
Year: 2000 and 2012
Market size: $50.29 billion and $32.04 billion respectively
Source: “Table 3.0.1 Information Sector Services (NAICS 51) — Estimated Revenue for Employer Firms: 1998 Through 2004,” Service Annual Survey, April 2006, page 24, available online here, and annual updates of the same which are available on the Census Bureau’s site here.
Original source: U.S. Census Bureau
Posted on August 9, 2013

Trade Books

The Association of American Publishers (AAP) tracks the sales of its members. It has had an increasingly difficult task in tracking sales over the last decade or so, as the industry deals with dramatic changes in distribution networks (bookstores), in the product itself (print versus digital) and in the rise of self-publishing. The AAP report on 2012 sales shows a 7.4% improvement in the sale of trade books over 2011. Trade books are defined as those intended for general readership and are sold through a general retail outlet—whether fiction or nonfiction, print or e-book, and/or brick-and-mortar stores or online sales. The total value of trade book sales in 2012 was, however, far short of that reached in 2007, the peak year for sales during the first decade of the new century.

Today’s market size is based on the sale of trade books, published by the large and middle-sized American book publishers—AAP members—in 2007 and 2012.

Geographic reference: United States
Year: 2007 and 2012
Market size: $8.53 billion and $6.53 billion respectively
Source: “Today’s Lunch: Weak December Doesn’t Spoil 2012 Trade Gain of 7.4 Percent,” article in the April 11, 2013, Publishers Lunch newsletter. Access to the newsletter’s website is here. The data on 2007 sales comes from “Association of American Publishers 2009 S1 Report — Estimated Book Publishing Industry Net Sales 2002-2009,” available online here.
Original source: Association of American Publishers
Posted on April 12, 2013

Cloud Computing Services

In recent years more and more companies have been putting their data “in the cloud.” There are 625 million subscribers to cloud document storage services. That number is expected to reach 1.3 billion in 2017. Cloud computing service companies allow users to store data on the service provider’s remote servers from which users can access that data from anywhere using Internet-based software and a computer or mobile device. While this can be a cost-saving measure for companies, securing the data on public servers is still a concern. After recent high-profile security breaches at such companies as Nasdaq, LinkedIn, and Twitter, many cloud service companies have invested in tighter security systems for their servers.

Today’s market size data show the amount of revenue from public clouds in 2011 and projected revenue for 2016. Currently, 25% of all business information globally is held on servers that are part of what is referred to as the cloud.

Geographic reference: World
Year: 2011 and a projection for 2016
Market size: $19.4 billion and $206.6 billion respectively
Source: Steve Johnson and Scott Davis, “In the Cloud,” Lansing State Journal, March 24, 2013, pages 1E, 4E.
Posted on April 8, 2013

Instructional Technology

There is a lot of churn going on in the publishing world and the textbook segment of that industry is no different. In fact, it may be experiencing more upheaval and change than is the industry as a whole, though that would be very hard to quantify. Everyone in the publishing trade is adapting to the digital world in one way or another.

Today’s market size focuses on an industry in which eTextbooks are but a small part. The market size comes from a press release about a new market study. The elaborate title of that study is “Global Smart Education & Learning Market Advanced Technologies, Digital Models, Adoption Trends & Worldwide Market Forecast (2012—2017),” a title whose very complexity says a lot about the market being studied. That market, as defined by the study authors, includes far more than eTextbooks. It includes software applications, electronic libraries, curriculum systems, and much more. This market “caters to the needs of national governments and international standard bodies, educators from all streams and from different levels, stakeholders for training and workforce skills.”

Geographic reference: World
Year: 2011
Market size: $73.8 billion, of which, the North American market accounted for approximately 60% of this total revenue.
Source: “Global Smart Education and Learning Market Is Expected to Reach a Value of $220 Billion by 2017, New Report Says,” San Francisco Chronicle, February 13, 2013, available online here.
Original source: Research And Markets
Posted on March 7, 2013

Tablets versus e-Readers

Two relatively new devices in the world of mobile, electronic devices are often compared. They do similar things and yet, they are not the same. These are tablets and e-readers. Because tablets tend to offer more functionality than do e-readers, one of those functions being to serve as an e-Reader, the sales for these devices are often compared. And, in recent years, tablets have been steadily outselling e-readers.

Today’s market size post is the number of tablets and e-readers sold around the world in 2010 and a projection of that market for next year, 2013.

Geographic reference: World
Year: 2010 and 2013 projection
Market size: Tablets: 19 million units and 172 million respectively
Market size: e-Readers: 13 million units and 18 million respectively
Source: Felix Richter, “Are Tablets Killing E-Readers?” Statista.com, July 12, 2012, available online with an interesting chart here.
Original source: IDC, MIC
Posted on December 11, 2012

E-Commerce Writ Large

Sector Pie Chart

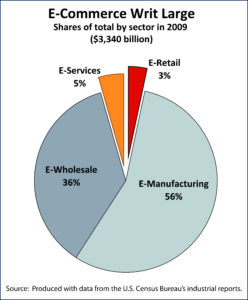
The announcement this week that two large players in the Internet world have made billion dollar plus acquisitions made us think again about e-commerce. It is a term that is used regularly but one suspects that its meaning is somewhat subjective and based on the user’s own concept of the business. E-commerce can be viewed, as it often is, as electronic shopping. Of course, that might more accurately be called e-shopping or e-retail. Commercial exchange is much bigger than that.

By taking the electronically transacted portions of each of the primarily commercial sectors of the economy, we see (in the pie chart) that e-retail makes up only a small share of the more broadly defined e-commerce. E-wholesale and e-manufacturing account for the lion’s share of the total but they are not new and shiny and so attract far less media attention or investor interest.

Even within the retail sector as a whole, e-commerce accounts for just under 5 percent of the whole. That percentage is, of course, growing, and growing rapidly. It is this fact that must be causing companies like Facebook to spend in excess of $1 billion on a company with a popular photo-sharing app (Instagram). Worth noting is the fact that in some retail sectors, e-commerce does play a far larger role than the 5 percent it represents of the sector at large: electronics and books are two such.

Today’s market size numbers measure the size of the U.S. retail sector in the 4th quarter of 2011, and the size of the e-commerce portion of that total.

Geographic reference: United States
Year: 2011, 4th quarter
Market size: Retail, $1.072 trillion, E-commerce: $51.38 billion (4.8% of total retail)
Source: Quarterly Retail E-Commerce Sales, 4th Quarter 2011, U.S. Census Bureau, available online here.
Original source: U.S. Department of Commerce, Bureau of the Census
Posted on April 11, 2012

Cable Programming & Distribution

The U.S. economy is divided into large categories for the purpose of tracking economic activity and the “Information” sector of the economy is where such things as publishing, broadcasting and telecommunications reside. The rise of the digital age is having a major impact on the activities of this sector but for some, it is a very positive impact while for others the transition is more challenging. The cable business is one of the industries in this sector that is seeing robust growth in revenue and over the last five years has shown no sign of slowdown despite the recession and subsequent financial crisis of 2007-2009.

Today’s market size is the size of the U.S. cable program distribution and subscription programming industry in 2005 and 2010. These industries are designated with the following NAICS codes: 5152 (Cable and other subscription programming) and 5175 (Cable and other program distribution).

Geographic reference: United States
Year: 2005 and 2010
Market size: $117.1 and $176.5 billion respectively
Source: “Table 3.0.1 Information Sector (NAICS 51)—Estimated Revenue for Employer Firms: 2005 through 2010,” Service Annual Survey, February 2, 2012, available online here.
Posted on February 27, 2012

Data Loss

That sinking feeling… we have all probably been there, face to face with a computer we count on that has begun to act up. The loss of data resulting from computer hardware failure, software corruption or even human error, is painful and costly. Measuring the loss is a difficult task but one that was undertaken by Dr. David M. Smith and reported on in the article from which we source today’s market size post. A full citation is below.

Specifically, the market size presented here is the estimated annual loss to businesses in the United States due to data losses on PCs and laptops. It dates back to 2003 but it provides us with a scope for the problem and a scope that we know has only grown. For further details, check the source article which defines things clearly.

Geographic reference: United States
Year: 2003
Market size: $18.2 billion
Source: David M. Smith, “The Cost of Lost Data,” Graziadio Business Review, 2003, available online here.
Original source: Graziadio School of Business and Management, Pepperdine University
Posted on December 1, 2011

Compact Discs

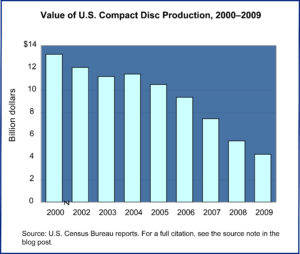
US Production of CDsCompact discs, or CDs, appeared on the recording media scene and rapidly became the standard, demand for them growing in leaps and bounds. But their position as market leader was a passing thing. As digital recording media they are still used but in ever smaller numbers, as the graphic shows. Part of the decline in production is the result of production going overseas. But a shift in how we record and store digital information is the primary cause for the decline of CDs.

Today’s market size is the value of U.S. manufacturer shipments of CDs in 2009. These values refer to blank CDs, to the storage media and not products later sold and distributed on that compact disc media.

Geographic reference: United States
Year: 2009
Market size: $4.27 billion
Source: “Table 1139. Recording Media—Manufacturers Shipments and Value: 2000 to 2009,” Statistical Abstract of the United States: 2011, January 20, 2011, page 716, available online here.
Original source: U.S. Census Bureau

Streaming Video

Netflix and Hulu are two services that allow their customers to stream videos. A March 2011 Nielsen survey found that a majority of Netflix users who stream videos watch them on their TVs through gaming consoles, while a majority of Hulu users stream video on their computers.

Data are the number of videos streamed in the United States in May 2011. This was an all-time high.

Geographic reference: United States
Year: May 2011
Market size: 15 billion videos
Source: The Associated Press, “Half of Netflix Use Done on Consoles,” Lansing State Journal, July 31, 2011, page 4E

Digital Publishing Market

UK books

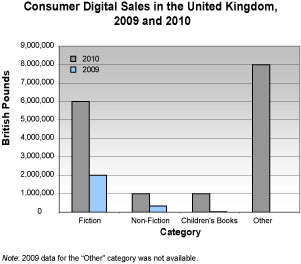
Data show combined digital sales in the United Kingdom, including academic, professional, school, and consumer digital downloads and e-books. Academic and professional digital sales accounted for £84 million. Consumer sales, which includes fiction, non-fiction, and children’s books, were £16 million. Of that £16 million, e-book sales accounted for £13 million. The graph to the right breaks down consumer digital sales by category.

Geographic reference: United Kingdom
Year: 2010
Market size: £120 Million
Source: Philip Jones, “Digital Sales Now Worth 6%, as E-books Grow 300% in 2010,” TheBookseller.com, March 5, 2011 available online.
Original source: Publishers Association