Comics and Graphic Novels in North America

comic books
Geographic reference: North America
Year: 2013, 2016, and 2019
Market size: $870 million, $1.08 billion, and $1.21 billion, respectively

Since 2002, Free Comic Book Day has been held on the first Saturday of May, however, due to COVID-19, the celebration has been moved to August 14th this year. On this day, comic book publishers, both majors and independents, make available for free specially-printed comic books at thousands of local comic shops across North America and the world. Free Comic Book Day was “founded on the belief that for every person out there, there’s a comic book they’ll love.”1

Today’s market size shows total North American revenues for comic books and graphic novels in 2013, 2016, and 2019. From 2013 to 2019 sales trended upward, rising 39.1%. However, not all years saw sales increases. Sales decreased by 6.5% from 2016 to 2017 before rising above 2016 levels in 2018. 

Graphic novels constituted most sales, $765 million or a 63.2% share in 2019. Since at least 2014 graphic novels have grown their share of the market. Comic book sales have been dropping since 2016 while digital comic sales have remained steady throughout this time period.

In 2019 for the first time, graphic novels sold in the book channel outpaced sales of graphic novels in the comic book store channel. The book channel includes chain bookstores, mass merchandisers, major online retailers, and Scholastic book fairs. Sales of children’s graphic novels drove the market. 

Sales of comic books and graphic novels in the book channel claimed 47.1% of the market, comic book stores 43.4%, digital downloads 7.4%, and other channels 2.1% in 2019. Newsstand sales and crowdfunding claimed nearly half of sales in the “other” category. Top comic book publishers by unit share included Marvel Comics (44.72%), DC (30.74%), Image Comics (7.69%), IDW Publishing (3.29%), Boom! Studios (2.42%), Dark Horse Comics (2.33%), Dynamite Entertainment (1.88%), Viz Media (0.55%), Titan Comics (0.49%), and Oni Press (0.43%). Other publishers claimed 5.47% of the market. The top-selling comic book in 2019 was Detective Comics #1000 and the top-selling graphic novel was Watchmen TP.

1 Source: “What is Free Comic Book Day?” Diamond Pop-Culture Network, November 8, 2018 available online here.

Sources: Heidi MacDonald, “Comics and Graphic Novel Sales Top 1.21B in 2019 — The Biggest Year Ever,” The Beat, July 15, 2020 available online here; “What is Free Comic Book Day?” Diamond Pop-Culture Network, November 8, 2018 available online here; Heidi MacDonald, “Comics/GN Sales Up 2.23% in 2019 as Watchmen and Detective Top the Charts,” The Beat, January 10, 2020 available online here;
Image source: tunechick83, “batman-comic-con-comics-books-2216148,” Pixabay, April 11, 2017 available online here.

Book Sales in China

book store in China
Geographic reference: China
Year: 2020
Market size: 97.08 billion yuan

书是随时携带的花园
shū shì suí shí xié dài de huā yuán
A book is like a garden carried in the pocket.
Chinese proverb

Today’s market size shows total book revenues in China in 2020. As many industries suffered revenue losses due to the coronavirus pandemic, so too did the book industry in China. Revenues were down 5.19 billion yuan from 2019, or 5.08%. This was the first time the market declined since tracking began in 2001. By contrast, the market saw double-digit growth each year from 2015 to 2019.

In 2019, 70% of retail book sales took place online, up from 28% in 2012. The first year that online sales overtook brick-and-mortar sales was in 2016. Rising book prices along with larger online discounts offered by publishers have contributed to this trend. Online discounts averaged between 38% and 41% while brick-and-mortar discounts averaged 11%. 

Revenues at physical bookstores have seen mixed results since 2015. Revenue grew in both 2015 and 2017 but declined in all the other years. The declines stayed in the single digits until 2020 when revenues plunged 33.8%. Government shutdowns to prevent the spread of the coronavirus took their toll on brick-and-mortar establishments in China and elsewhere around the world. Online sales growth from 2015 to 2019 had been in the double-digits each year, peaking at 33.2% in 2015. Growth stood at 24.9% in 2019. While online sales continued to grow in 2020, growth slowed dramatically to 7.27%. 

Recently, Chinese publishers have been producing fewer titles as they focus on higher-quality works. In 2019, 194,000 new titles were released, down 6.7% from 2018. In total, more than 505,000 titles were published in China that year. Nonfiction publishers with books ranked in the top 10 of the bestseller list as of November 20201 include Hainan Publishing House, Nan Hai Publishing Co., Beijing Union Publishing Co. Ltd., Wenhui Publishing House, Huaxia Publishing House, CITIC Publishing House Co. Ltd., Human Literature & Art Press, and Jiangsu Literature & Art Press. Fiction publishers with books in the top 10 include Chongqing Publishing House, October Art & Literature Publishing House, Jiangsu Literature & Art Press, Hunan Literature & Art Press, The Writer’s Publishing House, and Beijing Union Publishing Co. Ltd. The top nonfiction book in November 2020 was Educated: A Memoir, by Tara Westover. The fiction book ranked number one was Ordinary Word, by Lu Yao. This book was ranked at number 13 just a month earlier.

1 The last month of available data as of February 2, 2021.

Sources: Porter Anderson, “‘Crisis and Changes’: Insights from Beijing OpenBook Conference,” Publishing Perspectives, January 18, 2021 available online here; Porter Anderson, “China’s Book Market: A 2019 Update From the OpenBook Beijing Conference,” Publishing Perspectives, January 17, 2020 available online here; Porter Anderson, “China Bestsellers: November’s Big Sales Rule the Charts,” Publishing Perspectives, January 5, 2021 available online here; Lai Lin Thomala, “Number of Published Book Titles in China from 2009 to 2019,” Statista, December 29, 2020 available online here; “12 Chinese Sayings on Books,” Chinese 4 Kids, May 16, 2018 available online here.
Image source: Adapted from Cici Hung, “Unnamed Road, Qingpu Qu, Shanghai Shi, China,” Unsplash, August 21, 2019 available online here.

Bookmobiles

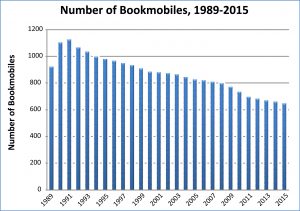
Bookmobiles GraphBookmobiles, mobile libraries in vans, trucks or other large vehicles, reach underserved populations in the community. In many parts of the country, especially in rural, remote areas, people live too far from a library branch to take advantage of its services. In poor neighborhoods, children may not have access to the public library. Their parents may not have time to take them to the library after a long day’s work or may not make reading at home a priority. Seniors in assisted living facilities and nursing homes are two other groups served by bookmobiles. Besides providing books and movies, bookmobiles also provide high-speed internet access to people who may not have access otherwise.

Today’s market size shows the number of bookmobiles in the United States in 1990 and 2015. As the graph above shows (click the graph to see more detail), the number of bookmobiles across the country has been on a steady decline since 1991. When library funding is cut or does not keep up with increasing expenses, many times bookmobiles are one of the first services to go. But some libraries see the advantages in having bookmobiles when budgets are tight. Bookmobiles provide outreach to the community, a “way to reach more patrons and prove their worth … as people become more accustomed to having goods and services delivered to their doors.”1 Some counties in Washington, Oklahoma, New York, Lousiana, and Virginia have added more than one bookmobile in the past decade.

1 Jen Fifield, “Yes, Bookmobiles Are Still a Thing,” The Pew Charitable Trusts, March 28, 2018

Geographic reference: United States
Year: 1990 and 2015
Market size: 1,102 and 647
Sources: “Bookmobiles in the U.S.,” American Library Association available online here; “Table 3. Number of Public Libraries with Branches and Bookmobiles, and Number of Service Outlets, by Type of Outlet and State: Fiscal Year 2015,” Supplementary Tables: Public Libraries Survey Fiscal Year 2015, Insititute of Museum and Library Services, September 2017 available online here; and Jen Fifield, “Yes, Bookmobiles Are Still a Thing. (We Checked),” Stateline, The Pew Charitable Trusts, March 28, 2018 available online here.
Image source: Created in-house using data from the American Library Association and the Institute of Museum and Library Services. Click on the image to see more detail.

Audiobooks

According to a July 2016 article in The Wall Street Journal, audiobooks are the fastest-growing format in publishing. From 2014 to 2015, sales increased 20.7 percent and unit sales grew 24.1 percent.

Several factors may have contributed to this increase in sales. First, there are more ways consumers can listen to audiobooks: mobile devices, such as smartphones, smartwatches, and tablets; in-car devices, such as Android Auto and Apple CarPlay; and in-home devices, such as Amazon Echo and Google Home. Second, obtaining audiobooks has become easier. Libraries offer digital downloads of audiobooks as do subscription audiobook services and services such as Apple iTunes and Google Play which allow instant access to whatever the consumer wants to read at that moment. Also, according to Ian Small, CEO of Audiobooks.com, the popularity of podcasting has influenced the millennial generation’s new-found interest in audiobooks.

Today’s market size is the total sales of audiobooks in 2015, 90.4 percent of which is made up of adult titles, with a bit more than three-quarters of that being adult fiction.

Geographic reference: United States
Year: 2015
Market size: $1.77 billion
Sources: Bacon, Beth, “Trending Up: What’s Fueling and Feeding the Audiobook Boom?” DBW, April 11, 2017, available online here; Maloney, Jennifer, “The Fastest-Growing Format in Publishing: Audiobooks,” The Wall Street Journal, July 21, 2016, available online here.
Original source: Audio Publishing Association

Library Spending

Library-interior

Today’s market size is the dollar amount spent, worldwide, by libraries on content. “Content” in this context refers to all material, physical or digital, purchased by libraries to become a part of their offerings.

Geographic reference: World
Year: 2011 and estimates for 2013
Market size: $23.78 billion and $24.79 billion respectively
Source: Andrew Neilson, “Content Spending by Library Type and Geography, 2011,” The Rise of eBooks: Global eBooks Trends, Elsevier, June 23, 2013, available online here. The photo comes from this website and is an interior shot of the Washington State Library.
Original source: Outsell, Inc.
Posted on February 27, 2014

Independent Bookstores

Bookstores
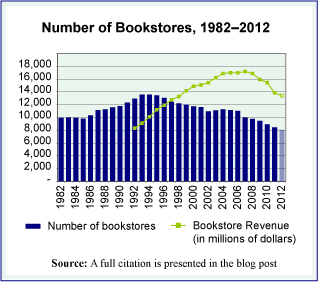
A recent article titled “Independent bookstores turn a new page on brick-and-mortar retailing,” by Michael Rosenwald and published on the Washington Post website, here, grabbed our attention. It appears that after years of shrinking, independent bookstores may have hit bottom. In fact, there are some signs of growth as new independent store openings may be outpacing closures.

As we learned some years ago when we did a study of the publishing industry, getting reliable statistics on the national book retailing industry is not easy. This is in part because it is always difficult to track an industry that is going through significant change and reorganization. The selling of books definitely falls into that category. Over the last two decades it has been a standout in this regard within an entire sector—the retail sector—going through significant change. From the rise and fall of the big bookstore chains such as Borders and Barnes & Noble to e-books, Amazon and the spread of books into a growing number of big box, discount outlets, independent booksellers have seen their share of the business shrink for decades.

The graph we offer shows the total number of bookstores in the United States, annually, over a three-decade period. It also shows industry revenues for the last twenty years of that period. The data charted all come from the U.S. Census Bureau’s reports on the industry and their County Business Patterns database. While total bookstore numbers are available, it is more difficult to tease out of these data the store count by independent bookstores versus the larger stores run by big chains that began to dominate the industry in the 1990s. The graphic fails entirely to capture the rise of e-books and e-commerce. Nonetheless, it provides an overview of the pattern made by the ups and downs of the brick-and-mortar bookstore.

From these overall figures, we can make educated estimates about a few things. By taking data from the Annual Reports of three of the largest bookselling chains, Borders (until 2011), Barnes & Noble, and Books-A-Million, we have calculated the following rough outline of independents versus chains in 2002 and a decade later, in 2012. In 2002, the three largest chains accounted for 21% of all bookstores and 49% of bookstore sales. In 2012, after the bankruptcy of Borders, the remaining two large chains accounted for approximately 20% of the stores and 57% of all the sales made by bookstores.

Today’s market size is the approximate number of independent bookstores and small chain bookstores in the United States in 2012 as well as the value of their sales in that year.

Geographic reference: United States
Year: 2012
Market size: 6,043 bookstores with revenues of approximately $5.76 billion (based on Census data on bookstore sales, less sales by the two largest chains, Barnes & Noble and Books-A-Million)
Sources: (1) Gabe Habash, “Bookstores in America, 2013: A State-by-State Guide, Publishers Weekly, June 1, 2013, available online here. (2) Latest Annual Retail Trade Reports, part of the Census Bureau’s monthly and annual compilation of data on the retail sector, taken from the website here and more specifically, the report titled Annual Retail Trade Survey—2011: Sales (1992-2011) using monthly reports to update the annual figure for 2012.
Original source: U.S. Department of Commerce, Bureau of the Census, the American Booksellers Association, and Publishers Weekly
Posted on December 30, 2013

Paper Consumption

While the use of paper and paper products has not declined significantly—despite much talk in the 1990s of a coming paperless society—the publishing industry is using less paper. According to a new industry report, paper consumption by the book industry declined by 34% from 2006 to 2010, due in part to the great recession and in part to increasing sales of e-books. This information comes from a report whose primary purpose was to track the book publishing industry’s overall environmental impact on the world. Another item highlighted in the report is the increasing quantity of recycled material in the paper that is used by the industry. According to the report, the use of recycled fiber by the book publishing industry rose from 5% of all fiber in 2004 to 24% in 2010.

By way of placing this information in the context of the larger paper industry, it is worth noting that during the period covered in the Book Industry Environmental Trends report, the total value of product shipments made by U.S. Paper and Newsprint Mills dropped by 6.2%, from $45.5 billion in 2006 to $42.7 billion in 2010. In 2006, newsprint represented 7% of the value of all paper mill product shipments and by 2010 that percentage had fallen to 3.6%. But, a discussion of newsprint takes us into a complex niche within the paper market, one we will cover in another post one day soon.

Today’s market size is the volume of paper consumed by the U.S. book industry in 2006 and 2010.

Geographic reference: United States
Year: 2006 and 2010
Market size: 1.76 million tons and 1.16 million tons respectively
Source: Jim Milliot, “Keeping the Green in Publishing,” Publishers Weekly, July 22, 2013, pages 5-6, available online here. The rate of decline in value of output by U.S. Paper and Newsprint Mills was calculated from figures published by the U.S. Census Bureau in its Annual Survey of Manufacturers, (ASM) series of reports, “Value of Product Shipments,” and specifically, data reported under NAICS codes 322121 and 322122. The ASM data are available online here.
Original source: Book Industry Environmental Trends and U.S. Census Bureau
Posted on September 10, 2013

Expenditures on Reading Materials

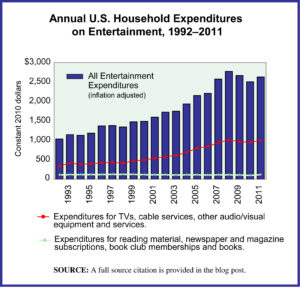
The U.S. Bureau of Labor Statistics (BLS) carries out an annual survey of millions of households to track what they spend money on, by category. The resulting data has been collected over decades and seeing the trends that these data expose over time is very interesting.

The graph presented here is made with BLS data from this survey series. It shows inflation-adjusted household expenditures on all categories of entertainment, as well as two subsets of expenditures, (1) those for TVs, audio/video equipment and services, such as cable subscriptions and (2) expenditures for reading material. The full category of entertainment expenditures is broad and includes things such as:

—Fees to attend concerts, sporting events, movies, and sporting clubs/fraternal organizations.
—TVs, radios and other audio/video equipment as well as subscriptions for cable, premium TV and the like.
—Pets, toys and hobbies, as well as all the services and equipment related to those.
—Bikes, athletic shoes, and equipment for camping, exercising, fishing, and all sports, as well as boats and docking fees, fireworks, pinball machines and video consoles.

Today’s market size is the average spent by U.S. households on reading material in 1994 and in 2011. The figures do not include expenditures for any textbooks or reading material purchased as part of a formal educational program. The transition to digital which is taking place in most areas of publishing is not well tracked by this BLS survey series. It is unclear from studying the survey results, for example, whether or not all online subscriptions to newspapers and magazines are consistently captured in the expenditure category “Reading.” Over time this will change as time allows data collection organizations, like the BLS, to adjust to the digital transition. Data collection organizations can only adjust as quickly as the industries they cover—in this case, the publishing industry—adjust to such dramatic changes.

Geographic reference: United States
Year: 1994 and 2011
Market size: $165 and $115 respectively. These figures translate to a national gross household spending on reading materials for each of those years of $16.86 billion and $14.06 billion respectively
Source: “Consumer Expenditure Survey,” Multiyear Tables: 1992-99 Multiyear Table, 2000-05 Multiyear Table, and 2006-11 Multiyear Table, all available on the Bureau of Labor Statistics website here.
Original source: U.S. Department of Labor, Bureau of Labor Statistics, Consumer Expenditure Surveys
Posted on May 9, 2013

Trade Books

The Association of American Publishers (AAP) tracks the sales of its members. It has had an increasingly difficult task in tracking sales over the last decade or so, as the industry deals with dramatic changes in distribution networks (bookstores), in the product itself (print versus digital) and in the rise of self-publishing. The AAP report on 2012 sales shows a 7.4% improvement in the sale of trade books over 2011. Trade books are defined as those intended for general readership and are sold through a general retail outlet—whether fiction or nonfiction, print or e-book, and/or brick-and-mortar stores or online sales. The total value of trade book sales in 2012 was, however, far short of that reached in 2007, the peak year for sales during the first decade of the new century.

Today’s market size is based on the sale of trade books, published by the large and middle-sized American book publishers—AAP members—in 2007 and 2012.

Geographic reference: United States
Year: 2007 and 2012
Market size: $8.53 billion and $6.53 billion respectively
Source: “Today’s Lunch: Weak December Doesn’t Spoil 2012 Trade Gain of 7.4 Percent,” article in the April 11, 2013, Publishers Lunch newsletter. Access to the newsletter’s website is here. The data on 2007 sales comes from “Association of American Publishers 2009 S1 Report — Estimated Book Publishing Industry Net Sales 2002-2009,” available online here.
Original source: Association of American Publishers
Posted on April 12, 2013

Textbooks

An announcement is expected on Thursday, January 19th, from Apple Corporation having to do with their plans in the area of electronic textbooks. As one might imagine, much attention is being paid to this news by the academic world and the publishing world alike.

Today’s market size is an estimated total value of textbook sales in the United States based on a quote from Steve Jobs in the recently published biography about him by Walter Issacson. A brief look at the Census Bureau’s data on the topic suggests that the estimate is reasonable. The Census Bureau figure is provided here as well.

Geographic reference: United States
Year: 2007 and 2010
Market size: $7.06 billion in 2007 (Census data) and $8 billion (Jobs quote from 2010 which appears in the biography Steve Jobs
Source: “Sector 51: Information: Industry Series: Preliminary Product Lines by Kind of Business for the United States: 2007,” 2007 Economic Census, available here. The Jobs quote is from an article by Roger Yu in USA Today, titled “Technology, Costs, Lack of Appeal Slow E-textbook Adoption,” published on January 16, 2012 and available here.
Original source: U.S. Census Bureau
Posted on January 18, 2012

Digital Publishing Market

UK books

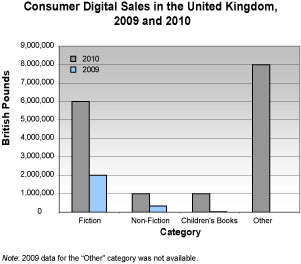
Data show combined digital sales in the United Kingdom, including academic, professional, school, and consumer digital downloads and e-books. Academic and professional digital sales accounted for £84 million. Consumer sales, which includes fiction, non-fiction, and children’s books, were £16 million. Of that £16 million, e-book sales accounted for £13 million. The graph to the right breaks down consumer digital sales by category.

Geographic reference: United Kingdom
Year: 2010
Market size: £120 Million
Source: Philip Jones, “Digital Sales Now Worth 6%, as E-books Grow 300% in 2010,” TheBookseller.com, March 5, 2011 available online.
Original source: Publishers Association

Online Sale of Books & Magazines

One of the industries being most buffeted by the transition to e-commerce is publishing. For decades book publishers have used a network of book retailers as their primary means of getting books to the general public. With the advent of e-commerce this began to change. One can see clearly the speed with which this shift has altered the bookselling landscape. Amazon was started in 1994 and by 2010 it became the largest retailer of books in the United States. The previous book retailing leaders, Barnes & Noble and Borders (which entered bankruptcy reorganization this month) have scrambled to adjust to the new world of selling books while independent booksellers continue to hang on for dear life, declining in number every year as they have since the 1980s with the rise of Barnes & Noble and Borders.

Further complicating this dynamic shifting within the book world is the fact that books and magazines themselves are reasonably easily digitized. This means that the Internet provided a means not only to place orders for books and magazines but to instantly receive them in a digital format. While the shift to e-books is still young—representing less than 9% of the trade book market in 2010—it is a vibrant part of the publishing business and is coloring many of the actions taken by publishers and booksellers alike as they try and adapt to the new realities of the retail landscape for books, magazines, and all printed material.

For anyone interested in more statistics on this subject, we studied it closely last year and have a series of posts on the subject at another of our sites, the Dwarf Planet Press blog site, available here.

Geographic reference: United States
Year: 2003 and 2008
Market size: Sales: $2.06 and $5.14 billion respectively, an increase of 149%.
Source: “Table 1055. Electronic Shopping and Mail-Order Houses—Total and E-Commerce Sales by Merchandise Line,” Statistical Abstract of the United States: 2011, U.S. Census Bureau, page 663, available online here in a spreadsheet format, and here as a PDF file.
One word of clarification to help prevent any confusion about just what is being presented here. The data in the source table are provided in two columns per year, the first one called “Total,” and the second is “E-Commerce”. The column headed “Total” refers to the total sales for the industry “Electronic Shopping and Mail-order Houses,” [NAICS 4541], and the second column is the e-commerce portion of that industry’s total. Do not confuse the “Total” column for a measure of total sales of the product line listed in that row. It is, rather, the total sales of that product line made electronically and through mail-order houses.
Original source: U.S. Department of Commerce, Bureau of the Census.

Book Wholesalers

The distribution network through which books get from the publisher to the reader is one that has been going through enormous change over the last few decades. First, the big box bookstores moved into a space previously occupied by smaller retailers. Then, Amazon got into the business and started serving as both a wholesaler and a retailer, but one without a store front, operating entirely online. Since then, the rise of the electronic book, or e-book, has further altered the way that books make their way to the reader. The landscape for book distribution seems to be in a state of constant change these days, much as the music industry experienced a decade ago. The figures that follow are for the industry designated by the NAICS code 42-4920: Book, Periodical, and Newspaper Merchant Wholesalers.

Geographic reference: United States
Years: 1997, 2002 and 2007
Market size: Number of Establishments: 3,257; 3,464 and 2,789 respectively.
Market size: Sales: $33.63; $30.90 and $28.32 billion respectively.
Market size: Employment: 89,309; 76,072 and 63,511 respectively.
Source: “Sector 42: EC0742I2: Wholesale Trade: Industry Series: Preliminary Comparative Statistics for the United States (2002 NAICS Basis): 2007 and 2002,” 2007 Economic Census, available online here. The data from 1997 are from the 1997 Economic Census.
Original source: U.S. Department of Commerce, Bureau of the Census.

Number of Books in the World

Books as far as the eye can see

This, of course, is a somewhat unusual sort of market size item but it is an actual estimate produced by Google as part of its overall effort to try to digitize every book in existence. For details about how this count was done, what was included and what was not, check the link below to a blog post by a Google engineer involved in the project.

Geographic reference: World
Year: 2010, as of August 5th
Market size: 129,864,880 books
Source: “All the Books in the World,” LOCUS, September 2010, page 11.
Original source: Google. For details, here is a link to a blog post explaining the estimate.

U.S. Book Sales Made Through “Bricks & Mortar” Book Stores

Traditional bricks & mortar book stores have been losing ground in terms of market share of all book sales in the United States for a decade now. While the total volume of books sold is on the rise, those sold by companies that run bricks & mortar book stores have declined from 61.5% in 1997 to 50% in 2007. The rise of Amazon to prominence in the book selling market is, of course, a significant reason for this shift. Traditional booksellers are working hard to recapture their prominence in the retailing of books by establishing complex networks for selling electronically and selling eBooks.

Geographic reference: United States
Year: 1997 and 2007
Market size: $9.71 billion and $12.33 billion respectively
Source: 1997 Economic Census: Sector 44: Retail Trade: Merchandise Line Sales: Merchandise Lines by Kind of Business and 2007 Economic Census: Sector 44: Retail Trade: Merchandise Line Sales: Merchandise Lines by Kind of Business for the United States: 2007, October 30, 2009. The 1997 data is available online here and the 2007 data is available online here. The September 3, 2010 Dwarf Planet Press blog post presents these Census Bureau data in a summarized fashion. Here’s a link to that post.
Original source: U.S. Bureau of the Census

Market for Books, Print Books

When it comes to sales growth rates, completely new products have a vast advantage over mature products. Within the book business, eBooks are the new thing right now. As the sale of eBooks continue to rise quickly, many wonder what impact they will have on the sale of printed books. The market sizes listed here are for print books, pBooks if you will, and do not include eBook or audiobook sales.

Geographic reference: United States
Year: 2003 and 2009
Market size: $22.2 billion and $23.4 billion respectively
Source: Association of American Publishers, 2009 S1 Report, February 2010, page 2 available online here.
Original source: AAP and Management Practice

Market for eBooks… thus far

When it comes to sales growth rates, completely new products have a vast advantage over mature products. Within the book business, eBooks are the new thing right now. As the publishing world races to keep up with the faster moving high technology world and its eReader offerings, the market for eBooks will likely show continued rapid growth over the next decade.

Geographic reference: United States
Year: 2003 and 2009
Market size: $19.7 million and $313.2 million respectively
Source: Association of American Publishers, 2009 S1 Report, February 2010, page 2 available online here.
Original source: AAP and Management Practice

Graphic Novels, Manga and Comic Books

GraphicNovelImage

The market for what is now referred to broadly as “graphic novels” has grown strongly since 2000. Many factors contribute to this growth including such things as an explosive growth in the number of unique book titles published annually, the success of super hero movies, and a growing influence from the comic arts scenes in other countries where it has been a strong cultural outlet. In terms of revenue produced by the sales of these graphic products, market share breaks down by category as follows: comic periodicals, 27.5%; Manga, 12.4%, and other graphic novels, 60.2%.

Geographic reference: United States
Year: 2009
Market size: 3,162 unique titles and $1.130 billion sales
Source: Publishers Weekly, April 26, 2010, page 12
Original source: ICV2.com

Size of the Independent Bookseller Market

The data show the number of independent booksellers in the United States according to the American Booksellers Association.

Geographic reference: United States
Year: 1999 and 2010
Market size: 3,250 and 1,400 respectively
Source: Ken Auletta, “Publish or Perish: Can the iPad Topple the Kindle, and Save the Book Business?” The New Yorker, April 26, 2010, pages 24-31
Original source: American Booksellers Association