Student Loan Debt

Today’s market size is the amount owed in the United States for loans taken to finance higher education. The figures, which come from reports produced by the Federal Reserve Banking system, appear in an interesting article about the opportunity costs of having a large part of the younger generation beginning its productive life carrying a significant debt load. This fact may begin to explain the decline in first-time home purchases as well as declining numbers of new business start-up, two activities that require a population with more debt capacity than young people in the United Sates have these days.

Geographic reference: United States
Year: 2003 and 2013
Market size: $300 billion and $1.1 trillion respectively
Source: Phyllis Korkki, “Ripple Effects From Rising Student Debt,” The New York Times, May 25, 2014, pages B6.
Original source: Professor Brent W. Ambrose of Pennsylvania State University and Larry Cordell and Shuwei Ma of the Federal Reserve Bank of Philadelphia.
Posted on May 30, 2014

Public Pensions

Large pension plans have been struggling, in a period of very low interest rates since the financial crisis of 2008, to balance their asset allocation in such a way as to maximize returns. Assumptions have been made for many years now about what the average return on investment should be for public pension funds. The money going into these pension funds has been calculated accordingly. But, it turns out that the assumed annual rates of return (between 7% and 8%) have been quite optimistic. If the funds do not generate the anticipated annual returns, then more must be put into them if they are to meet their obligations to retirees. Over the ten year period 2002–2012, the public pension plans run by U.S. states have had an average annual rate of return of 6.4%.

Today’s market size is the value of all public pension assets in the United States in 2012.

Geographic reference: United States
Year: 2012
Market size: $2.6 trillion, approximately 16% of the total of all assets allocated for pensions, public and private, not including Social Security System funds
Sources: (1) Gretchen Morgenson, “How You Can Pay Millions and Lag Behind the Market,” The New York Times, October 20, 2013, B1. (2) Cliffwater 2013 Report on State Pension Performance and Trends, July 22, 2013, available here.
Original source: Cliffwater and data filed by each state in what is known as the Comprehensive Annual Financial Report (CAFR)
Posted on October 21, 2013

I.R.A. Money

Over the last several decades significant changes have been made to how the majority of people in the United States save for retirement. Getting reliable statistics on the topic, covering several decades, is difficult because of the very structural changes which have occurred in the ways that we save for retirement. The sort of pension plans that used to be regularly offered by large companies—plans in which an employee was promised a defined monthly payout after retirement—are fast disappearing in favor of hybrid plans that offer employees a framework in which they are the primary if not only investors, thus 401(k) and other similar plans. To illustrate the speed of change in this rush away from traditional pension plans, a glimpse at the coverage offered by the largest of firms, those most likely to offer such plans. In 1998, 90% of the companies in the Fortune 100 provided their new employees with a traditional pension. In 2012, that number had fallen to 30%.

In the absence of more traditional pension plans, many people are establishing independent retirement accounts or I.R.A.s to help them save for retirement. Today’s market size is the value of all money invested in an I.R.A. account in the United States as of October 31, 2012. Worth noting is the fact that this balance is higher than the balances of all the other retirement investment categories, such as 401(k) and 403(b) plans (with a balance of $5 trillion) or government employee retirement plans ($4.8 trillion) or the traditional pension plans offered by private sector employers ($2.6 trillion).

In looking at this market, please note that people often roll money into an I.R.A. account from funds in an employer-sponsored retirement plan when terminating employment with that company. These often large sums are part of the market being looked at here. Complicating matters further is the fact that there are oddities in the rules defining how investments are made into I.R.A.s, oddities which allow for more… creative investments in I.R.A.s by some. An extreme example of this came to light last summer, during the presidential campaign, when it was reported that candidate Romney’s I.R.A. account was valued at around $100 million. Since there are limits on how much may be contributed annually to such an account, speculation about the Romney I.R.A. balance ran rampant. But, for our purposes here, it is enough to say that the total balance invested in I.R.A. accounts includes such… anomalies. So, to put this national I.R.A. account balance into perspective, let us add that as of May 2011, 38.8% of all U.S. households had some sort of I.R.A. account. Furthermore, the I.R.A. balance of the median American family that did have an I.R.A. account in 2011 was $42,500.

Geographic reference: United States
Year: October 31, 2012
Market size: $5.3 trillion
Source: Ron Lieber, “Finding Advice for More Modest Retirement Investments,” The New York Times, January 19, 2013, page B1. Emily Brandon, “Top Companies Continue to Drop Pensions,” U.S. News & World Report, the Money section, available online here. William D. Cohan, “The Secret Behind Romney’s Magical IRA,” Bloomberg News, July 15, 2012, available online here.
Original source: Investment Company Institute, Towers Watson
Posted on January 24, 2013

Co-ops

Interest in cooperatives is on the rise as people look to community-rooted alternatives to the dominance of huge, global banks, enormous retailing giants with little link to the local community, and empty main street store fronts. Cooperatives, or co-ops, are nonprofit businesses of various types such as credit unions and stores. These co-ops are created when members pool money in order to set up, manage and run the organizations on behalf of their members. Today’s market size is the estimated number of such cooperatives in the United States and the estimated value of the revenue they generate annually as of 2010.

Geographic reference: United States
Year: Forecast for 2010
Market size: 29,000 Co-ops generating $654 billion in revenues
Source: Amy Cortese, “Buying Underwear, Along With the Whole Store,” The New York Times, November 13, 2011, page B1, available online here.
Original source: University of Wisconsin
Posted on November 14, 2011

Collection Agencies

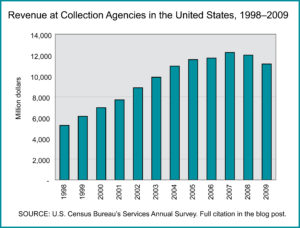
Collection Agencies, estimated revenue annually

Today’s market size post looks at collection agencies. You may be forgiven for assuming that collection agencies are in a recession-proof sort of business. From the looks of the national data on that industry, this is not entirely true. The graph shows estimated annual revenue for collection agencies over more than a decade.

Geographic reference: United States
Year: 1999 and 2009
Market size: $6.10 billion and $11.14 billion
Source: “Table 7.1. Administrative and Support and Waste Management and Remediation Services (NAICS 56) — Estimated Revenue for Employer Firms: 2002 Through 2009,” Service Annual Survey: 2010, parts of which are available online here. Data for years prior to 2002 were obtained from earlier editions of the Service Annual Survey, many of which are also available from the Census Bureau’s websites.
Original source: U.S. Census Bureau
Posted on November 2, 2011

Derivatives

Congressional attempts to regulate the market for derivatives is bringing this market into the news again. Until the financial crash of 2008 the derivatives market was well below the radar of most people. As the financial crisis unfolded we learned how the market for derivatives had been taken over by financial speculators and financial institutions using them in… innovative ways, turning them into something quite different from what they had been for more than a century.

In a perfect world, derivatives—an agreement between two parties about an exchange in which the price of the item being exchanged is derived from the value of an underlying asset—are used, for example, by a manufacturer to lock in the otherwise widely fluctuating price of a commodity that it buys regularly. When used this way, derivatives are a sort of insurance against volatility, a so-called hedge against risk. Things get more complicated when this sort of insurance is purchased by somebody that doesn’t actually own the insured asset and that is where we enter the world of speculation which has become a large part of the derivatives market during the last two decades.

Geographic reference: World
Year: 2010
Market size: $600 trillion
Source: Aaron M. Kessler, “Carmakers Fear Restrictions of Wall Street Reform,” September 22, 2011, Detroit Free Press, page B1.
Posted on September 22, 2011

Home Equity Lines of Credit

Home equity lines of credit, also known as second liens, are part of the overall financial sector and part of the troubled housing sector as well. The bursting of the housing bubble in early 2008 started what became a worldwide financial crisis which is still destabilizing financial markets around the globe to this day. The housing market in the United States is still very unstable with an estimated 23% of mortgage holders owing more on their mortgages than the current value of the asset for which the loan was acquired (e.g. they are underwater). Of mortgaged properties that are underwater, approximately 40% also carry a home equity line of credit worth an average per property of $65,000. We should expect to see continued write-downs within the banking industry related to the housing crisis for some time to come.

Today’s market size is the value of bank holdings in home equity loans as of the first quarter of 2011.

Geographic reference: United States
Year: First quarter of 2011
Market size: $624 billion
Source: Gretchen Morgenson, “2nd Loan, 2nd Wave of Losses,”, The New York Times, July 17, 2011, page B1.

Time Banks

In the 1980s while at the London School of Economics and Political Science, Dr. Edgar S. Cahn, a civil rights lawyer and activist, conceived the time banking system, a modern-day bartering system. For each hour members provide services to other members, they are credited with one hour of time that they can then use to request services from other members. Cahn came back to the United States to implement his idea and time banks popped up all across the USA in inner city neighborhoods over the next decade.

Soon Japan took interest and by the mid-1990s interest was building in the United Kingdom. The first time bank in the United Kingdom was started in 1998. According to TimeBanking UK, there are currently hundreds of time banks—although in a modified version from what Cahn conceived—operating in Japan. In the United Kingdom there are 105 active time banks and 131 in development. Since then, time banking has become popular in many more countries.

The market size presented below represents the number of time banks in the United States that are members of TimeBanks USA (founded by Edgar S. Cahn) and the MI Alliance of Timebanks.

Geographic reference: United States
Year: 2011
Market size: 92
Source: “TimeBanks USA Member Directory,” TimeBanks USA, available online here; “TimeBanks throughout Michigan,” MI Alliance of Timebanks, available online here; “About > History,” TimeBanking UK, available online here; “About Time Banking UK,” TimeBanking UK, available online here; “‘TimeBanks’ Sprouting Up in Metro Detroit,” CBS Detroit, June 22, 2011, available online here.

Reverse Mortgages

A reverse mortgage is a loan mechanism that allows the owner of a home to borrow against the value of that home. This is done while the homeowner and borrower continues to live in the home, maintains the home and pays the taxes owed on the home and property. To qualify for such a loan the borrower must be at least 62 years of age.

While the first reverse mortgage established in the United States purportedly dates back to 1961 it was the housing bubble of the last decade that brought this form of lending to the public’s attention. And, as with so many things that blossomed during the distortions of the real estate bubble, the bloom is off the rose of reverse mortgages. The two largest providers of reverse mortgages exited the business during 2011.

Today’s market size is the dollar volume of the reverse mortgage business in the United States in 2001 and 2010. Worth noting is the fact that while these two points in time show a significant increase in this business, the peak came in 2009.

Geographic reference: United States
Year: 2001 and 2010
Market size: $0.5 and $10.3 billion respectively
Source: Tara Siegel Bernard, “2 Big Banks Exit Reverse Mortgage Business,” The New York Times, June 18, 2011, page B1, available online here.
Original source: Reverse Market Insight

Student Loan Debt

The cost of a higher education has been rising for decades. According to an interesting article on this subject in EconSouth, the Federal Reserve Bank of Atlanta’s quarterly journal, students at four-year colleges and universities paid a national average of between $20,000 and $40,000 last year for tuition, books, and room and board. This range covers a great deal of variation based on geography and type of institution—public or private. It is the average for students living on campus and enrolled in a four-year degree program.

It costs a lot to get a degree these days and this cost is being paid by more people taking on greater and greater levels of debt. Today’s market size is the total debt outstanding, nationally, for student loans. This figure exceeded, for the first time ever in 2010, the national total debt outstanding for revolving credit.

Geographic reference: United States
Year: 2010
Market size: $829.79 billion
Source: “Cap in Hand—The High Price of Higher Education,” EconSouth, first quarter 2011, page 8.
Source: Federal Reserve Bank of Atlanta, College Board, and FinAid.org

Gold Bars

A National Geographic journalist, while on assignment for the journal, was given a tour of the vast Paris underground, a maze of structures excavated over the years at various levels under the surface of the Earth. Gold Bars It consists of old crypts, used and unused sewer lines, metro train tunnels, the empty quarries from which much of the stone used to build the city was extracted, and heavily fortified vaults under banks and museums. The journalist and author of the source article, Neil Shae, and his colleague, photographer, Stephen Alvarez, were taken into the vault under the Banque de France and shown the French national gold reserves which are kept there in piles and piles of gold bars, each valued at around $500,000.

Geographic reference: France
Year: 2010
Market size: Approximately 2,600 tons.
Based on the price of gold on the international market on January 28, 2011, the approximate value of the gold bars under the Banque de France is $120.1 billion.
Source: “Under Paris,” National Geographic, February 2011, page 124. The image of gold bars we use here comes from a Banque de France Annual Report, available online here.
Original source: Banque de France

Mortgage Debt Nationally

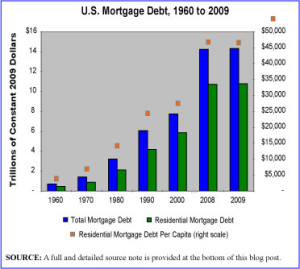
Mortgage Debt Nationally, 1960 to 2009

It should not come as a surprise to see that the U.S. has dramatically increased its national, total mortgage debt over the last few decades and in particular over the last decade. The graphic presented here shows the increase in national mortgage debt from 1960 to 2009. The most striking leaps in indebtedness are seen in the period since 2000. While not surprising since we all now understand that the last decade was indelibly marked by a housing bubble, it is sobering to see just how high that debt really is, well after the bubble has burst.

The graphic depicts inflation-adjusted dollars so what we see here is the increase in mortgage debt AFTER INFLATION. Just for fun, the graphic also shows—with an orange dot per year—residential mortgage debt on a per capita basis, using the right scale on the chart. We are certainly an indebted people.

Geographic reference: United States
Year: 2009
Market size: $14.3 trillion, of which $10.8 trillion is residential mortgage debt as opposed to commercial or agricultural mortgage debt.
Source: “Table 1191 — Mortgage Debt Outstanding by Type of Property Holder: 1952–2009,” Statistical Abstract of the United States: 2011, available online here.
Original source: Board of Governors of the Federal Reserve System, “Federal Reserve Statistical Release, Z.1, Flow of Funds Accounts of the United States,” March 2010, available online here.
Full source note for graphic: “Table 1191 — Mortgage Debt Outstanding by Type of Property Holder: 1952–2009,” Statistical Abstract of the United States: 2011; Population data 1960-1970: “No. HS-1. Population: 1900-2002,” available online here; Population data 1980-2009: “Table 7. Resident Population by Sex and Age: 1980 to 2009,” Statistical Abstract of the United States: 2011, page 11 available online here. The price deflator series used to convert current dollars to constant 2009 dollars came from two spreadsheets. For 1960: “Table 7.14. Chain-Type Quantity and Price Indexes for Gross Domestic Product by Sector,” Bureau of Economic Analysis, February 28, 2003 available online here; For 1970-2009: “Table B-6. —Chain-type quantity indexes for gross domestic product, 1962-2010,” Economic Report of the President: 2011 Spreadsheet Tables, U.S. Government Printing Office, available online here.