Video on Demand

video on demand streaming
Video on demand is a method of media distribution in which viewers can access a provider’s library of video content with or without a television set and without the constraints of a static broadcasting schedule as is the case with over-the-air programming. Video on demand can be offered through internet protocol television (IPTV) services or through over-the-top (OTT) media services. IPTV uses a dedicated, private network provided by an internet service provider to stream live television, pay-per-view, and video on demand content over the internet through a set-top box or “stick” device connected to a customer’s television or directly through an app on a smart TV that has wi-fi capabilities. IPTV content can also be viewed using apps on tablets and smartphones and on computers through a web browser or through video applications that can play M3U8 files. As of April 2019, there were an estimated 100 million IPTV subscribers worldwide.

While there are many legal IPTV providers such as Sling TV, Xfinity Flex, DirecTV Now, AT&T U-verse and Zattoo, to name a few, there are also many companies that provide content they are not licensed to sell. According to a 2017 Sandvine Intelligent Broadband Networks study, 6.5% of North American households have accessed a pirated IPTV service. Pirated IPTV services were valued at $840 million per year while traditional content providers lost $4.2 billion per year due to copyright infringement. In recent years, content providers have filed lawsuits against IPTV providers that transmit unauthorized content. In 2019, Set TV NOW, with more than 180,000 subscribers, was the first major IPTV provider to shut down. The judge ordered the company to pay DISH Network Corp. more than $90 million in damages. In November 2019, police raids in Spain, Italy, the Netherlands, France, and Bulgaria shut down Xstream-codes.com, a company that provided the software that ran many IPTV systems. Its 5,000 clients, IPTV providers, served more than 50 million customers around the world. In 2020, more lawsuits against these types of companies are expected in the United States and around the world. Lawsuits against companies that make the services possible such as website hosting companies, file hosting companies, and companies that process the payments are also expected.

OTT services use the open internet to stream their video on demand content. A customer’s internet service provider treats data packets for streamed content the same as data packets for any other content sent over the internet. As a result, the quality of the viewing experience depends on the speed and quality of the customer’s internet connection. Customers need either a set-top box, “stick” device, multipurpose device like a game console that can stream video content, or a wi-fi enabled smart TV to view content on their television sets. OTT content can also be viewed on computers, tablets, and smartphones.

There are three types of OTT services: advertising-based (AVOD), transaction-based (TVOD), and subscription-based (SVOD). Advertising-based services are free to use, but customers must watch commercials like they do when they watch over-the-air, cable or satellite TV. YouTube and DailyMotion are examples of AVOD services. Transaction-based services allow users to sign up for the service for free and then the amount they pay is dependent on the content they watch. iTunes is an example of a TVOD service. Subscription-based video on demand services may be the best-known type of OTT. A user pays a monthly or yearly fee to stream an unlimited amount of video content. Netflix and Hulu are two examples of subscription-based OTT services.

Today’s market size shows the total global revenues for video on demand services for 2019 and projected for 2024. OTT services have the highest market share with subscription-based service revenue expected to grow at the highest compound annual growth rate (CAGR) over this time period. Overall, the global video on demand market is expected to grow at a CAGR of 17.5%. According to analysts, growth in this industry will be due to increasing broadband internet access globally, including access to 4G and 5G technologies, and the increasing popularity of smartphones. Services that offer a large variety of content in different genres and languages will also contribute to growth in this industry. North America is expected to account for 40% of the revenue between 2019 and 2024, with the Asia-Pacific region claiming 30%, Europe 20%, Latin America 5% and the Middle East and Africa 5%. Leading companies include Netflix, Amazon, Google, YouTube, Apple, Roku, Vudu, Hulu, Huawei, and Fujitsu among others. In the Asia-Pacific region the following companies are expected to capture most of the market share: YouTube, iQiyi, Tencent Video, Youku, ByteDance, Netflix, Amazon, Hotstar, and Hulu Japan.

Geographic reference: World
Year: 2019 and 2024
Market size: $38.4 billion and $87.1 billion, respectively
Sources: The Video on Demand (VoD) Market Size is Expected to Grow from USD 38.9 Billion in 2019 to USD 87.1 Billion by 2024, at a Compound Annual Growth Rate (CAGR) of 17.5%,” CISION PRNewswire Press Release, January 28, 2020 available online here; “2017 Global Internet Phenomena,” Sandvine Intelligent Broadband Networks, October 27, 2017 available online here; “What is IPTV? Everything Cord Cutters Need to Know,” AntennaJunkies.com available online here; Luke Bouma, “IPTV Came Under Fire in 2019 & in 2020 It Maybe All Out War,” Cord Cutters News, January 1, 2020 available online here; Luke Bouma, “Dish Officially Announces Legal Action Against Two IPTV Services,” Cord Cutters News, January 19, 2018 available online here; Ali Ahmed Awan, “Understanding the Terms SVOD, AVOD, TVOD and the Difference Between VOD and OTT,” ClipBucket, March 7, 2019 available online here; Dan Price, “The Best Legal IPTV Service Providers in 2019,” MakeUseOf, December 4, 2019 available online here;
Image source: Glenn Carstens-Peters, Unsplash, June 10, 2019 available online here.

Wireless Speakers Enabled by Personal Assistants

Amazon Echo and Google Home are two versions of wireless speakers that do more than play music. They are also voice-activated personal assistants. Some of their capabilities include adjusting a smart thermostat, turning lights on or off, arranging a ride through Uber, and delivering the news, sports, and weather. As prices have come down for these devices, in some cases retailing for less than $50, popularity has risen.

Today’s market size is the value of the market for voice-activated wireless speakers/personal assistants in 2015 and the projected value of the market in 2020 according to Gartner. The value of the market is expected to increase more than 5-fold in this 5-year period.

Geographic reference: World
Year: 2015 and projection for 2020
Market size: $360 million and a projected $2.1 billion respectively
Source: Ed Baig, “Google Home Plays Catch-Up to Echo, with Promise,” USA Today for the Lansing State Journal, November 6, 2016, page 6B
Original source: Gartner.

Expenditures on Reading Materials

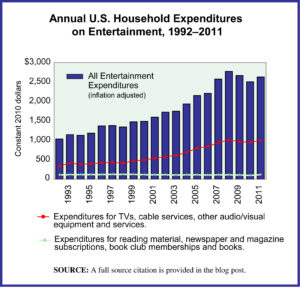
The U.S. Bureau of Labor Statistics (BLS) carries out an annual survey of millions of households to track what they spend money on, by category. The resulting data has been collected over decades and seeing the trends that these data expose over time is very interesting.

The graph presented here is made with BLS data from this survey series. It shows inflation-adjusted household expenditures on all categories of entertainment, as well as two subsets of expenditures, (1) those for TVs, audio/video equipment and services, such as cable subscriptions and (2) expenditures for reading material. The full category of entertainment expenditures is broad and includes things such as:

—Fees to attend concerts, sporting events, movies, and sporting clubs/fraternal organizations.
—TVs, radios and other audio/video equipment as well as subscriptions for cable, premium TV and the like.
—Pets, toys and hobbies, as well as all the services and equipment related to those.
—Bikes, athletic shoes, and equipment for camping, exercising, fishing, and all sports, as well as boats and docking fees, fireworks, pinball machines and video consoles.

Today’s market size is the average spent by U.S. households on reading material in 1994 and in 2011. The figures do not include expenditures for any textbooks or reading material purchased as part of a formal educational program. The transition to digital which is taking place in most areas of publishing is not well tracked by this BLS survey series. It is unclear from studying the survey results, for example, whether or not all online subscriptions to newspapers and magazines are consistently captured in the expenditure category “Reading.” Over time this will change as time allows data collection organizations, like the BLS, to adjust to the digital transition. Data collection organizations can only adjust as quickly as the industries they cover—in this case, the publishing industry—adjust to such dramatic changes.

Geographic reference: United States
Year: 1994 and 2011
Market size: $165 and $115 respectively. These figures translate to a national gross household spending on reading materials for each of those years of $16.86 billion and $14.06 billion respectively
Source: “Consumer Expenditure Survey,” Multiyear Tables: 1992-99 Multiyear Table, 2000-05 Multiyear Table, and 2006-11 Multiyear Table, all available on the Bureau of Labor Statistics website here.
Original source: U.S. Department of Labor, Bureau of Labor Statistics, Consumer Expenditure Surveys
Posted on May 9, 2013

Electronics Stores

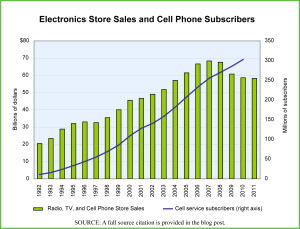
Our graph from Census Bureau data

While working on an analysis of the retail and wholesale sectors of the U.S. economy, a somewhat surprising thing emerged. The four fastest growing categories of brick-and-mortar stores, based on annual growth rates from 1992–2010 were: (1) Used Car Dealerships, (2) Health and Personal Care Stores, (3) Pharmacies and, (4) Radio, TV, and Other Electronics Stores. The last of these surprised us a bit, given the fact that such a large portion of the sale of electronics has moved online and the fact that the demise of a prominent player in the sector, Circuit City, seems pretty fresh in the mind.

As it turns out, the important trend behind the strength of this retail sector is the rise of cell phones and all the new cell phone stores that one sees in shopping centers and strip malls across the United States. Cell phone stores are part of the category “Radio, Television and Other Electronics Stores” (NAICS 443112), the fastest growing sector in the overall Electronics and Appliance Retail industry (NAICS 443).

The graph shows annual sales from Radio, TV, and Cell Phone Stores in the United States from 1992–2011 and cell phone subscription figures for the period 1992–2010.

Geographic reference: United States
Year: 1992 and 2011
Market size: $20.5 billion and $58.3 billion respectively
Source: Annual Retail Trade Survey 2010, with updates from the Monthly Retail Trade Report series, available online here. The cell phone subscriber data are from the Statistical Abstract of the United States 2012, Table 1149, available from here.
Original source: U.S. Department of Commerce, Bureau of the Census
Posted on August 21, 2012

Headphone Market

The arrival of a new, high-end, expensive and very fashionable headphone has stirred up the market for headphones. Headphones are a reasonably mature product segment which was infused with energy over recent years by earbuds that are commonly used with MP3 players of all sorts as well as cell phones and other small recording devices. But it was the arrival on the scene of the headphone, Beats by Dr. Dre, that reinvigorated the market most recently, the sales of which account for nearly a quarter of the market size listed below. Celebrity meets audio equipment and the market expands. Increased hearing loss in adolescents may be part of the unseen price being paid.

Geographic reference: United States
Year: 2011
Market size: $2 billion
Source: “Headphones With Swagger (and Lots of Bass),” The New York Times, Sunday, November 20, 2011, page B1, available online here. Also, “One in Five U.S. Adolescents Has Hearing Loss, Researchers Find,”
Bloomberg.com, August 17, 2010, available online here.
Original source: NPD Group and Journal of the American Medical Association
Posted on November 21, 2011