Auto Repair Services

Several of us here have had reason lately to make large payments to auto mechanics. This, combined with the level of business apparent at our various auto repair shops, led us to wonder if businesses that do automotive repair and maintenance work were perhaps recovering more quickly from the great recession than other businesses in the service sector.

The future looks bright for automotive repair shops as the median age of automobiles in the United States continues to climb. According to a study by R.L. Polk Company, the median age of automobiles on the road in the United States grew 44% between 1990 and 2008, from 6.5 years to 9.4 years. And these median age figures do not include the changes that resulted in the aftermath of the 2008 financial crisis which had a devastating impact on new vehicle sales. Demand for automotive repair will only increase as the age of the fleet increases.

Today’s market size is based on the estimated revenue of all automotive repair and maintenance firms in the U.S. in 2001 and 2010. Worth noting, these revenue figures are for firms defined by the source as “employer firms,” and thus do not include all those involved in doing repair work on their own or on the side.

Geographic reference: United States
Year: 2001 and 2010
Market size: $76,518 million and $83,714 million respectively
Source: Yearbook 2010, “Table 10.1 Other Services (Except Public Administration, Religious, Labor, and Political Organizations, and Private Households) (NAICS 81) – Estimated Revenue for Employer Firms: 2001 through 2009,” Service Annual Survey 2009, page 198, issued in February 2011 and available online here. Preliminary data for 2010 are from early released reports from the Service Annual Survey 2010.
Original source: U.S. Department of Commerce, Economics and Statistics Administration, U.S. Census Bureau

Freight by Rail

Moving large volumes of freight over long distances is an energy intensive proposal and something we do very regularly these days. In fact, with the rise of globalization humanity is now moving more over greater distances than ever before. Moving cargo by rail is the second most efficient means of transporting it—the first being transport over water. Coal is the commodity whose movement on railroads accounts for the largest percentage of tonnage moved by Class I Railroad operators in the United States (44%) and the largest percentage of gross revenue, when divided out by commodity type, for these operators (24%).

Today’s market size is the tonnage carried by U.S. Class I Railroads in 2010 and the value of the corresponding gross revenue earned for their transportation. The revenue number does not adjust for such things as incentive rebates offered by the railroad operators. U.S. Class I Railroads in 2010 were the following: BNSF Railway, CSX Transportation, Grand Trunk Corporation, Kansas City Southern Railway, Norfolk Southern Combined Railroad Subsidiaries, Soo Line Corporation, and Union Pacific Railroad.

Geographic reference: United States
Year: 2010
Market size: 1.85 billion tons and $57.44 billion in gross revenues
Source: “Class I Railroad Statistics,” June 17, 2011, a report produced by the Policy and Economics Department of the Association of American Railroads. Here is a link to the report.
Original source: Association of American Railroads

Public Transportation in Detroit, Michigan

In 1945, public transportation in Detroit consisted of 22 streetcar lines. The last streetcar line stopped operation in April 1956. By 2010, public transportation in Detroit consisted of 48 bus routes serving Detroit and 22 surrounding communities. Data show the annual number of passengers that rode these forms of public transportation in the city.

Detroit is known as the home of the auto industry and as such has never been a strong proponent of mass transit. Furthermore, and worth noting in this context, is the fact that in 1945 the City of Detroit had a population of approximately 1,736,000 and in 2010 its population was less than half this number (715,000). Is the shrinking of this once major U.S. city in any way related to its lack of mass transit offerings? That is a question we can not answer in this brief little blog but it is food for thought.

Geographic reference: Detroit, Michigan
Year: 1945 and 2010
Market size: Nearly 500 million and less than 40 million respectively
Source: Doug McInnis, “Talk of the Town: Midtown Detroit Undergoes an Economic Revival,” Wayne State, July 2011, pages 10-19; “DDOT FAQ’s,” available online here.
Original source: 1945 data compiled by the late transit historian Jack Schramm.
Posted on August 2, 2011

Bicycle Share Systems

“When I see an adult on a bicycle, I do not despair for the future of the human race.” — H.G. Wells

Bicycle sharing is a system in which bicycle stations are set up at various places around a city. Each station can have tens, hundreds, or thousands of bicycles for rent, depending on demand. Customers rent the bicycles by the hour or by the day and then return them to the nearest bicycle sharing station.

These bicycle sharing systems are currently much more popular in major European cities than they are in cities in the Americas. However, the United States outranks any other country when it comes to bicycle sharing systems on college and university campuses with 24 such systems nationwide. Mexico, Philippines, and the United Kingdom are the only other countries with bicycle sharing systems on college campuses, each having just one station. As of June 2011, Warsaw, Poland; Boston, Massachusetts; and Lansing, Michigan were in the planning stages of adding bicycle sharing systems to their cities. Eric Schertzing, organizer of the Lansing, Michigan effort, said “he envisions bike sharing to be most appealing to downtown employees and tourists, and possibly renters who don’t want to haul bicycles up and down apartment stairs.”

Geographic reference: World
Year: 2008, 2009, 2010
Market size: 92, 160, and 238 stations respectively
Source: “Selling Smart Bicycles: A Delicate Dance, Part 2,” viaCycle, May 26, 2011, available online here; Lindsay VanHulle, “Ingham County Considering $100,000 Bike Sharing Service,” Lansing State Journal, June 23, 2011, available online here; “List of Bicycle Sharing Systems,” Wikipedia, available online here.

“Green” Commuting

Ways to commute to work

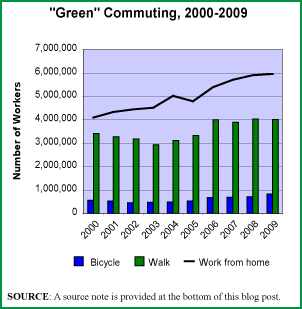
Whenever we hear about the rising price of oil, most of us immediately worry about the increased cost for the gasoline we put in our vehicles to get us to and from work each day. But for some of us, this is not a worry. Although still a small percentage of the working population as a whole, increasing numbers of workers are choosing to bicycle or walk to work. And, some of us who are able are choosing to work from home, thereby not commuting at all. The data show the number of workers 16 years old and over who bicycle or walk to work and those that work from home. Numbers in parentheses represent the percentage of the working population as a whole.

Geographic reference: United States
Year: 2000 and 2009
Market size: Bicycle to work — 566,384 (0.4%) and 831,551 (0.6%) respectively
Market size: Walk to work — 3,417,080 (2.7%) and 4,019,162 (2.9%) respectively
Market size: Work from home — 4,009,006 (3.2%) and 5,959,448 (4.3%) respectively
Source: American Community Survey, various dates, available online here.
Original source: U.S. Census Bureau

NASCAR Attendance

The first decade of this century has been one of great change for auto racing, the sport we call NASCAR (National Association for Stock Car Auto Racing). TV audience ratings have been falling and despite ticket price reductions, so has attendance at NASCAR races since peaking in 2006. The struggles of the auto industry in general may be part of the pall which seems to have fallen upon this sport. Some people blame changes made to increase the safety of the vehicles after the death of one of the sports’ most recognizable drivers, Dale Earnhardt Jr., during a race in 2001 for the declines in NASCAR audiences. Others suspect the recession is having a harder impact on fans of NASCAR than it is on fans of other sports. Whatever the cause, the sport is, for now, in decline.

Today’s market size is the estimated attendance at NASCAR races in the United States for the 2006 and 2010 seasons.

Geographic reference: United States
Year: 2006 and 2010
Market size: 4.6 and 3.6 million respectively
Source: Nate Ryan, “Action on Track Isn’t Helping NASCAR Attendance, Ratings,” USA Today, February 18, 2011, page 2A.
Original source: NASCAR estimates

Recreational Boating

Boat Registrations in Michigan

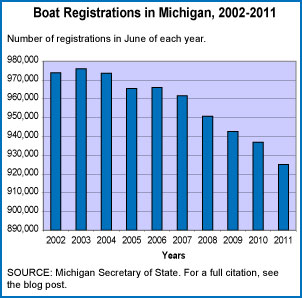
The market size reflects the amount spent on new boats, boating accessories, engines, trailers, and services in Michigan. Despite the fact that the number of boat registrations dropped from 2010, total spending on boats shows a 10.6% increase from a year ago. Nationwide, in 2010, the number of boaters hit a record high of 75 million, or 32.4% of adults. According to the National Marine Manufacturers Association, that’s the highest percentage since 1999.

Geographic reference: Michigan
Year: 2011
Market size: $351 million
Source: Barbara Wieland, “Boating Industry Rides Recovery Wave,” Lansing State Journal, June 19, 2011, page 1E
Original source: National Marine Manufacturers Association.

Airline Industry Worldwide

At the Show in 2009

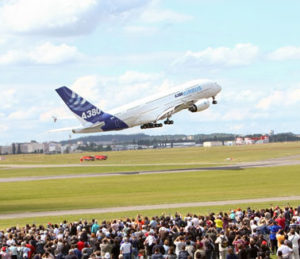
Today’s market size is the estimated net profits of the worldwide airline industry. The Paris Air Show is being celebrated this week and the press coverage of this important aerospace industry show is providing many interesting glimpses of the industry. The most recent recession combined with high energy costs hit the airline industry hard, causing two years of losses. Financial returns in 2010 represent a return to profitability for the industry as a whole. The mood is good at this year’s Paris Air Show as aircraft manufacturers are hopeful that orders will be healthy this year.

Geographic reference: World
Year: 2010
Market size: $18 billion (Global airline industry net profits)
Source: Nicole Clark, “At the Paris Air Show, Anticipating a Surge in Sales,” The New York Times, June 18, 2011, page B1. The image used above is from the Paris Air Show website, here.

Luxury Car Market

Rolls-Royce Hood

Today’s market size is the size of the market in China for luxury automobiles. According to the source, the leading brand of car sold in China in 2010 was the Audi which had the top two best selling models.

Geographic reference: China
Year: 2010
Market size: 458,976 luxury cars
Source: Thompson, Chrissie, “Chinese Bypassing Detroit When They Think Luxury,” Detroit Free Press, May 15, 2011, page 6B. The photo was taken at the 2011 International Auto Show in Detroit, Michigan and while it is not an Audi hood ornament, it is pretty.
Original source: JD Power and Associates

Space Shuttle Services

Photo from NASA

Today’s market size is a bit of an exercise in guessing the low-end, ballpark size of a market for space shuttle services for the coming few years. We base this estimate on three things: (1) NASA’s labor commitments to the International Space Station (ISS) between 2011 and 2017, (2) the per astronaut cost to NASA of a ride to and from the ISS on the Russian Soyuz Spacecraft, and (3) a contract signed by NASA to contract with SpaceX, a private company, to provide cargo delivery services to the ISS. Clearly, this simple estimate is only an approximation of the potential of this market. Defined more broadly—to include, for example, what is often called space tourism—the market size in coming years is much larger.

What we present here is the minimum market size for shuttle services to the ISS based on NASA demand that grows out of the United State’s closing down of its own Shuttle Program.

Happy final journey, Shuttle Endeavor!

Geographic reference: World
Year: 2012—2017
Market size: $3.18 Billion
Source: “NASA’s Cost to Hitch a Ride on Russian Rocket Rises,” CFNews13.com, March 15, 2011, available online here. “How Many Astronauts Does NASA Need?” Universe Today, December 7, 2010, available online here. “The Shuttle Program Is Winding Down—What Next?” PCWorld, May 16, 2011, available online here. Finally, the photo used above is from NASA’s site here.

Barges

Our thoughts turn to those living along the nation’s riverways as news of rising waters and extensive flooding are coming in from all over the Midwest and East Coast. The inland and intercoastal waterway as an important transportation highway then comes to mind, a highway on which hundreds of millions of tons of cargo move annually valued at over $75 billion. Much of this cargo is moved in barges—non-self-propelled vessels—much like rail cars for the waterway system. Barges are tied together and moved through the system by tow boats. Barges are the most energy efficient way to move things. On a ton-mile per gallon basis, (miles per gallon carrying one ton of cargo) trucks get 155 miles, rail transport gets 413 miles and inland towing gets 576 miles per gallon.

Geographic reference: United States
Year: 2008
Market size: 32,052 barges
Source: “TABLE 2: Summary of the United States Flag Passenger and Cargo Vessels Operating or Availalble for Operation by Year,” Waterborne Transportation of the United States, November 16, 2009, available online here. Energy costs per mode of transportation data comes from a report put out by the Kentucky Association of Riverports, available online here. Another Army Corp of Enginners report, titled Inland Waterway Navigation, Value to the Nation, highlights many interesting facts about the inland waterway, including how water transportation compares with other modes in terms of efficiency. It is available online here.
Original source: U.S. Army Corp of Engineers

Snowmobiles in the United States

The United States is a country that loves its motorized vehicles. In rural regions of the country where snow covers the landscape for nearly half the year, snowmobiles serve as both a sporting entertainment as well as a working vehicle. The United States is the largest national market for snowmobiles.

Geographic reference: United States
Year: 2010
Market size: 48,599 snowmobiles sold for an estimated retail value of $414 million.
Source: “Snowmobile Statistics,” International Snowmobile Manufacturers Association, available online here.

Snowmobiles in Canada

As a country with vast expanses of land, often covered by a layer of snow, it is no wonder that Canada is the second largest national market for snowmobiles. What is remarkable is that in 2010 one snowmobile was sold in Canada for every 912 people. So, Canada is by far the leading national market for snowmobiles on a per capita basis.

Geographic reference: Canada
Year: 2010
Market size: 37,670 snowmobiles sold for an estimated retail value of $374 million.
Source: “Snowmobile Statistics,” International Snowmobile Manufacturers Association, available online here.

Snowmobiles

The United States and Canada are by far the two largest national markets for snowmobiles in the world. The United States accounted for 44% of all snowmobile unit sales in 2010 while Canada, with 0.5% of the world population, accounted for 34% of all snowmobile unit sales.

Geographic reference: World
Year: 2010
Market size: 111,492 snowmobiles sold.
Source: “Snowmobile Statistics,” International Snowmobile Manufacturers Association, available online here.

Vehicle Registrations

Here, we look at automobile registrations as well as light truck registrations. These vehicles are used for both personal and commercial purposes but can be seen as primarily vehicles for personal use.

Geographic reference: United States
Year: 2008
Market size: Automobiles, 137.1 million and Light Trucks, 101.2 million
Source: “United States Fast Facts,” State Transportation Statistics 2009, page V.
Original source: Research and Innovation Technology Administration, Bureau of Transportation Statistics, U.S. Department of Transportation

Highway Miles Driven

During this holiday week in which many people will be traveling, we present some market sizes for travel, measured in the number of passenger-miles traveled by different modes of transportation. Today, the miles we travel on highways in passenger cars (56.8% of the total), motorcycles (0.4% of total) and what the Department of Transportation calls “other 2-axle, 4-tire vehicles” (42.8% of total).

Geographic reference: United States
Year: 2008
Market size: 4,493 billion passenger-miles
Source: “Table 1-37: U.S. Passenger Miles (Millions),” Bureau of Transporation Statistics, National Transportation Statistics, available online here.

Recreational Boat Market

Recreational boats

North America is the largest geographical market for recreational boats but growth in this market is anticipated primarily in Europe and the Asia-Pacific areas. Trends show that higher-end and luxury boats will be the area of most market growth in the coming years. The market size listed for 2014 is a forecast based on the source’s research.

Geographic reference: World
Year: 2008 and 2014
Market size: $23.9 billion and $25.8 billion respectively
Source: Travel & Leisure Close-Up, January 15, 2010.
Original source: Research and Markets

Bicycle Market

Bicycle sales in 2009 were down sharply from the two prior years in which 18 million units were sold. The United States is the second largest national bicycle market in the world, second to the leader, China. In terms of types of bicycles, mountain bikes are the leading category with 27.8% of the U.S. market. The other bicycle categories and their respective market shares are as follows: Youth, 21.3%; Hybrid/Cross, 20.4%; Road, 14.9%; Comfort, 10.3%, and Cruiser, 3.3%.

Geographic reference: United States
Year: 2009
Market size: 14.9 million units
Source: “Industry Overview 2009,” 2010
Original source: U.S. Department of Commerce and Gluskin Townley Group

Have a nice weekend everyone!

Global Motorcycle Market

The market is expected to grow as standards of living rise around the world making motorcycles an affordable alternative to bicycles. Continued volatility of prices for gasoline will also favor the sale of motorcycles over automobiles in many markets.

Geographic reference: World
Year: 2008
Market size: 79.2 million units
Source: “World Motorcycles,” August 2009
Original source: Freedonia Group

Airport Car Rental Market in the United States

The leading car rental firms in this market are Hertz (with a 26% market share), Avis (19%), National (12%), Enterprise (10%), Budget (10%), and Alamo (9%). The airport rental car market is one segment of the overall market and represents about half of the total U.S. car rental market.

Geographic reference: United States
Year: 2009
Market size: $10 billion
Source: “Hertz Investor Marketing,” February 10, 2010
Original source: Euromonitor