Farmers Markets

Our selection of a market for today’s post was made to honor National Farmers Market Week.

Over the past 40 years, farmers markets have grown in popularity. As people become more health conscious and demand locally- and organically-grown foods, more and more cities and towns host farmers markets in the summertime. In 2010, there were also nearly 900 farmers markets operating in the wintertime (November through March). According to a new report by an agricultural economist with the Union of Concerned Scientists, increasing the number of farmers markets could create tens of thousands of jobs in economically struggling rural and urban areas.

To promote farmers markets, the U.S. Department of Agriculture instituted National Farmers Market Week in 2000. In 2011, National Farmers Market Week is August 7-13. Data show the number of farmers markets nationwide in 1970 and 2011.

Geographic reference: United States
Year: 1970 and 2011
Market size: 340 and more than 7,000 respectively
Source: “Farmers Markets Boost Local Economies,” WLNS.com, August 4, 2011, available online here; Sam Jones-Ellard, “USDA Highlights Nearly 900 Operating Winter Markets; Many Markets Located in Cold-Weather States,” Agricultural Marketing Service, U.S. Department of Agriculture, December 8, 2010, available online here.

Hop Stocks

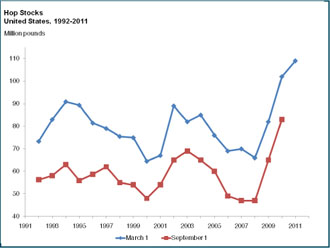
The U.S. Department of Agriculture’s National Agricultural Statistics Agency (NASS) produces annual reports on individual commodities. One of the commodities they track is hops, an aromatic flower used most commonly in the brewing of beer.

The market size presented today is the size of the stock of hops held by hops dealers, hops growers and beer brewers as of March 1, 2011. The graph is a presentation of hops stocks in the United States over a 20-year period and shows how recent stockpiles are at record highs. High stockpiles are a sign of a sluggish market and pressure on pricing, something that has not been seen in most agricultural commodity markets in the last few years.

Geographic reference: United States
Year: 2011
Market size: 109 million pounds
Source: “Hop Stocks,” March 2011, an annual report which is available online here. Unlike most graphs we present on this blog, we did not produce this one. It comes directly from the USDA report.
Original Source: U.S. Department of Agriculture, NASS
Posted on August 1, 2011

Plants and Floriculture Products

In a season when gardens become a big part of many people’s lives, we turn today to a market size about landscaping plant products. Today’s market size is the estimated production value of live plants and products of floriculture in Europe which “include live trees, shrubs and bushes and other goods commonly supplied by nursery gardeners or florists for planting or ornamental use.” In 2010, this represented around 44% of world production.

Geographic reference: European Union
Year: 2010
Market size: €19.7 billion
Source: European Commission, Agriculture and Rural Development, “Live Plants and Products of Floriculture,” May 24, 2011, available online here.

Bulgarian Rose Oil

Rose Pedals

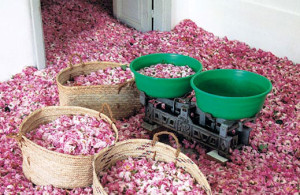
In 2004, supported by the Bulgarian Foreign Ministry, then-Foreign Minister Solomon Passy, and the German non-governmental organization Welthungerhilfe, a project was started in Afghanistan to cultivate Bulgarian Roses as an alternative to growing opium. Bulgarian Roses are unique in that they are cultivated for their oil, which is used in expensive perfumes. The total amount of rose oil produced in the world was 4,000 kilograms in 2010, most of that grown in the Rose Valley of Bulgaria. It takes 3,500 kilograms of rose petals to produce one kilogram of rose oil. One kilogram of rose oil sells for around 4,000-5,000 euros. Although small-scale, the rose oil industry in Afghanistan provides a living wage for 5,000 people. The market size shown is the amount of rose oil produced in Afghanistan in 2010.

Geographic reference: Afghanistan
Year: 2010
Market size: 30 kilograms valued at approximately €135,000
Source: Sofia News Agency, “Afghanistan Shows Off Own ‘Bulgarian Rose’ Oil,” novinite.com, January 24, 2011, available online here. The image used comes from an online article titled “Extract of Bulgarian Rose Oil Contains in Italian Parfume,” published on June 20, 2007, available online here.

Indian Agrochemical Market

India is the fourth largest producer of agrochemicals in the world, behind the United States, Japan, and China. An estimated $17 billion worth of crops is lost every year due to non-use of pesticides. Recently the biofertilizer sector has been trying to educate farmers about biofertilizers and biopesticides in hopes that they will switch from the chemical fertilizers and pesticides to the natural ones. Biopesticides are derived from natural materials such as animal and plant bacteria and certain minerals. According to the source, unlike chemical fertilizers, biofertilizers are effective, non-toxic, and do not lead to the deterioration in quality or fertility of the land. Data for 2012 are projected.

Geographic reference: India
Year: 2008 and 2012
Market size: $1.22 billion and $1.70 billion, respectively
Source: “Indian Agrochemical Industry Expected to Grow to 1.7 Bn by 2012,” The Economic Times, March 2, 2011, available online here.

Agaricus & Specialty Mushrooms

There were 312 growers of agaricus and specialty mushrooms in the United States in the 2009-2010 growing season. Today’s market size is the estimated value of their crop of agaricus and specialty mushrooms. The State of Pennsylvania was the leading state for this crop with a 49.56% share of the total crop. California was the next largest producing state with a 20.78% share and Washington was the third largest with a 2.48% share.

Geographic reference: United States
Year: 2009-2010 Season
Market size: $924.86 million
Source: “Mushrooms,” one in a series of crop reports produced by the U.S. Department of Agriculture, last updated on August 19, 2010. Here is a link to the USDA report on mushrooms.
Original source: U.S. Agriculture Department (USDA)

Peat

Peat poruction and consumption

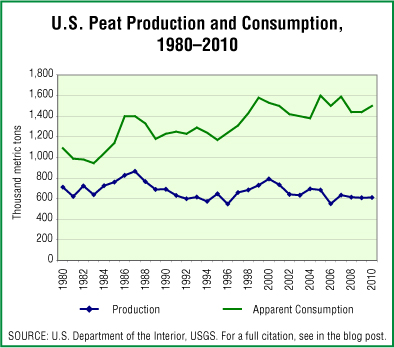
Peat is a natural and renewable organic material that is grown in shallow wetlands, primarily in the Northern Hemisphere. It is used widely as a plant-growth medium because of its unusual ability to both retain water and promote drainage. Peat also has industrial uses as a filtration medium to remove toxins in water processing and as an effective absorbent used in the clean-up of fuel and oil spills.

Today’s market size is the estimated f.o.b. plant value of marketable peat from plants in the United States. The graphic provides a look at peat production and consumption over a thirty year period, from 1980 to 2010.

Geographic reference: United States
Year: 2010
Market size: $16 million
Source: “Peat, Statistics and Information,” Mineral Industry Survey, a series of reports produced by the U.S.Geological Survey, made available online and last updated on May 19, 2011. Here is a link to the USGS site.
Original source: U.S. Department of the Interior, USGS

Chicken Eggs

Poultry and poultry products are a growing agricultural segment in the United States. The state that produces the greatest number of chicken eggs in the United States is Iowa, which in 2010 accounted for 16% of national production. Their leadership in this market is relatively new. As of 1998 Iowa’s chicken egg production accounted for 7.5% of the national total.

Wishes for a happy Easter Holiday to all.

Geographic reference: United States
Year: 1998 and 2010
Market size: 79,717 and 91,398 million eggs
Source: “Chickens and Eggs 2010 Summary,” one in a series of reports put out regularly by the U.S. Department of Agriculture’s National Agricultural Statistics Service. The report is accessible online here. The 1998 data come from an earlier edition of this same report. These earlier USDA reports may be accessed here.

Coffee

Today’s market size offers a measure of the world’s coffee production. The U.S. Department of Agriculture tracks many, many agricultural products, geographically, by output, by shipment and even by consumption. Another example of how the Federal government’s data collection agencies provide us with an extremely valuable service.

Happy tax day!

Geographic reference: World
Year: 2000-2001 and 2010-2011
Market size: 117,521 and 139,084 thousand 60-kilogram bags respectively
Source: “Table 01 – Coffee World Production, Supply and Distribution,” Coffee: World
Markets and Trade,
December 2010, page 4, available online here.
Original source: U.S. Department of Agriculture, Foreign Agricultural Service

Fresh Vegetables, Exports & Imports

Today’s market sizes are the value of fresh fruit exported from and imported into the United States. Two year’s worth of import and export figures are provided. The export values are based on free alongside ship (FAS) values at the U.S. port of exportation while the import values are based on customs value at the U.S. port of entry.

Geographic reference: United States
Year: 2010 and 2020
Market size: Exports: $2,060 and $2,791 million respectively
Market size: Imports: $5,180 and $8,985 million respectively
Source: “Table 29. Horticultural Crops Long-Term Export and Import Projections, Fiscal Years,” USDA Agricultural Projections to 2020, February 2011, page 80, available online here.
Original source: U.S. Department of Agriculture, Interagency Agricultural Projections Committee, and the U.S. Department of Commerce, Bureau of the Census

Fresh Fruit, Exports & Imports

Today’s market sizes are the value of fresh fruit exported from and imported into the United States. Two year’s worth of import and export figures are provided. The export values are based on free alongside ship (FAS) values at the U.S. port of exportation while the import values are based on customs values at the U.S. port of entry.

Geographic reference: United States
Year: 2010 and 2020
Market size: Exports: $3,799 and $5,684 million respectively
Market size: Imports: $6,803 and $11,190 million respectively
Source: “Table 29. Horticultural Crops Long-Term Export and Import Projections, Fiscal Years,” USDA Agricultural Projections to 2020, February 2011, page 80, available online here.
Original source: U.S. Department of Agriculture, Interagency Agricultural Projections Committee, and the U.S. Department of Commerce, Bureau of the Census

Trade in Corn

The United States has long been the world’s leader in the production of corn for export. This trend is expected to continue although the percentage of total corn exports coming out of the United States is projected to fall from 54.5% in 2009-2010 to 52.7% in the growing season 2020-2021. This projection is one among many presented in a report titled USDA Agricultural Projections to 2020. In-depth reports such as this one are being put out regularly by the Federal government’s many agencies.

Today’s market size post is a measure of the corn exported in 2010 and projected exports worldwide in 2020.

Geographic reference: United States and World
Year: 2010 and 2020
Market size: United States: 49.5 and 59.7 million metric tons respectively
Market size: World: 93.1 and 113.2 million metric tons respectively
Source: “Table 5. Corn Trade Long-Term Projections,” USDA Agricultural Projections to
2020,
February 2011, page 49, available online here.
Original source: U.S. Department of Agriculture, Interagency Agricultural Projections Committee

Honey

The U.S. Department of Agriculture’s National Agricultural Statistics Service (NASS) produces annual reports on individual commodities. One of the commodities they track is honey. The market sizes presented today are various years worth of honey production in the United States by producers that have at least 5 colonies of bees.

Geographic reference: United States
Year: 1990, 1993, 2003 and 2009, 2010
Market size: 196, 230, 181, 146 and 176 million pounds respectively
Source: “Honey,” February 2011, February 27, 2004, February 18, 1994, and Feburary 13, 1991. These annual reports are available online here.
Original source: U.S. Department of Agriculture, NASS

Pollinators

An often heard or read phrase related to agricultural production goes as follows: You can thank pollinators for one out of three bites of food you eat. Of course, that assumes you have a nutritionally balanced diet. But the point is clear. One-third of crops used to produce food for human consumption come from plants that depend on pollination to reproduce. In the United States it is estimated that the value annually of crops that are pollinated by insects is $40 billion and this figure does not include the value of non-food crops that also depend upon pollinators, like cotton, for example. The market size figure presented below is an estimated value to the world every year of pollination done by insects and animals.

For anyone not familiar with pollination, it is the process by which pollen is moved from one place on a flowering plant to another. Pollen grains contain the male contribution to the fertilization process and are moved through pollination to the female parts of the plant so that offspring may be produced. Without pollination, a flowering plant will not bear fruit or seeds. Insects and some animals serve as transporters in this process, as does the wind for some plants.

Geographic reference: World
Year: 2010
Market size: $200 billion
Source: “Gold Dusters,” National Geographic, March 2011, page 121.
Original source: United Nations, Food & Agriculture Organization (FAO). Another source of interesting information about pollination and crops is available here from the National Biological Information Infrastructure, a program administered by the U.S. Geological Survey.

Coffee in Puerto Rico

Puerto Rico is experiencing a decline in its coffee production. Over the period from 2002 to 2009 the island saw a decline of more than half in the number of farms growing coffee beans, from 9,000 in 2002 to 4,000 on 2009. According to the source article, the reasons for this decline are varied and include flooding from recent tropical storms as well as difficulty finding enough workers to pick the coffee beans at harvest time. Despite high unemployment rates an estimated $25 million worth of coffee was left unpicked in the 2009-2010 season, according to the Puerto Rico Coffee Buyers & Growers Association.

Geographic reference: Puerto Rico
Year: 2006 and 2010
Market size: 178,000 pounds and 80,000 pounds respectively. The harvest in 2010 had an estimated value of $23 million.
Source: “Sharp Drop in Coffee Production on Puerto Rico Worries Growers,” The Avis, February 19, 2011, St. Croix, Virgin Islands.
Original source: Puerto Rico Coffee Buyers & Growers Association.

Florists

Florists are another retailing segment that has suffered declines as a result of sales transactions of its primary product moving onto the Internet. Florists still handle many things that are not as easily done online. They likely still handle the bulk of large orders and of event related floral needs. But, the decline in their establishment counts, sales and employment do suggest that part of their traditional business has gone elsewhere.

Geographic reference: United States
Year: 1997 and 2007
Market size: Number of Establishments: 26,200 and 19,609 respectively.
Market size: Sales: $6.55 and $6.28 billion respectively.
Market size: Employment: 125,195 and 93,683 respectively.
Source: “Sector 44: EC0744I2: Retail Trade: Industry Series: Preliminary Comparative Statistics for the United States (2002 NAICS Basis): 2007 and 2002,” 2007 Economic Census, available online here. The data from 1997 are from the 1997 Economic Census, after conversion of the data to a NAICS 2002 basis.
Original source: U.S. Department of Commerce, Bureau of the Census.

Yogurt Production

The dairy industry is broken into several product categories. Of these, yogurt is the one that has seen the greatest growth over the last decades. Between 1990 and 2009, the production of yogurt in the United States rose 291.4%. By way of comparison, the U.S. population grew by 24% in this same time period. While production of all dairy products grew, yogurt was by far the leading category. Butter production grew by 20.8% and the production of all cheeses grew 66.78% while the quantity of yogurt almost trebled during this two-decade period.

Geographic reference: United States
Year: 1990 and 2009
Market size: 978.9 million and 3.832 billion pounds respectively.
Source: “Dairy Products, 2009 Summary,” USDA publication, April 2010, page 9, available online here. Data for 1990 are from the 1991 edition of the USDA report.
Original source: U.S. Department of Agriculture, National Agricultural Statistics Service

Buttermilk

The United States produces and consumes a great deal of dairy food, buttermilk being one of the small product categories within this huge market. The market size presented below is the quantity of buttermilk produced in the United States in 2009. It represents 3% of all milk products and a mere 0.6% of all dairy products.

Geographic reference: United States
Year: 2009
Market size: 125.3 million pounds.
Source: “Dairy Products, 2009 Summary,” USDA publication, April 2010, page 9, available online here.
Original source: U.S. Department of Agriculture, National Agricultural Statistics Service

Christmas Trees

For our last market size posting before Christmas, later this week, we thought we’d present some figures on the industry involved in growing all those Christmas trees we decorate this time of year. The market sizes below are the number of trees harvested from Christmas tree farms in 2002 and 2007, a period over which we see a decline in numbers.
Tree Farm

Geographic reference: United States
Year: 2002 and 2007
Market size: 20.8 million and 17.4 million trees respectively
Source: “USDA Census of Agriculture,” update, National Christmas Tree Association, available here. The image of trees being loaded on a truck is from the Pure Michigan website, available here.
Original source: U.S. Department of Agriculture

Turkeys

The size of the market presented here is based on values at the wholesale level, farm receipts for sales of turkeys.

Geographic reference: United States
Year: 2009
Market size: $3.6 billion
Source: “U.S. Farm Sector Cash Receipts from Sales of Agricultural Commodities, 2006-2010F,” a table on the USDA’s Economic Research Service website, available online here.
Original source: Economic Research Service, United States Department of Agriculture