Pens & Markers

While we depend more and more on digital communications, the world of the pen and paper remains strong. Today’s market size is the size of the global market for pens and markers, from fine writing instruments to highlighters.

Geographic reference: World
Year: 2009
Market size: $18.5 Billion
Source: “Rubbermaid, Brands that Matter,” a report on the office products group of NewellRubbermaid, available online here.
Original source: Global Industrial Analysts Report 2008 and 2009, Nielsen, GfK, customer POS data, and 2008 Prismacolor A&U Study

Cloud Computing

A term we hear quite often these days is cloud computing. The personal computer revolution was, in part, a step away from what were then the large, centralized mainframe computers on which data was stored and accessed through workstations. With a personal computer, one had everything on his or her own device. Now, in a way, there is a decoupling again of the data from the device. Cloud computing is, in the simplest terms, the use of a remote location, accessible through the Internet, to store the data and applications used on a computer—instead of a hard drive on the local computer or local network of computers.

This is a growing business but one whose boundaries are still being defined, which makes it difficult to measure. It is hard to keep the image of a person trying to measure a cloud from coming to mind. Consequently, one can find many different size estimates for cloud computing, the differences usually having to do with how the market is defined. What we present here is an estimate of the revenue from business cloud services—hardware and software infrastructure as well as the leasing of space—so it does not include, for example, the services provided to people wishing to back-up their family photo albums. Cloud computing services to the individual is another large business and one that may be included in other estimates of the nebulous cloud computing market.

Geographic reference: World
Year: 2010 and forecast for 2014
Market size: $22.2 billion and $55.5 billion respectively
Source: Lohr, Steve, “The Business Market Plays Cloud Computing Catch-Up,” The New York Times, April 15, 2011, page B16
Original source: IDC

Size of the Labor Force

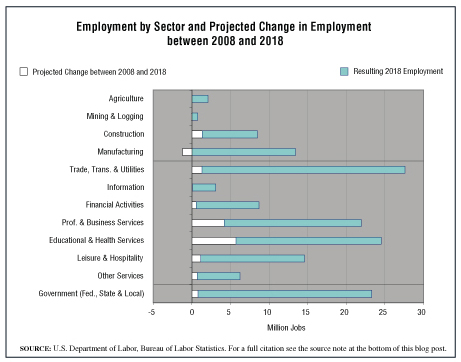
Employment by sector

Today—in honor of International Labor Day, celebrated on May 1st around the world—we provide a market size for the U.S. labor force in both 2008 and 2018. The projected size of the labor force is just one of many interesting projections published in a work titled Occupational Outlook Handbook, published periodically by the U.S. Bureau of Labor Statistics.

Areas that are projected to see the greatest number of new jobs are the Healthcare and Social Assistance Sector (slightly more than 4 million jobs), the Professional, Scientific and Technical Services Sector (2.66 million jobs), and the Educational Services Sector (1.69 million jobs). The white segments of the bars on the graph show the number of jobs expected to be added between 2008 and 2018 for each major industry. When it looks as if there is no white segment for a particular industry’s bar, well, that means the number of new jobs projected is tiny, invisible at this range.

Geographic reference: United States
Year: 2008 and 2018
Market size: 136,800,000 and 166,900,000 respectively, an increase of 22%
Source: “Overview of the 2008-18 Projections,” Occupational Outlook Handbook, 2010-2011 Edition, December 3, 2010, available on the BLS website here.
Original source: U.S. Department of Labor, Bureau of Labor Statistics

BBC Funding

As a bit of a tip-of-the-hat to the royal wedding being celebrated today, we look at the company that will no doubt lead the rest in covering this event, the British Broadcasting Corporation, known around the world as the BBC. Today’s market size is the estimated total value of the annual licensing fee which is levied on every U.K. household that has a television set. This fee was established under law in 1922 and although controversial today, remains in place. The sum collected makes up approximately 80 percent of the BBC’s annual budget.

Geographic reference: United Kingdom
Year: 2010
Market size: £3.6 billion (approximately $5.6 billion based on the exchange rate at the end of 2010)
Source: Lyall, Sarah and Eric Pfanner, “The Beeb Is Struggling to Tighten Its Belt,” The New York Times, April 24, 2011, page B1.
Original source: BBC

Cosmetic Surgery

In China, even a small percentage of the population can be a very large number. This may explain how, according to the source, China is now the third largest national consumer of cosmetic surgery when calculated by the number of procedures performed annually. Today’s market size is the estimated value of cosmetic surgical procedures performed in China last year.

Geographic reference: China
Year: 2010
Market size: $2.3 billion
Source: LaFraniere, Sharon, “For Many Chinese, New Wealth and a Fresh Face,” The New York Times, April 24, 2011, page 6
Original source: Chinese Government estimates

Pets in Japan

Today’s market size is an estimated size for the pet care sector in Japan. This is a measure of the market for all products and services related to household pets. In Japan, one third of this market is made up of pet food. As in the United States, the pet sector is growing strongly in Japan. However, based on a calculation of population to estimated pet dog and cat numbers, fewer than half as many Japanese households have a dog or cat as a pet as U.S. households.

Geographic reference: Japan
Year: 2009
Market size: ¥1.2 trillion (approximately $12.96 billion based on the exchange rate on December 31, 2009)
Source: “At ¥1.2 Trillion, Pet Sector Recession-Proof,” The Japan Times Online, October 28, 2010, available online here.
Original source: Fuji Keisai Company

Chicken Eggs

Poultry and poultry products are a growing agricultural segment in the United States. The state that produces the greatest number of chicken eggs in the United States is Iowa, which in 2010 accounted for 16% of national production. Their leadership in this market is relatively new. As of 1998 Iowa’s chicken egg production accounted for 7.5% of the national total.

Wishes for a happy Easter Holiday to all.

Geographic reference: United States
Year: 1998 and 2010
Market size: 79,717 and 91,398 million eggs
Source: “Chickens and Eggs 2010 Summary,” one in a series of reports put out regularly by the U.S. Department of Agriculture’s National Agricultural Statistics Service. The report is accessible online here. The 1998 data come from an earlier edition of this same report. These earlier USDA reports may be accessed here.

Houseware Sales

Housewares is a category of products covering a large range of different sorts of items. Here is a list: floor care products; metal cookware; kitchen tools & gadgets; plastic storage; air treatment products; blenders & food processors; cutlery; metal bakeware, and toasters. Today’s market size is an estimate of the total retail sales value of all items in this category during 2010. It shows a 2% increase over retail sales in 2009.

Geographic reference: United States
Year: 2010
Market size: $52.2 billion
Source: “It’s Alive! Home Furnishings Sales—Put on Life Support Last Year—Show Signs of Life,” HFN Home Furnishings News, February 2011, page 16.
Original source: McFadden Communications Group LLC

Student Loan Debt

The cost of a higher education has been rising for decades. According to an interesting article on this subject in EconSouth, the Federal Reserve Bank of Atlanta’s quarterly journal, students at four-year colleges and universities paid a national average of between $20,000 and $40,000 last year for tuition, books, and room and board. This range covers a great deal of variation based on geography and type of institution—public or private. It is the average for students living on campus and enrolled in a four-year degree program.

It costs a lot to get a degree these days and this cost is being paid by more people taking on greater and greater levels of debt. Today’s market size is the total debt outstanding, nationally, for student loans. This figure exceeded, for the first time ever in 2010, the national total debt outstanding for revolving credit.

Geographic reference: United States
Year: 2010
Market size: $829.79 billion
Source: “Cap in Hand—The High Price of Higher Education,” EconSouth, first quarter 2011, page 8.
Source: Federal Reserve Bank of Atlanta, College Board, and FinAid.org

e-Filing in the United States

Individual income tax returns were due for 2010 yesterday. A large number of these tax returns are now filed electronically. In 2010 e-filing accounted for 69.3% of all individual income tax forms filed for the tax year 2009. Today’s market size is the number of those returns filed as of December 31, 2010. The IRS expects this figure to rise for coming tax years. Of the returns filed electronically last year, 35.3% were filed by the filer him or herself and the remaining 64.7% were filed by a professional preparer.

Geographic reference: United States
Year: 2010
Market size: 98,740,000 individual tax returns for tax year 2009
Source: “2010 Filing Season Statistics,” an online report made available online by the
IRS here.
Original source: U.S. Internal Revenue Service

Coffee

Today’s market size offers a measure of the world’s coffee production. The U.S. Department of Agriculture tracks many, many agricultural products, geographically, by output, by shipment and even by consumption. Another example of how the Federal government’s data collection agencies provide us with an extremely valuable service.

Happy tax day!

Geographic reference: World
Year: 2000-2001 and 2010-2011
Market size: 117,521 and 139,084 thousand 60-kilogram bags respectively
Source: “Table 01 – Coffee World Production, Supply and Distribution,” Coffee: World
Markets and Trade,
December 2010, page 4, available online here.
Original source: U.S. Department of Agriculture, Foreign Agricultural Service

Fresh Vegetables, Exports & Imports

Today’s market sizes are the value of fresh fruit exported from and imported into the United States. Two year’s worth of import and export figures are provided. The export values are based on free alongside ship (FAS) values at the U.S. port of exportation while the import values are based on customs value at the U.S. port of entry.

Geographic reference: United States
Year: 2010 and 2020
Market size: Exports: $2,060 and $2,791 million respectively
Market size: Imports: $5,180 and $8,985 million respectively
Source: “Table 29. Horticultural Crops Long-Term Export and Import Projections, Fiscal Years,” USDA Agricultural Projections to 2020, February 2011, page 80, available online here.
Original source: U.S. Department of Agriculture, Interagency Agricultural Projections Committee, and the U.S. Department of Commerce, Bureau of the Census

Fresh Fruit, Exports & Imports

Today’s market sizes are the value of fresh fruit exported from and imported into the United States. Two year’s worth of import and export figures are provided. The export values are based on free alongside ship (FAS) values at the U.S. port of exportation while the import values are based on customs values at the U.S. port of entry.

Geographic reference: United States
Year: 2010 and 2020
Market size: Exports: $3,799 and $5,684 million respectively
Market size: Imports: $6,803 and $11,190 million respectively
Source: “Table 29. Horticultural Crops Long-Term Export and Import Projections, Fiscal Years,” USDA Agricultural Projections to 2020, February 2011, page 80, available online here.
Original source: U.S. Department of Agriculture, Interagency Agricultural Projections Committee, and the U.S. Department of Commerce, Bureau of the Census

Trade in Corn

The United States has long been the world’s leader in the production of corn for export. This trend is expected to continue although the percentage of total corn exports coming out of the United States is projected to fall from 54.5% in 2009-2010 to 52.7% in the growing season 2020-2021. This projection is one among many presented in a report titled USDA Agricultural Projections to 2020. In-depth reports such as this one are being put out regularly by the Federal government’s many agencies.

Today’s market size post is a measure of the corn exported in 2010 and projected exports worldwide in 2020.

Geographic reference: United States and World
Year: 2010 and 2020
Market size: United States: 49.5 and 59.7 million metric tons respectively
Market size: World: 93.1 and 113.2 million metric tons respectively
Source: “Table 5. Corn Trade Long-Term Projections,” USDA Agricultural Projections to
2020,
February 2011, page 49, available online here.
Original source: U.S. Department of Agriculture, Interagency Agricultural Projections Committee

Honey

The U.S. Department of Agriculture’s National Agricultural Statistics Service (NASS) produces annual reports on individual commodities. One of the commodities they track is honey. The market sizes presented today are various years worth of honey production in the United States by producers that have at least 5 colonies of bees.

Geographic reference: United States
Year: 1990, 1993, 2003 and 2009, 2010
Market size: 196, 230, 181, 146 and 176 million pounds respectively
Source: “Honey,” February 2011, February 27, 2004, February 18, 1994, and Feburary 13, 1991. These annual reports are available online here.
Original source: U.S. Department of Agriculture, NASS

Wood Containers & Pallets

The economy may be on the mend, slowly, but the severity of the recession that officially began in December 2007 and the specific areas that it hit hardest can now be studied in detail. Economic census data for 2009 are available from the U.S. Census Bureau, an agency whose work is too often undervalued and its value underestimated. Without a clear picture of what is truly going on in the economy, good decisions are hard to make.

We tip our hats to the U.S. Census Bureau and to all the federal agencies dedicated to the collection and compilation of statistical data.

Today’s market size item is based on the value of product shipments made by manufacturers of wood containers and wood pallets.

Geographic reference: United States
Year: 2008 and 2009
Market size: $6.89 and 5.51 billion respectively
Source: “Sector 31: Annual Survey of Manufactures: Value of Products Shipments: Value of Shipments for Product Classes: 2009 and 2008,” 2009 Annual Survey of Manufactures, December 3, 2010, available online here.
Original source: U.S. Census Bureau, Department of Commerce

Educational Services

The educational services covered in today’s market size post are all those not part of the traditional school system—elementary schools, secondary schools, colleges and universities. Think instead of all the other training and educational services that people may need. This market includes all those teaching and training people who wish to learn a new language; learn how to drive; learn how to cut and style hair; learn how to fix cars, leaky pipes, and/or computers; and learn how to be a better nanny, manager, secretary, etc.

This market size is based on estimated annual revenues.

Geographic reference: United States
Year: 2009
Market size: $42.9 million
Source: “Table 12.1. Educational Services (NAICS 61) – Estimated Revenue for Employer Firms: 2009,” 2009 Service Annual Survey, February 2011, available online here.
Original source: U.S. Census Bureau

U.S. Postal Service

The U.S. Postal Service (USPS) employed 656,000 people in 2010 making it one of the largest single employers in the United States. It handles billions of pieces of mail annually and has been in service since before we were even a nation (1775). In fact, the constitution itself calls for the establishment and maintenance of a postal service. While the rise of electronic means of exchanging data has had an impact on the USPS by reducing the number of items it is charged with carrying annually, the USPS continues to provide an important function in our society. Do not be fooled, no for-profit entity would charge the same amount for daily mail pick-up and delivery to those in distant and hard to reach rural areas as it would charge residents of a densely packed city.

It is true that the USPS is operating at a bit of a loss these days but that could be remedied with a few cent increase in the price of a stamp. While the USPS has been downsizing to adjust to the new realities of the Internet age it is also true that from November 1981 to 2010 the price of a standard stamp increased by less than the cost of inflation. The United States has one of the least expensive postal services anywhere. If you’re interested in how the USPS compares with postal rates in other countries, there is a nice chart on that subject available here.

Geographic reference: United States
Year: 1960 and 2010
Market size: Pieces of Mail Handled: 63.7 and 170.6 billion respectively
Market size: Number of Post Offices: 35,238 and 27,077 respectively
Source: Pieces of Mail Handled, Number of Post Offices, Income, and Expenses, 1789 to 2010, available online here.
Original source: United States Postal Service

Advertising

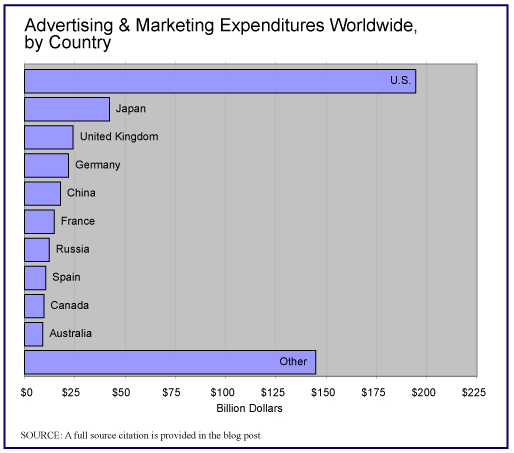
Advertising and Marketing Expenditures Worldwide

The United States is the undisputed leader worldwide when it comes to advertising, accounting for more than a third of all advertising and marketing expenditures worldwide. The chart shows the top ten countries by estimated advertising spending worldwide.

Please note that the graph is made from data that were produced in 2007 as a projection and much has changed since 2007. In fact, the summer of 2007 was a strange time, a time when investment firms were busy trying to pump confidence into a market that was weakening by the day. The report from which we got the figures used in the graph was published by Bear Stearns. In early 2008, Bear Stearns collapsed.

In a way, this example is a warning to all researchers to be careful when making assumptions about market data. By way of providing an interesting range of market sizes for Spending on Advertising and Marketing, we provide two measures for this overall market. One is from the Bear Stearns’ report produced in 2007 with projections for 2009. The other source is Advertising Age. Its estimates have the advantage of reporting on 2009 after the fact. The graph is based on the projected data since that report offered the country-by-country breakdown.

Geographic reference: United States
Year: 2009
Market size: Bear Stearns projection, $194 billion
Market size: AdAge estimate, $125 billion
Source: (1) Advertising & Marketing Services, Bear Stearns, July 2007, page 40. (2) Advertising Age, June 21, 2010, page 10.
Original source: ZenithOptimedia and Ad Age DataCenter.