Golfing

Today we look at the size of the market for golfing related expenditures in Michigan, generated by the organization Executive Women’s Golf Association (EWGA). This nonprofit organization, founded in 1991, has the mission of connecting women with golf for both business advantage and fun.

Geographic reference: State of Michigan
Year: 2010
Market size: $1.1 million
Source: “Seeing Green, Golf Courses Increasingly Catering to Women and Families,” Corp!, July/August 2011, page 20
Original source: EWGA estimates

Freight by Rail

Moving large volumes of freight over long distances is an energy intensive proposal and something we do very regularly these days. In fact, with the rise of globalization humanity is now moving more over greater distances than ever before. Moving cargo by rail is the second most efficient means of transporting it—the first being transport over water. Coal is the commodity whose movement on railroads accounts for the largest percentage of tonnage moved by Class I Railroad operators in the United States (44%) and the largest percentage of gross revenue, when divided out by commodity type, for these operators (24%).

Today’s market size is the tonnage carried by U.S. Class I Railroads in 2010 and the value of the corresponding gross revenue earned for their transportation. The revenue number does not adjust for such things as incentive rebates offered by the railroad operators. U.S. Class I Railroads in 2010 were the following: BNSF Railway, CSX Transportation, Grand Trunk Corporation, Kansas City Southern Railway, Norfolk Southern Combined Railroad Subsidiaries, Soo Line Corporation, and Union Pacific Railroad.

Geographic reference: United States
Year: 2010
Market size: 1.85 billion tons and $57.44 billion in gross revenues
Source: “Class I Railroad Statistics,” June 17, 2011, a report produced by the Policy and Economics Department of the Association of American Railroads. Here is a link to the report.
Original source: Association of American Railroads

Farmers Markets

Our selection of a market for today’s post was made to honor National Farmers Market Week.

Over the past 40 years, farmers markets have grown in popularity. As people become more health conscious and demand locally- and organically-grown foods, more and more cities and towns host farmers markets in the summertime. In 2010, there were also nearly 900 farmers markets operating in the wintertime (November through March). According to a new report by an agricultural economist with the Union of Concerned Scientists, increasing the number of farmers markets could create tens of thousands of jobs in economically struggling rural and urban areas.

To promote farmers markets, the U.S. Department of Agriculture instituted National Farmers Market Week in 2000. In 2011, National Farmers Market Week is August 7-13. Data show the number of farmers markets nationwide in 1970 and 2011.

Geographic reference: United States
Year: 1970 and 2011
Market size: 340 and more than 7,000 respectively
Source: “Farmers Markets Boost Local Economies,” WLNS.com, August 4, 2011, available online here; Sam Jones-Ellard, “USDA Highlights Nearly 900 Operating Winter Markets; Many Markets Located in Cold-Weather States,” Agricultural Marketing Service, U.S. Department of Agriculture, December 8, 2010, available online here.

Beauty Products from France

The newest edition of an important yearly statistical compilation was released recently by the United Nations. Among the things this work provides is a detailed, country-by-country report on exports and imports.

Today’s market size is the value of all beauty or make-up products exported from France in 2008—the peak year in the decade— 2009, and 2010.

Geographic reference: France
Year: 2008, 2009 and 2010
Market size: $6,508; $5,533 and $6,047 million respectively
Source: “International Merchandise Trade Statistics,” Yearbook 2010, report on France, a link to which is available here.
Original source: United Nations

Sporting Equipment — Chinese Exports

The first decade of the 21st century has been one marked by the rapid increase in globalization. As we saw in an earlier market size post, here, world trade increased some 133% between 2000 and 2010. China’s role in this rapidly growing market has increased over this same period from representing 4% of the total world exports in 2000 to 10.7% of the much larger total in 2010, producing a 533% increase in international trade for China over this decade.

Today’s market size is the estimated total value of Chinese export sales of sporting equipment based on export sales for the first six months of 2010 which totaled $2.5 billion.

Geographic reference: China
Year: 2010
Market size: $4 billion
Source: Sporting Equipment, Essential Sourcing Intelligence for Buyers, published September 2010, one in a series of reports called China Sourcing Reports, a sample of which is available online here.
Original source: Global Source

Public Transportation in Detroit, Michigan

In 1945, public transportation in Detroit consisted of 22 streetcar lines. The last streetcar line stopped operation in April 1956. By 2010, public transportation in Detroit consisted of 48 bus routes serving Detroit and 22 surrounding communities. Data show the annual number of passengers that rode these forms of public transportation in the city.

Detroit is known as the home of the auto industry and as such has never been a strong proponent of mass transit. Furthermore, and worth noting in this context, is the fact that in 1945 the City of Detroit had a population of approximately 1,736,000 and in 2010 its population was less than half this number (715,000). Is the shrinking of this once major U.S. city in any way related to its lack of mass transit offerings? That is a question we can not answer in this brief little blog but it is food for thought.

Geographic reference: Detroit, Michigan
Year: 1945 and 2010
Market size: Nearly 500 million and less than 40 million respectively
Source: Doug McInnis, “Talk of the Town: Midtown Detroit Undergoes an Economic Revival,” Wayne State, July 2011, pages 10-19; “DDOT FAQ’s,” available online here.
Original source: 1945 data compiled by the late transit historian Jack Schramm.
Posted on August 2, 2011

Hop Stocks

The U.S. Department of Agriculture’s National Agricultural Statistics Agency (NASS) produces annual reports on individual commodities. One of the commodities they track is hops, an aromatic flower used most commonly in the brewing of beer.

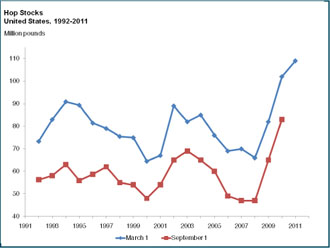
The market size presented today is the size of the stock of hops held by hops dealers, hops growers and beer brewers as of March 1, 2011. The graph is a presentation of hops stocks in the United States over a 20-year period and shows how recent stockpiles are at record highs. High stockpiles are a sign of a sluggish market and pressure on pricing, something that has not been seen in most agricultural commodity markets in the last few years.

Geographic reference: United States
Year: 2011
Market size: 109 million pounds
Source: “Hop Stocks,” March 2011, an annual report which is available online here. Unlike most graphs we present on this blog, we did not produce this one. It comes directly from the USDA report.
Original Source: U.S. Department of Agriculture, NASS
Posted on August 1, 2011

Visitors to Midtown Detroit

In recent years, Midtown Detroit has seen an economic revival. The area is a major destination for visitors to Detroit. The number one destination is the main branch of the Detroit Public Library, followed by The Detroit Institute of Arts across the street. Data show the annual number of visitors.

Geographic reference: Midtown Detroit, Michigan
Year: 2010
Market size: Nearly 1.9 million people
Source: Doug McInnis, “Talk of the Town: Midtown Detroit Undergoes an Economic Revival,” Wayne State, July 2011, pages 10-19
Original source: University Cultural Center Association.

Packaging Machinery

Packaging Machinery Industry Shipments

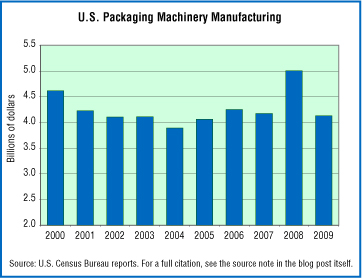
Most products sold are packaged for shipping and additionally, for items sold through retail outlets, for presentation within a retail setting. All that packaging uses a lot of material and sophisticated machinery is used to actually do the packaging. The machines used to do the packaging—be that bottling, canning, labeling or wrapping—are what we look at in today’s market size post.

Today’s market size is the value of all shipments by U.S. manufacturers of packaging machinery in 2009. The graphic presents data on this industry’s shipments over the past decade and shows a pattern that bucks the trend seen in most U.S. manufacturing industries.

Geographic reference: United States
Year: 2009
Market size: $4.13 billion
Source: “Sector 31: Annual Survey of Manufactures: General Statistics: Statistics for Industry Groups and Industries: 2009 and 2008,” 2009 Annual Survey of Manufactures, NAICS Industry 333993, data released on December 3, 2010, available online here. Data used to produce the graph come from a series of Census Bureau reports that have been combined with other industry data and presented with a long historical perspective in a work edited by Joyce P. Simkin titled Manufacturing & Distribution USA, Sixth Edition, published by Gale—Cengage Learning in 2011, Volume 2, page 1115.
Original source: U.S. Bureau of the Census

Home Equity Lines of Credit

Home equity lines of credit, also known as second liens, are part of the overall financial sector and part of the troubled housing sector as well. The bursting of the housing bubble in early 2008 started what became a worldwide financial crisis which is still destabilizing financial markets around the globe to this day. The housing market in the United States is still very unstable with an estimated 23% of mortgage holders owing more on their mortgages than the current value of the asset for which the loan was acquired (e.g. they are underwater). Of mortgaged properties that are underwater, approximately 40% also carry a home equity line of credit worth an average per property of $65,000. We should expect to see continued write-downs within the banking industry related to the housing crisis for some time to come.

Today’s market size is the value of bank holdings in home equity loans as of the first quarter of 2011.

Geographic reference: United States
Year: First quarter of 2011
Market size: $624 billion
Source: Gretchen Morgenson, “2nd Loan, 2nd Wave of Losses,”, The New York Times, July 17, 2011, page B1.

Bicycle Share Systems

“When I see an adult on a bicycle, I do not despair for the future of the human race.” — H.G. Wells

Bicycle sharing is a system in which bicycle stations are set up at various places around a city. Each station can have tens, hundreds, or thousands of bicycles for rent, depending on demand. Customers rent the bicycles by the hour or by the day and then return them to the nearest bicycle sharing station.

These bicycle sharing systems are currently much more popular in major European cities than they are in cities in the Americas. However, the United States outranks any other country when it comes to bicycle sharing systems on college and university campuses with 24 such systems nationwide. Mexico, Philippines, and the United Kingdom are the only other countries with bicycle sharing systems on college campuses, each having just one station. As of June 2011, Warsaw, Poland; Boston, Massachusetts; and Lansing, Michigan were in the planning stages of adding bicycle sharing systems to their cities. Eric Schertzing, organizer of the Lansing, Michigan effort, said “he envisions bike sharing to be most appealing to downtown employees and tourists, and possibly renters who don’t want to haul bicycles up and down apartment stairs.”

Geographic reference: World
Year: 2008, 2009, 2010
Market size: 92, 160, and 238 stations respectively
Source: “Selling Smart Bicycles: A Delicate Dance, Part 2,” viaCycle, May 26, 2011, available online here; Lindsay VanHulle, “Ingham County Considering $100,000 Bike Sharing Service,” Lansing State Journal, June 23, 2011, available online here; “List of Bicycle Sharing Systems,” Wikipedia, available online here.

Summer Camp

Today’s market size is the estimated annual number of people attending an organized camping experience of the sort run by the nation’s roughly 12,000 camp organizations. Of these organizations, about two-thirds are non-profits and the rest are privately owned. Most of the people attending camps are children enrolled in summer camps, camps which are tending increasingly towards specializations such as a focus on a particular sport, an artistic pursuit (e.g. music) or an academic area of study (e.g. science).

Geographic reference: United States
Year: 2011
Market size: 11 million
Source: Natasha Singer, “When S’Mores Aren’t Enough,” The New York Times, July 10, 2011, page B1.
Original source: American Camp Association

Hungarian Import Market

The newest edition of an important statistical compilation produced annually was released recently by the United Nations. The work is listed fully in the source note below.

Today’s market size is the size of the Hungarian market for those exporting to Hungary, thus, the size of the Hungarian market for imports. Over the last decade, Hungary saw the value of its imports rise by 174% but saw exports rise even more (238%) producing a positive trade balance for the nation in 2010.

Geographic reference: Hungary
Year: 2010
Market size: $87,612 million
Source: “Total Imports and Exports by Regions and Countries or Areas (TableA)”, 2010 International Trade Statistics Yearbook, Vol. 1—Trade by Country, June 16, 2011, available online here.
Original source: United Nations, International Merchandise Trade Statistics Section

Catholic Diocesan Newspapers and Magazines

Today’s market size is a measure of the market for Catholic diocesan newspapers and magazines measured in circulation figures. The figures are rounded.

Geographic reference: United States and Canada
Year: 2010
Market size: 13 million households
Source: Sam Ludero, “Bishop: Newspapers Need Attention, Still Have Major Role,” The Catholic Times, July 2 – July 8, 2011, page 1
Original source: Catholic Press Association’s official directory
Posted on July 14, 2011 — Happy Bastille Day to our French friends!

Fish Catch

While many spend summer hours in the often leisurely act of fishing, we look today at fishery production for our market size. The market presented below is the size of the domestic catch in the United States for 2008. This does not include, of course, all those Rock Bass, Walleye, Trout, Bluegill, Pike and Perch being pulled from lakes and streams all over the country by sports fisherman. Rather it is the size of the commercial catch.

Geographic reference: United States
Year: 2008
Market size: 8,326 million pounds
Source: “Table 889. Fishery Products—Domestic Catch, Imports, and Disposition: 1990 to 2008,” Statistical Abstract of the United States 2011, January 2011, page 566, available online here.
Original source: U.S. Census Bureau

World Trade

The newest edition of an important yearly statistical compilation was released recently by the United Nations. The work is listed fully in the source note below. The statistics in this work help quantify the term globalization, so often heard but not, perhaps, fully understood for the transformative impact that it is having on world trade.

Today’s market size is the size of all exports worldwide as valued in dollars. Total exports in 2000, as well as 2010, are provided and the 133% increase is noteworthy. The peak year in this decade was 2008.

Geographic reference: World
Year: 2000 and 2010
Market size: $6,337,820 and $14,784,130 million respectively
Source: “World Exports by Provenance and Destination (TableD)”, 2010 International Trade Statistics Yearbook, Vol. 1—Trade by Country, June 16, 2011, available online here.

“Green” Commuting

Ways to commute to work

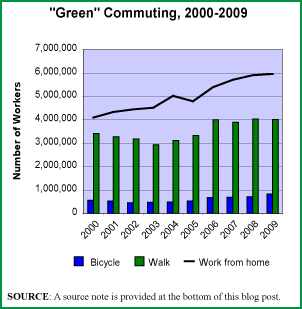
Whenever we hear about the rising price of oil, most of us immediately worry about the increased cost for the gasoline we put in our vehicles to get us to and from work each day. But for some of us, this is not a worry. Although still a small percentage of the working population as a whole, increasing numbers of workers are choosing to bicycle or walk to work. And, some of us who are able are choosing to work from home, thereby not commuting at all. The data show the number of workers 16 years old and over who bicycle or walk to work and those that work from home. Numbers in parentheses represent the percentage of the working population as a whole.

Geographic reference: United States
Year: 2000 and 2009
Market size: Bicycle to work — 566,384 (0.4%) and 831,551 (0.6%) respectively
Market size: Walk to work — 3,417,080 (2.7%) and 4,019,162 (2.9%) respectively
Market size: Work from home — 4,009,006 (3.2%) and 5,959,448 (4.3%) respectively
Source: American Community Survey, various dates, available online here.
Original source: U.S. Census Bureau

Cement in China

The rise of China as an economic powerhouse has been a significant development in this century so far. Building an economic powerhouse requires building and building requires building materials, one of the oldest of which is cement. China has invested heavily in its cement production capacity, nearly tripling its clinker production capacity between 2000 and 2010 according to the U.S. Geological Survey. Clinker is, in the most basic sense, a coarse form of cement which has yet to be ground down into the fine powdery substance that is cement, the glue that binds all the ingredients of concrete together.

Today’s market size is the size of cement production capacity in China in 2010.

Geographic reference: China
Year: 2010
Market size: 2.41 billion tons
Source: “Chinese Production Statistics for 2010,” Global Cement Weekly, July 6, 2011, page 1.
Original source: OneStone Research

High-Deductible Health Insurance Plans

High-deductible health insurance plans have lower premiums than traditional coverage but the insured pays quite a bit more out-of-pocket before any coverage starts. If the deductibles in such plans are at least $1,200 for individuals and $2,400 for families, the plans can be paired with Health Savings Accounts (HSAs). HSAs allow employees to deposit pre-tax income to pay for medical expenses. In many cases, employers also contribute to their employees’ HSAs.

Today’s market size shows enrollment for high-deductible health insurance plans with health savings accounts as of January of that year. In 2011, this represented 7% of all health insurance enrollment for people younger than 65.

Geographic reference: United States
Year: 2008 and 2011
Market size: 6.1 million and 11.4 million respectively
Source: Tom Murphy, “More Are Enrolling in High-Deductible Plans,” Lansing State Journal, June 19, 2011, page 3E
Original source: America’s Health Insurance Plans

Fireworks

The sale of fireworks in the United States has been a healthy business for ten plus years now, showing little or no sign of decline during the recession of 2007–2009. In fact, according to the American Pyrotechnics Association, each year of the decade between 2000 and 2010 saw increased revenues for the industry, averaging 5.7% growth annually. In terms of explosive power, measured in pounds of explosive material, however, 2005 was the peak year.

Sales to the public, in general, make up approximately two-thirds of fireworks industry sales. The steadily rising sales in this industry are, in part, due to an increasing number of states that allow for the sale of fireworks. Only four states, as of January 2011, continue to ban the sale of fireworks. Restrictions on the use of fireworks are, however, more widespread.

Today’s market size is total fireworks industry revenue and total pounds of explosives sold in various years.

Geographic reference: United States
Year: 2000, 2005 and 2010
Market size: 2000 — $610 million and 152.2 million lbs.
Market size: 2005 — $880 million and 281.5 million lbs.
Market size: 2010 — $952 million and figures on the number of pounds of explosives that were sold are not yet available.
Source: “Fireworks Industry Facts & Figures,” a website with industry statistics offered by the American Pyrotechnics Association and available here.