Canned Clams

U.S. canned clam production in 2010 is the market size today. The value per pound for canned clams in 2010 was just shy of one dollar ($0.89). As compared with the highest volume canned fish product, namely tuna, canned clams were 27.7% of tuna by weight and 13.5% by value.

Geographic reference: United States
Year: 2010
Market size: 109.3 million pounds at a value of $97.2 million
Source: “Fisheries of the United States–2010,” August 2011, page 42, available online from the National Marine Fisheries Service website, here.
Original source: National Oceanic and Atmospheric Administration (NOAA), Office of Science and Technology, National Marine Fisheries Service, USDA
Posted on October 25, 2012

Baseball Equipment

Go Tigers!

Today we look at the market for baseball equipment: bats, shoes, gloves and balls. The market size presented below is for baseball equipment used by all those playing the game, from Little League teams to those playing for Major League Baseball.

Our selection of topic today is not without an alterior motive, namely to cheer on our local team as it prepares to play game one of the 2012 World Series of Baseball.
Go Tigers!

Geographic reference: United States
Year: 2005
Market size: $615 million
Source: “The Baseball Market,” 2006, The Active Network Inc., available online here.
Posted on October 24, 2012

Classic Cars

Concours d'Elegance, summer 2011, Michigan

The market for classic cars has been very strong over the last two decades in the United States. It is one of the niche markets used by the well-heeled as both an investment vehicle and a hobby. Today’s market size is the approximate value of classic car auction sale totals in 1995 and 2011.

Geographic reference: United States
Year: 1995 and 2011
Market size: $45 million and $500 million respectively
Source: Scott Rosenblatt, “Total Auction Sales,” Classic Cars: Your Portfolio’s Midlife Crisis, Credit Suisse, 2012, page 21, available online here.
Original source: Classic Car Auction Yearbook (data Historica Selecta)
Posted on October 23, 2012

Waste Collection Services

Revenue annually

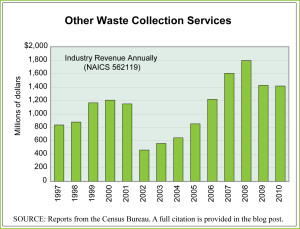
Dealing with waste is big business and one likely to continue to thrive as basic commodity prices rise, making the segregation of reusable materials from our overall waste flow more economical. Today we look at one of the industries in the larger Waste Management sector.

This industry is defined by the U.S. Census Bureau as comprising “establishments primarily engaged in collecting and/or hauling waste (except nonhazardous solid waste and hazardous waste) within a local area.” This includes all firms involved in the collection of nonhazardous waste and recyclable materials from homes, businesses, construction sites, government facilities, commercial centers and the like. This industry does not include standard garbage collection firms that collect solid waste on a regular schedule nor firms that handle hazardous waste. Worth noting is the fact that in 2010 the U.S. industry being highlighted here had revenues equal to 3.7% of those reported by the larger, solid waste collection firms that run regular routes and collect the vast majority of our solid waste.

The graph shows U.S. industry revenues annually over the period 1997 to 2010. The industry grew by 69% over this period but as the pattern on the graph shows, it is not immune to economic cycles. For anyone interested in knowing more about the trends in the United States regarding how much we throw away and how much we recycle, here is an interesting blog post showing several decades worth of such trends graphically.

Geographic reference: United States
Year: 1997 and 2010
Market size: $838 million and $1.4 billion respectively
Source: “Table 7.1. Administrative and Support and Waste Management and Remediation Services (NAICS 56) – Estimated Revenue for Employer Firms: 2002 Through 2010,” 2010 Service Annual Survey, produced in all non-economic census years and available online here. The graphic supplements the 2010 Service Annual Survey data with data from prior editions of the same report, also available online, at the Census Bureau’s website, here.
Original source: U.S. Department of Commerce, Bureau of the Census
Posted on October 18, 2012

Fish Sticks

Fish sticks—oblong pieces of fish that are breaded and usually frozen before final preparation—are a popular food in the United States and for many children they are the primary form in which seafood is eaten. Today’s market size is the volume and value of fish stick production in the United States in 2010.

Geographic reference: United States
Year: 2010
Market size: 82.9 million pounds at a value of $113.8 million dollars
Source: “Fisheries of the United States–2010,” August 2011, page 42, available online from the National Marine Fisheries Service website, here.
Original source: National Oceanic and Atmospheric Administration (NOAA), Office of Science and Technology, National Marine Fisheries Service
Posted on October 15, 2012

Launchers for UAVs

Some unmanned aerial vehicles (UAVs) are controlled by a navigator from a remote location and others fly autonomously based on pre-programmed flight plans. These aircraft carry cameras, sensors, and communication equipment. Unmanned combat aerial vehicles, also known as combat drones, are armed and have been used in various wars since the 1980s.

Although unmanned aerial vehicles are used primarily by the military, recently they’ve also been used in fighting large fires, in support of border patrol activities, and in the surveillance of pipelines. Launchers for these vehicles are portable so that they can be placed in remote areas, without a need for an airport. They are also modular so that components can be replaced easily and used in multiple configurations. Data show the market size of the launchers for unmanned aerial vehicles for 2011 and estimated market size for 2018.

Geographic reference: Worldwide
Year: 2011 and 2018
Market Size: $118 million and $1.3 billion respectively
Sources: “Summary: Launchers for Unmanned Aerial Systems and Targets: Market Shares, Strategies, and Forecasts, Worldwide, 2012 to 2018,” ReportLinker, August 2012, available online here; “Unmanned Aerial Vehicle,” Wikipedia, October 7, 2012, available online here; “Unmanned Combat Air Vehicle,” Wikipedia, October 2, 2012, available online here; and “Unmanned Aerial System,” Institute for Defense and Government Advancement, 2012, available online here.
Posted on October 12, 2012


Musical Instruments

Manufacturer product shipments

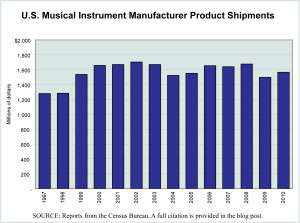
In a recent New York Times article about leading electric guitar maker, Fender, we found the size of the retail sales figure for musical instruments in the United States. But, it made us think, what about musical instrument manufacturing in the United States? It turns out that U.S. musical instrument manufacturers are weathering the 2007–2009 recession and slow recovery since reasonably well.

The graph presents data from the U.S. Census Bureau on musical instrument manufacturer product shipments annually from 1997 through 2010. The value of U.S. made musical instruments grew, if slightly, over this period. When compared with the value of musical instrument imports, we look at a different time period, 2000 to 2010. Over the first decade of the new century, the value of U.S. made musical instruments fell by 5.5% while the value of musical instrument imports fell 7.0%.

Today’s market size is the value of all musical instrument sales in the United States in 2011. Please note that the figures in the graphic are not retail sales, rather values based on wholesale values.

Geographic reference: United States
Year: 2011
Market size: $6.5 billion
Source: Janet Morrissey, “Aiming To Stay Plugged In,” September 30, 2012, The New York Times, page B1. The graphic was produced with data from the “Annual Survey of Manufactures: General Statistics: Statistics for Industry Groups and Industries: 2010 and 2009,” and earlier “Annual Survey of Manufacturer” reports on the industry, NAICS 339992 Musical Instrument Manufacturing. The Census Bureau data are available online through their American FactFinder website, here.
Original source: Music Trades
Posted on October 9, 2012

Toner Market

Today’s market size is the estimated total size of the world’s output of toner. This post comes from a 2008 industry study in which trends in the toner market are assessed and shipments are forecast through 2012.

Geographic reference: World
Year: 2006 and 2012
Market size: 195,599 tons and 256,162 tons respectively
Source: “Toner Market Forecast 2008 Version,” October 2008, a multi-client study produced by Data Supply Inc. and available online here.
Original source: Data Supply, Inc.
Posted on October 8, 2012

Pickles

Gerkins

Today’s market size is the size of the market of U.S. produced pickles and pickled products in 2005 and again in 2010. The values listed are for product shipments from the pickles and other pickled products industry (NAICS 311421P) as reported on by the U.S. Census Bureau in its reports on the manufacturing industry.

Geographic reference: United States
Year: 2005 and 2010
Market size: $1.31 and $1.46 billion respectively
Source: “Annual Survey of Manufactures: Value of Product Shipments: Value of Shipments for Product Classes,” the 2005 and 2010 editions, available online from the American Factfinder, for 2005, here, and for 2010, here.
Original source: U.S. Departemnt of Commerce, Bureau of the Census
Posted on October 2, 2012

Self-Storage Services

After decades of healthy consumer spending in the United States, it should not be a surprise that the self-storage business is doing very well in the country. Of the approximately 58,500 self-storage facilities in the world, 92% are located in the United States. We have accumulated more than we can fit in our homes and as of 2010 an estimated 10% of American households rented space in a self-storage facility in order to house their things.

Primary self-storage facilities—those for whom self-storage services were their primary business—generated revenues of $22.45 billion in the United States in 2011. It is a big business and one that has in recent decades been far more immune to economic cycles than most other businesses. Today’s market size is the actual size, in number of square feet, of interior storage space available in the United States in 1984 and in 2010.

Geographic reference: United States
Year: 1984 and 2010
Market size: 289.7 million and 2.24 billion square feet respectively. In per capita terms, we’ve grown from 1.23 square feet worth of storage capacity per person in 1984 to 72.2 square feet per person in 2010.
Source: “Self Storage Association Preamble,” June 2012, a detailed fact sheet on the industry that is presented by the association on its website here.
Original source: Self Storage Association
Posted on September 28, 2012

Home Wireless Routers

Many people who own tablet computers, laptops, and e-readers own wireless routers. Wireless routers allow them to connect to the Internet through these devices from anywhere in their homes. Data show sales of home wireless routers in 2005 and 2011.

Geographic reference: United States
Year: 2005 and 2011
Market Size: $700 million and $1.3 billion respectively
Source: Tamara Chuang, “When the Home’s Most Important Internet Device Fails,” The Street, September 17, 2012, available online here.
Original Source: Dell’Oro Group
Posted on September 26, 2012

Waste & Scrap Exports

U.S. Waste Exports 2000-2011

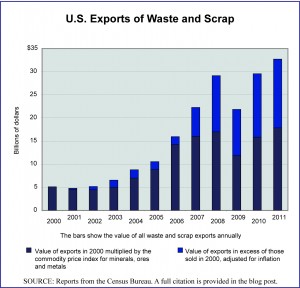
With the growth of globalization and the increased demand on raw materials, the prices of basic commodities such as minerals, metals, wood, and paper have been volatile and have risen sharply since 2000. This has stimulated the trade in reusable waste and scrap materials, including international trade. Today’s market size is the value of all waste and scrap material exported from the United States in 2000 and in 2011.

The graph presents these data as well as the figures for the intervening years. It also shows by a differentiation in color on each bar the approximate share of the increased export value that is attributable to rising commodity prices and the share that is the result of actual increased volume. The dark blue portion of each bar is the value of exports in 2000 multiplied by the international commodity price index for minerals, ores and metals. (Please note that the Waste & Scrap category as a whole includes more than just minerals, ores and metals—although they do dominate the trade—therefore this calculation provides only an approximation). The lighter blue portion of each bar is the value of exports in excess of the inflation-adjusted value of exports in the year 2000.

Geographic reference: United States
Year: 2000 and 2011
Market size: $5.12 and $32.74 billion respectively
Source: “U.S. International Trade Statistics,” (910 Waste and Scrap), a searchable database presented by the Census Bureau and availalble online here. The commodity price index data used to calculate the inflation adjusted value of the 2000 exports is from “Free Market Commodity Price Indices, 1960–2011,” a report from the United National Conference on Trade and Development available online here.
Original source: U.S. Department of Commerce, Bureau of the Census and the UNCTAD
Posted on September 24, 2012

Milk

Today’s market size is the size of milk production in the United States in 2007 and 2011. Milk prices in 2011 were at an historic high, in part because the costs of feed were also very high. The drought of 2012 has only served to tighten the feed market further and it is anticipated that both feed and milk costs will continue to rise through 2012 and beyond.

Geographic reference: United States
Year: 2007 and 2011
Market size: 185,655 and 196,246 million pounds
Source: “Milk Cows and Production by State and Region,” September 20, 2012, part of a series of reports produced by various agencies within the USDA’s Economic Research Service and available online here.
Original source: U.S. Department of Agriculture
Posted on September 21, 2012

Child Care Services

Child Care Revenues Annually

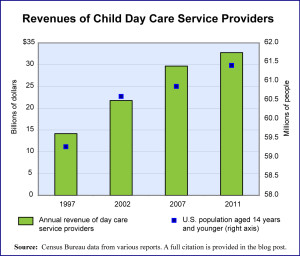
The demand for child care services fell during the 2007–2009 recession as rising unemployment destroyed some of the demand for these services by those no longer employed. The graph shows annual revenue for child day care service providers as well as the U.S. population aged 14 years or younger for each of the years shown. The growth in population in this age group was 36% over this period (1997–2011) while the inflation-adjusted rate of growth in revenues of child day care service providers was 52%.

The revenue data shown here are from reports on the industry as defined by the U.S. Census Bureau with the NAICS code 6244: Child Day Care Services.

Geographic reference: United States
Year: 2002 and 2011
Market size: $21.7 and $32.8 billion respectively
Source: Annual and Quarterly Services, part of quarterly reporting on the service industry as a whole done by the Census Bureau and made available online here. For the years prior to 2011, data are from the Economic Census reports for the years 1997, 2002, and 2007.
Original source: U.S. Department of Commerce, Bureau of the Census
Posted on September 19, 2012

Veterinary Services

According to the American Pet Products Association, 62% of households in the United States (72.9 million) owned at least one pet in 2011. From 2006 to 2011, the price of veterinary care increased 46%. Data show the amount pet owners spent on veterinary services in 2011. This was slightly more than 25% of all pet-related spending by pet owners. In 2012, spending on veterinary care is expected to rise to $13.6 billion.

Geographic reference: United States
Year: 2011
Market Size: $13.4 billion
Source: “Industry Statistics & Trends,” American Pet Products Association, available online here and ASPCA Pet Health Insurance: New Member’s Guide to Coverage, 2012.
Posted on September 18, 2012

Charitable Giving

Today’s market size post provides a measure of charitable giving in the United States last year. Charitable giving was greatly impacted by the recession and financial system melt-down of 2007–2009 but contributions have been rising as the economy recovers, slowly. In 2011, charitable giving totals were up 4% over giving in the prior year but were still 11% lower than the total giving in 2007. Of interest is the fact that contributions made by individuals accounted, in 2011, for 73% of all charitable giving in the United States.

Geographic reference: United States
Year: 2011
Market size: $298 billion
Source: “Giving Statistics,” National Park Service website posting with a great deal of information reproduced from the report listed below as the Original Source. Here is a link to the National Park Service website.
Original source: Giving USA 2012, American Association of Fundraising Counsel.
Posted on September 14, 2012

Food and Beverage Store Sales

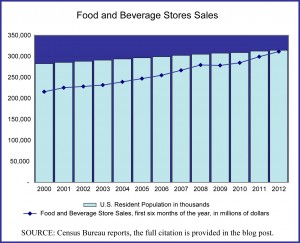
Food & Beverage Store Sales

In the United States, people pay less for food than anywhere else in the world, as a percentage of their total expenditures. Here is a link to a site with a very interesting world map showing U.S. Department of Agriculture and Euromonitor data on how much of our total expenditures we spend on food worldwide, nation by nation. As many people worry about the cost of food rising it is worth noting, at the most basic level, just how inexpensively we’re able to feed ourselves in the United States.

Today’s market size is the value of food and beverage store sales in the United States for the first six months of 2000 and 2012. The graph shows the first six months of each year’s food and beverage store sales for the entire period.

Geographic reference: United States
Year: 2000 and 2012 (January – June)
Market size: $215.6 and $311.2 billion respectively
Source: Monthly Retail Trade Report, August 14, 2012, part of a series of reports by the U.S. Census Bureau, available online here.
Original source: U.S. Department of Commerce
Posted on September 13, 2012

Growing Market for Epinephrine

Anyone with a child in school these days is likely to be very aware of the growing concerns related to food allergies. In many elementary schools in the United States, special tables in the lunch room are set aside for children whose lunches contain any nuts, like the traditional peanut butter and jelly sandwich. In some schools, foods containing nuts of any kind are banned entirely. This is because of a rising number of children who suffer from food allergies, particularly nut allergies, and the rising severity of their allergic reactions.

Nut allergies have been the fastest growing food allergies in recent years. In 1997, approximately 278,000 children under the age of 18 in the United States (0.04% of the age group) suffered from an allergy to peanuts. In 2008, that number had risen to over a million (1.5% of children in the age group).

Today’s market size is the estimated number of children (under the age of 18 years) in the United States who suffer severe food allergies. It is a calculation based on a study that showed that one in thirteen children suffer food allergies and that nearly 40 percent of those children suffer severe allergic reactions, severe enough to require the use of a drug like epinephrine to combat the reaction and save their lives.

Geographic reference: United States
Year: 2010
Market size: 2.28 million
Source: Katie Thomas, “Tiny Lifesavers for a Growing Worry,” The New York Times, September 8, 2012, page B1. Population data used to calculate today’s market size are from “Table 1. Population by Sex and Selected Age Groups: 2000 and 2010,” Age and Sex Composition: 2010, May 2011, one of the Census Bureau’s reports on the 2010 Census of the United States, available here.
Original source: A study published in the journal Pediatrics and referenced in the source article listed above.
Posted on September 12, 2012

Military Expenditures Worldwide

On the 11th anniversary of terrorist attacks on the United States, we look at military spending for today’s market size post. According to a recent report by the Stockholm International Peace Research Institute which tracks military spending worldwide, the response to the September 11 attacks was “one of the dominating factors of the global security environment over the past 10 years, and a key factor influencing military spending in many countries.

Today’s market size is the measure of all military expenditures by countries around the world in 2011, of which the top three by overall spending were the United States with 41% of the total expenditure, China with 8%, and Russia with 4%.

Geographic reference: World
Year: 2011
Market size: $1.738 trillion
Source: SIPRI Yearbook 2012, Armaments, Disarmament, and International Security, Summary, pages 8-9, published in 2012 by the Stockholm International Peace Research Institute. The summary report is availalble online here.
Original source: SIPRI
Posted on September 11, 2012

Public School Students

School bus arrives on day 1

As the summer comes to a close and school-aged children head back to school we present the estimated number of children in the United States attending public elementary or secondary schools during the 2011-2012 academic year. Worth noting is the fact that, based on 2010 U.S. Census data, there were 53,980,105 people in the United States between 5 and 17 years of age, the age range of the majority of those in the elementary and secondary school system at the beginning of an academic year.

Geographic reference: United States
Year: 2011-2012
Market size: 49,255,742 students, 61.4% of whom were elementary level students and 38.6% secondary school level students.
Source: “Highlights Table 1. 2011–12 versus 2010–11: Estimates for 50 States and D.C. Statistics of Public Elementary and Secondary School Districts,” page 66. Rankings & Estimates, a report by the National Education Association (NEA) dated December 2011, available online here. The population figure mentioned above is from a U.S. Census Bureau report, available here.
Original source: NEA
Posted on September 4, 2012